


Fundamental Premise:
One of the fundamental ideas I have come to learn in macro is that the financial system connects EVERYTHING. When you enter the financial system, every person’s asset is another person’s liability and every person’s liability is someone else’s asset. As a result, every economic activity becomes cross-collateralized. In other words, every asset and economic activity becomes intricately linked because the banking sector provides the flow of credit that is constantly facilitating all action. This has two very tangible implications for the research I am going to lay out today.
The banking system is one of the most important to monitor because it is the spigot that feeds credit and liquidity to all financial transactions and economic activity.
When you understand this core logic of the system, the correlations and feedback loops begin to make A LOT more sense. As a result, watching the internal developments in every sector as they connect to the banking sector takes an outsized significance. This is WHY Druck has his famous quote:
"The best economist I know is the inside of the stock market. It always has a bead on the future."
- Stanley Druckenmiller:
Big Picture:
Below is a chart of the major banking indices tracking the largest banks in the S&P500, Nikkei, Eurostoxx, DAX, and FTSE. This is probably one of the most important charts to understand right now. What I want to do in this article is explain the WHY behind banks and then directly connect it to how things are likely to unfold on a macro basis over the next 3-6 months.

Credit:
Ever since the tapper tantrum in 2018, it has become very popular to be a “Fed watcher” and say that they print unlimited amounts of money. In reality, when we look at the mechanics of the system (read Conks for this), the Fed changes bank reserves, liquidity, and interest rates. The Fed doesn’t push a button that magically sends money directly into the economy. There is actually a reason WHY the Fed’s liabilities are called “bank reserves” and NOT legal tender. This is what separates the Fed from the Reichsbank during the Weimar Republic. If the Fed was actually printing money, the United States would actually be collapsing as opposed to creating geopolitical stability in the world.
The key relationship to understand is HOW the Fed connects to commercial banks and how BOTH of these connect to growth, inflation, and liquidity. This visual illustrates how credit—created by commercial banks and enabled by central bank policy—interacts with growth, inflation, and liquidity, amplifying or dampening each depending on the macro environment.

As these moving parts interact, they create path-dependent states that are incredibly difficult to predict BUT are important to understand if you are managing the balance sheet of a bank or corporation.
This visual maps scenario analysis using a binomial tree framework, showing how Federal Reserve and commercial bank actions influence credit conditions—either expanding or contracting—and how these dynamics cascade into different growth and inflation outcomes, each with feedback loops that influence future policy and lending behavior.

When this conceptual logic is applied to financial markets, it contextualizes HOW assets are likely to move. This means that if we monitor growth, inflation, liquidity, and credit in a respective economy, we can begin to understand WHY asset prices are moving.
Banks:
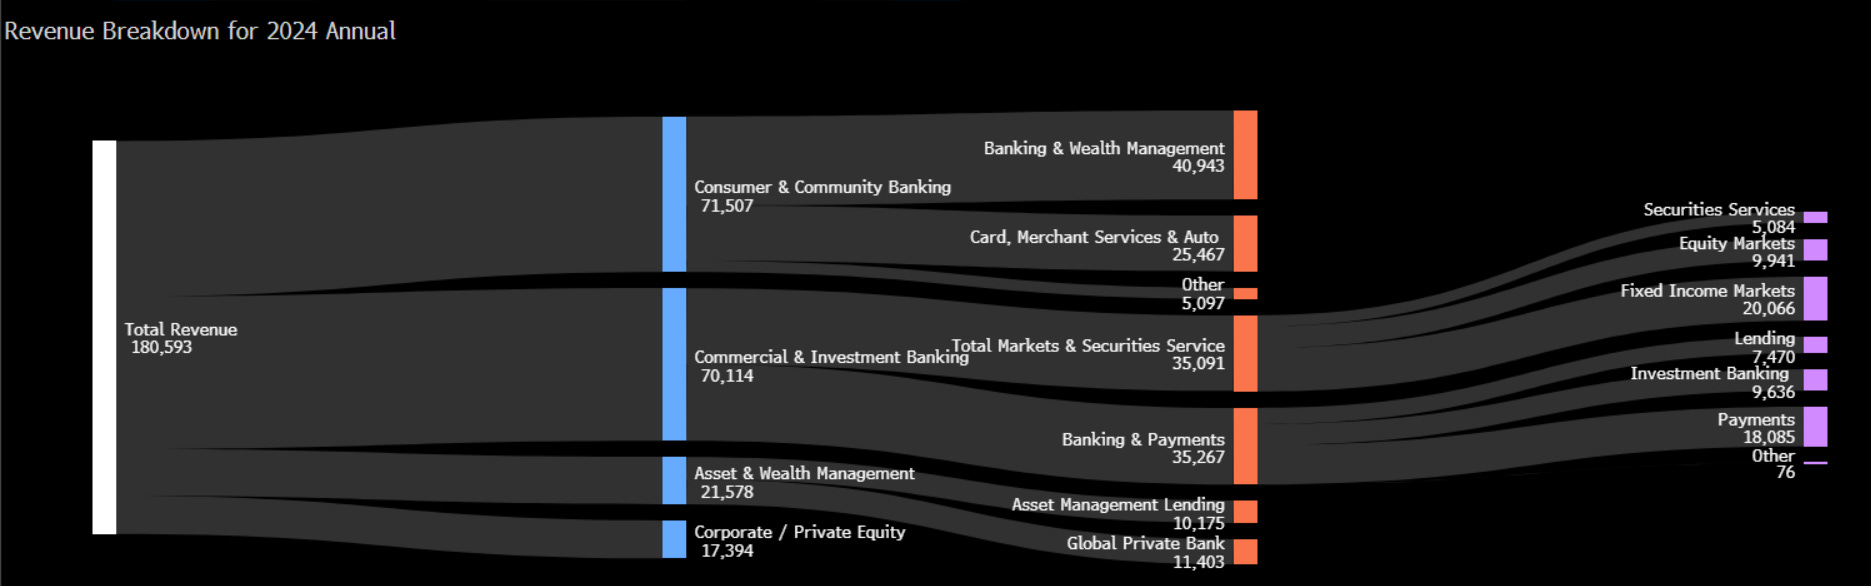
Banks and firms in financial services carry outsized importance and unique signals because the movement in their earnings and price is a direct reflection of credit conditions in the framework above. For example, here is a breakdown of JP Morgan’s revenue: We can see the various sources of revenue are directly tied to the FLOW of credit and liquidity.
The largest bank in Japan, Mitsubishi UFJ Financial Group, has a similar revenue breakdown.

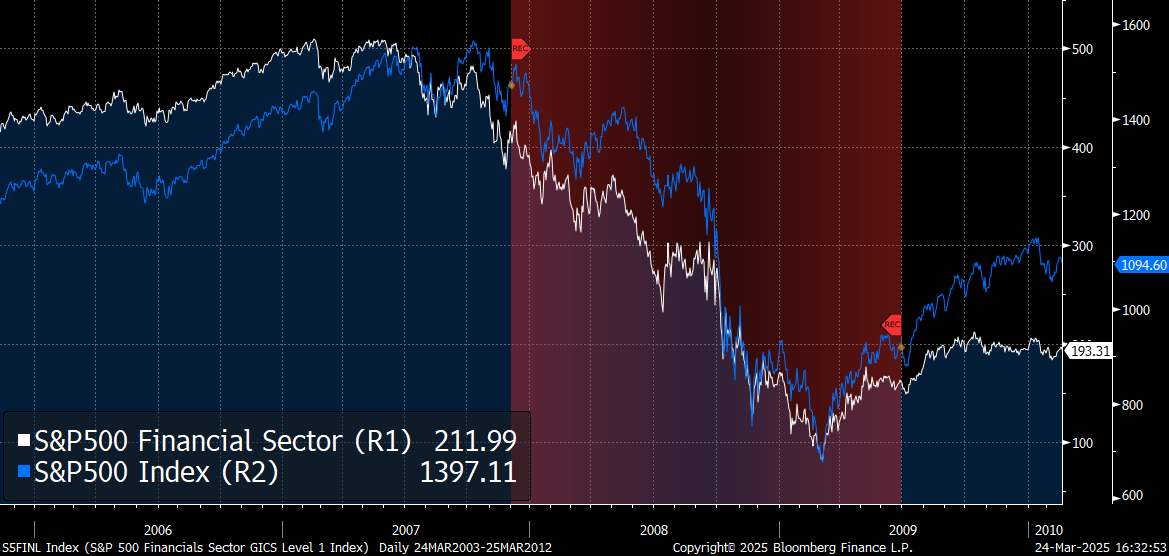
This matters because if banking and financial services are collapsing or rallying, it is ALWAYS directly connected to the underlying credit and liquidity regime. 2008 is the example that people think of most when the financial sector led the way to the downside for the index:
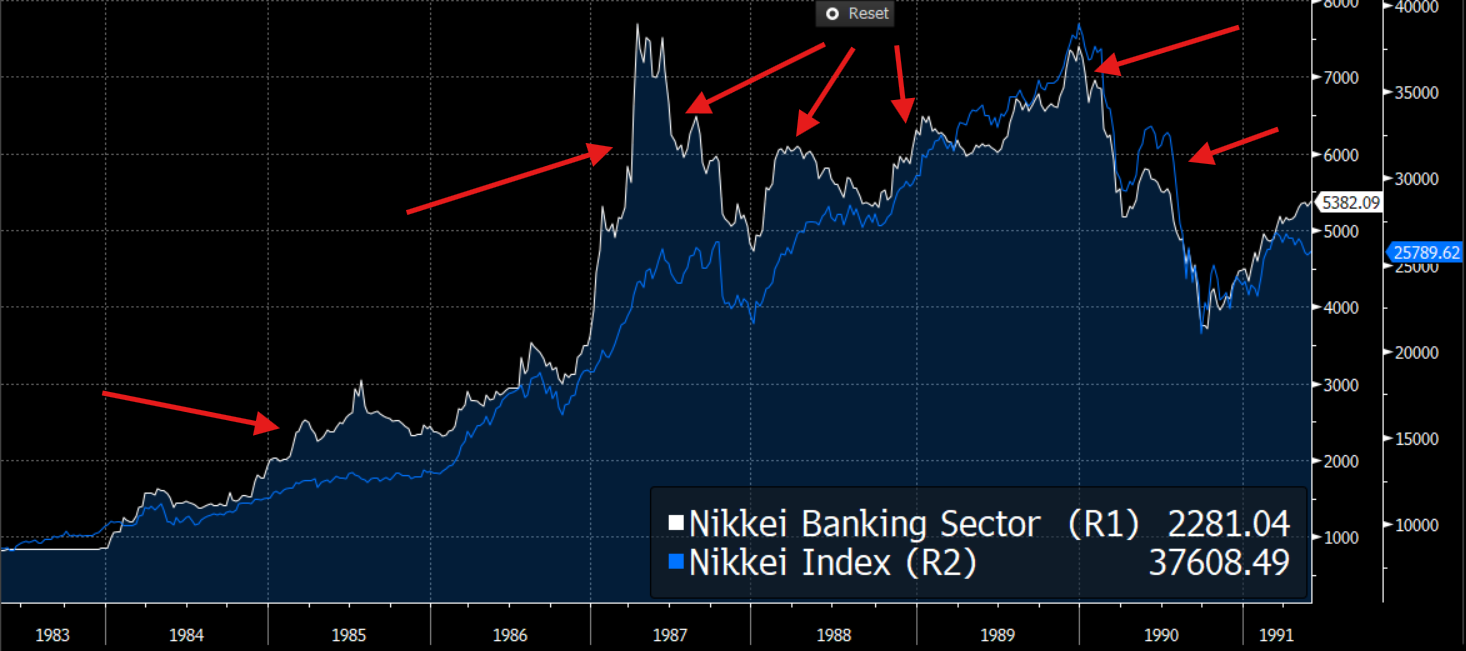
The same dynamic happened during the Nikkei in the 80s and 90s where the banking sector led on the upside and downside because it was so levered to the boom:
Now all of this brings us to where we are now which is a very interesting situation given the signals that the banking sector are sending.
The Current Macro Regime and Risks:
Keep reading with a 7-day free trial
Subscribe to Capital Flows to keep reading this post and get 7 days of free access to the full post archives.