An important point I continue to reiterate is that we are in a higher nominal growth environment and there is very unique tension in bonds. The days when you could just buy bonds and be long are over. Active management is critical for managing bond exposure in 2024. While many economists and media figures talk in extremes, alpha is generated by monitoring the tensions and adapting dynamically.
The next move by the Fed is going to determine if we hike in June or begin to shift to another leg up in interest rates. Monitoring the tensions and signals around this will be critical for determining if we are at a macro-inflection point. No one cares about macro until it begins to impact their portfolio. The goal of this report is to set a foundation of preparation in order to avoid significant drawdowns and actually benefit from future volatility.
As I always say, ADAPT OR DIE!
Interest Rate Strategy Report:
Report Structure:
Cyclical View
Nominal rate attribution
Inflation Analysis: Economic data/market pricing
Interest rates risk reward
Cyclical View:
On a cyclical basis, interest rates remain skewed to the downside. However, there remains a key tension on both how the short end is pricing the PATH of Fed Funds and that the yield curve remains inverted. It is important to remember that the rally to highs in the 10 year during 2023 was primarily from an increase in duration supply from the treasury while the Fed Funds curve remains relatively unchanged. The move down in rates from the October 2023 high was driven by BOTH supply normalizing and the forward curve pricing a more aggressive path for rate cuts.
As we have moved into the beginning of 2024, both the Fed’s forward guidance and the above expectation CPI prints caused a reversal on both the short end and long end. 2 year Fed Fund Swaps pricing the Fed Funds rate moved up marginally in February:
Since the yield curve remains inverted, this repricing of the short end transmitted through to the long end causing 10-year yields to rise marginally during February. However, we are unlikely to see 10 year yields move back above 4.50% since the yield curve is much closer to uninverting and inflation isn’t reaccelerating.
Nominal Rate Attribution:
The 10 year breakeven continues to remain in a range indicating long-term inflation expectations remain anchored. The primary attribution for the most recent move is real rates and short-term inflation expectations due to the higher-than-expected CPI print.
The 2 year breakeven (blue) has moved up from its low due to the CPI prints coming in above expectations.
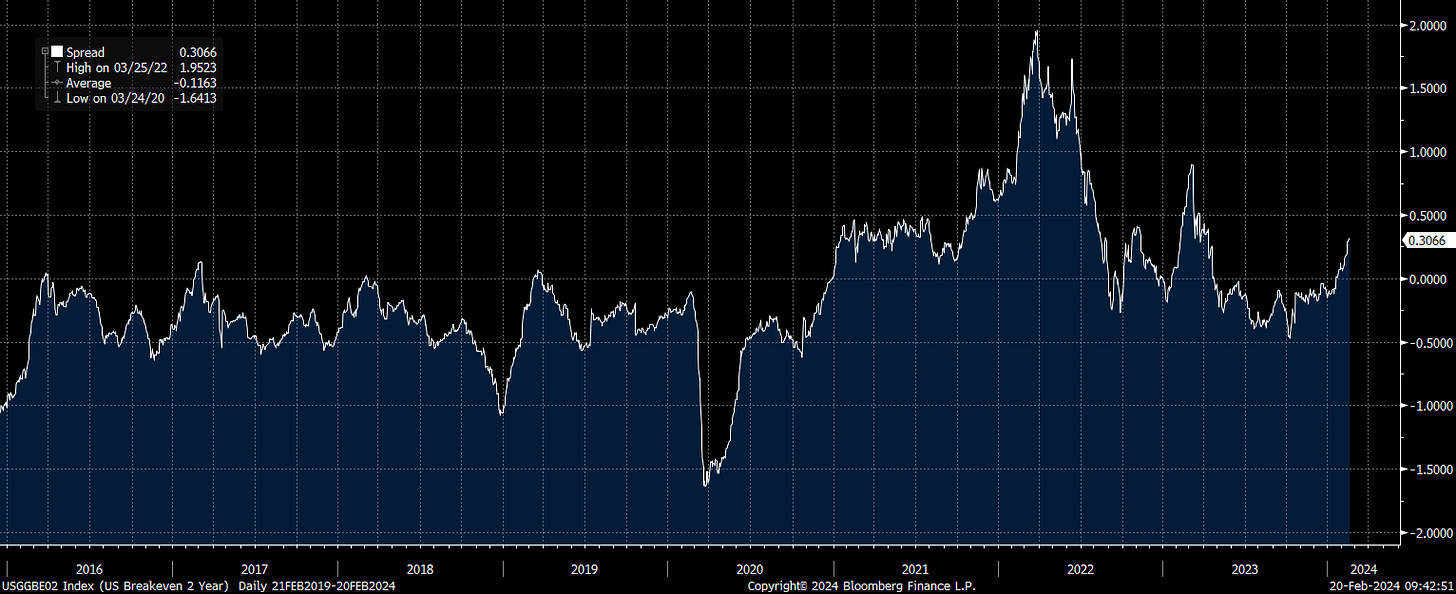
When we look at the spread between the 2 year breakeven and the 10 year breakeven, we can see the spread typically remains below zero. The most recent move above zero is reflective of the recent CPI prints coming in above expectations. However, we aren’t seeing longer term expectations make a persistent acceleration comparable to 2022. This shows there is discontinuity with the inflation acceleration of 2022 and there is a more precise short-term tension taking place.
Inflation Analysis: Economic data/market pricing
To correctly quantify the tensions of inflation and the discontinuity with 2022, we need to analyze the underlying inflation data and connect it to the market-implied pricing.
Inflation swaps are pricing 2% inflation by September of this year:
While inflation swaps have been pricing a downward path for inflation, we are only just now approaching a realistic situation where the inflation data could dip below 3%.
While there have been many conflicting opinions by market commentators on whether we have reached the 2% inflation target since PPI, PCE, headline CPI and Truflation have shown consecutive prints below 3%, the Fed is clearly focused on core CPI.
Additionally, YoY nominal growth remains elevated above the previous median of the last 30 years. There is clearly a change in the nominal activity environment that makes moving back to a 2% Fed funds rate highly unlikely. The monetary policy extremes of cutting rates to zero (2020) or hiking 550 bps (2022) are likely behind us and moderating between these two extremes is the likely path for the foreseeable future.
When analyzing the underlying drivers of inflation, there are several dynamics to note that directly connect to the market pricing of inflation expectations and the Fed’s forward guidance.
Energy prices (orange) continue to decelerate on a YoY basis but their negative contribution to overall inflation is likely to slow as energy prices remain range bound.
Food prices (blue) continue to decelerate on a YoY basis.
Core goods (purple) are negative YoY and help decrease inflationary pressures.
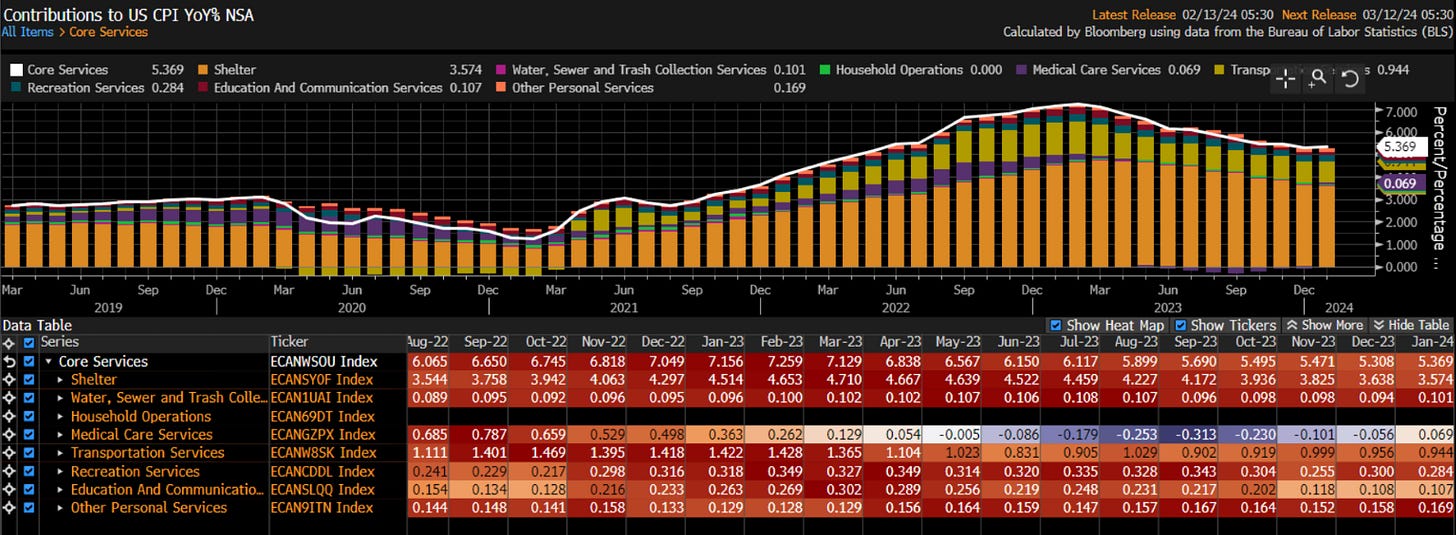
Core services is the primary category that has surprised expectations and is limiting the Fed from acknowledging that they have achieved their inflation target.
The core CPI attribution is showing a marginal reacceleration in medical services:
The primary tension with the CPI complex right now is that it is not slowing at the same pace as the previous 6 months. Notice the MoM changes in core CPI for the past two years. During 2022, MoM CPI was above 0.50% and then decelerated to prints below 0.40%. The most recent print was above 0.65% MoM:
The largest component of core is shelter which is decelerating on a YoY basis, but the speed of this deceleration is slowing:
MoM in shelter illustrates this marginal change in the speed more explicitly:
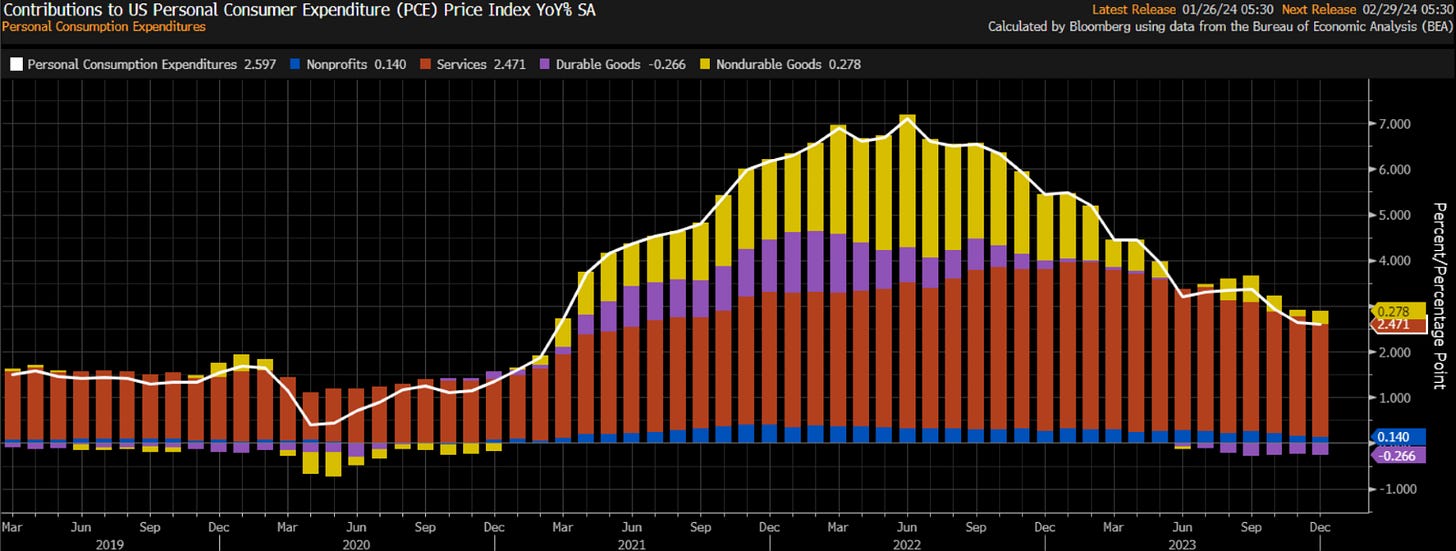
CPI clearly holds outsized significance in both the markets and Fed’s decision-making. While inflation metrics such as PCE and PPI are showing pronounced deceleration, CPI remains the primary focus to the Fed and market participants.
PCE shows continued deceleration:
As does PPI:
With a clear understanding of the specific inflation data points and how they are contributing to headline numbers, we can further analyze the probability of these specific factors accelerating or decelerating into the summer of 2024 and then compare this to how the market is pricing inflation.
Inflation Drivers:
The primary driver in service spending is wages which is directly connected to the amount of supply in labor vs demand.
Job openings (blue) remain elevated as the labor force participation rate (white) remains flat. When there is more demand (Jolts data in blue) vs the supply of labor (white), wages (YoY wages in green and Atlanta wage index in orange) express the supply and demand differential:
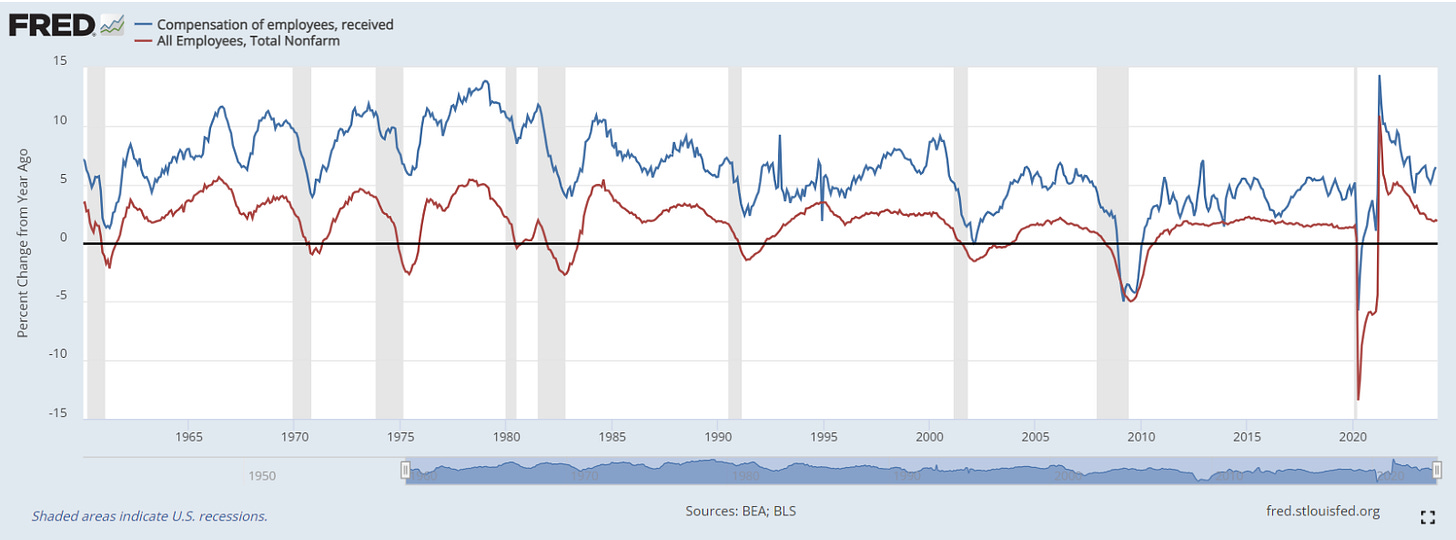
We continue to see wages moderate from their previous spike, but total compensation is squarely positive as nonfarm employees remain positive:
Inventory to sales ratios are rising from their previous low and remain elevated which is decreasing the supply side pressures:
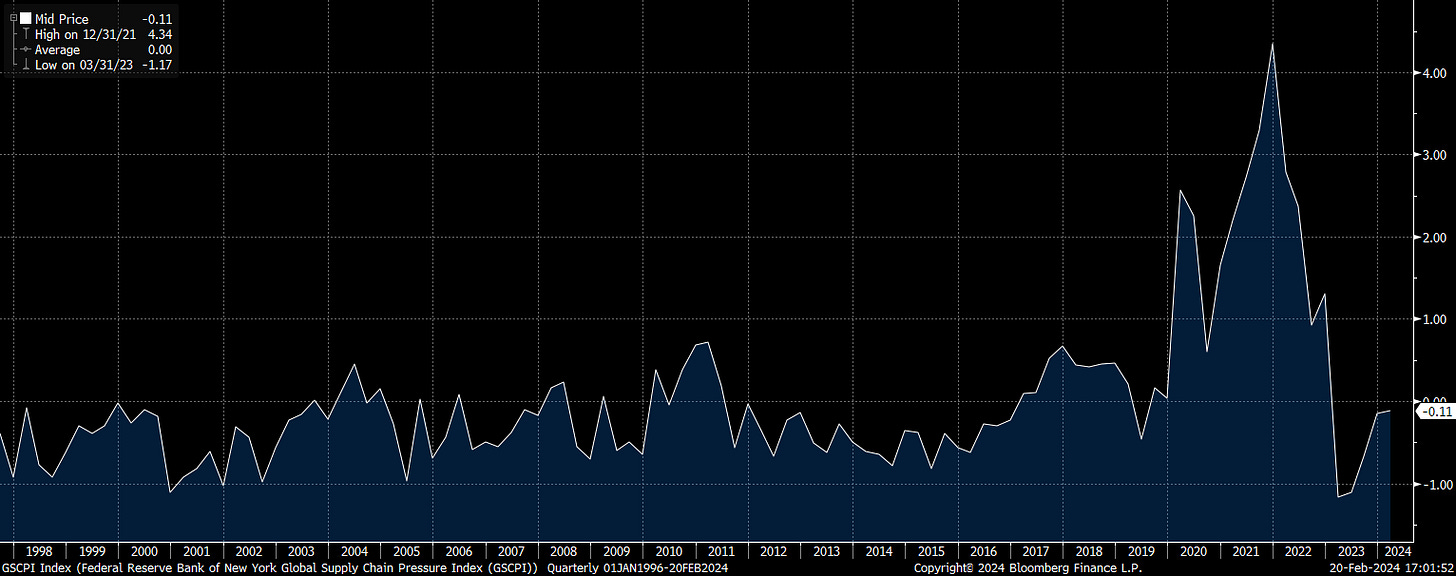
The supply chain pressures due to COVID have made their way through the system (chart of the supply chain pressure index). However, it is primarily the demand side of the equation causing resilience in growth. This resilience in growth creates a higher probability for inflation to remain flat or potentially reaccelerate.
There is still a reasonable spread between nominal (white) and real GDP (orange). Fed funds remain below nominal GDP:
While short end rates (3 month t bill in green) remain above real GDP nowcasts (white and blue), the absence of a recession is creating difficulty in actually “killing inflation.”
The preconditions of growth directly connect with the market pricing of inflation and the Fed’s current stance. The short end is well above inflation swaps across the curve (top panel) but growth metrics continue to show resilience: second panel is the GDP nowcast, third panel is the Bloomberg economic surprise index and bottom panel is Citi economic surprise index.
Bottom line, a resilience in growth creates a higher risk of inflation remaining flat YoY given the most recent CPI prints. It is this tension that is directly connected to HOW the Fed is conducting forward guidance and thereby adjusting rates on the short end.
Short End: Expected vs realized (R:R for trades)
Keep reading with a 7-day free trial
Subscribe to Capital Flows to keep reading this post and get 7 days of free access to the full post archives.


