

Brainstorms: What is unseen
Information, the seen, and unseen

One of the most important ideas in financial markets comes from a pivot paper by Claude Frédéric Bastiat called “That Which Is Seen, and That Which Is Not Seen.”
What people don’t realize is that the prices we see on the screen are only shadows on the wall of Plato’s cave. Everyone spends their days mapping charts, time series, and price action when in reality the price is only an imperfect reflection of the forces of supply and demand that function under temporal constraints.
All of the tools we use are imperfect instruments assisting us on the journey of grasping at the unknown. The problem is that people mistake the shadows on the wall for the actual reality taking place. This is what separates good risk-takers and great risk-takers.
Think about the difference between a person who knows every statistic about a specific baseball team and the actual players on that team making the statistics. One of them understands ABOUT the team but doesn’t know much about the skill required to produce those statistics.
Most people focus on what is SEEN instead of having foresight on what is unseen.
The key is in identifying what is seen, understanding it incredibly well, and then recognizing everything is about what is UNSEEN. Most people mistake understanding the seen without having foresight into the unseen.
Remember, the market always has an implied view of the UNSEEN. For example, the most tangible expression of this is the forward implied path of Fed Funds (from CME Tool: link):
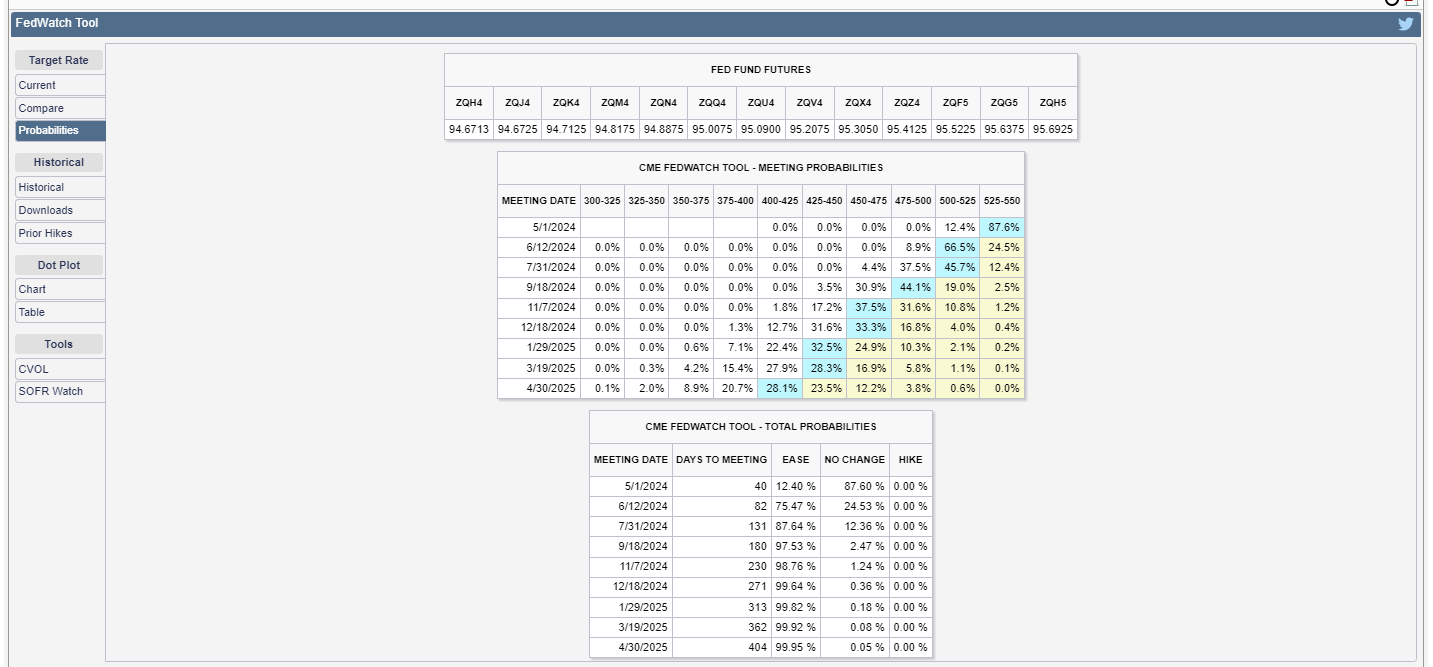
Derivatives with various expirations make explicit what is already implicit in the price. This is why using the tools on the CME site can be so valuable:
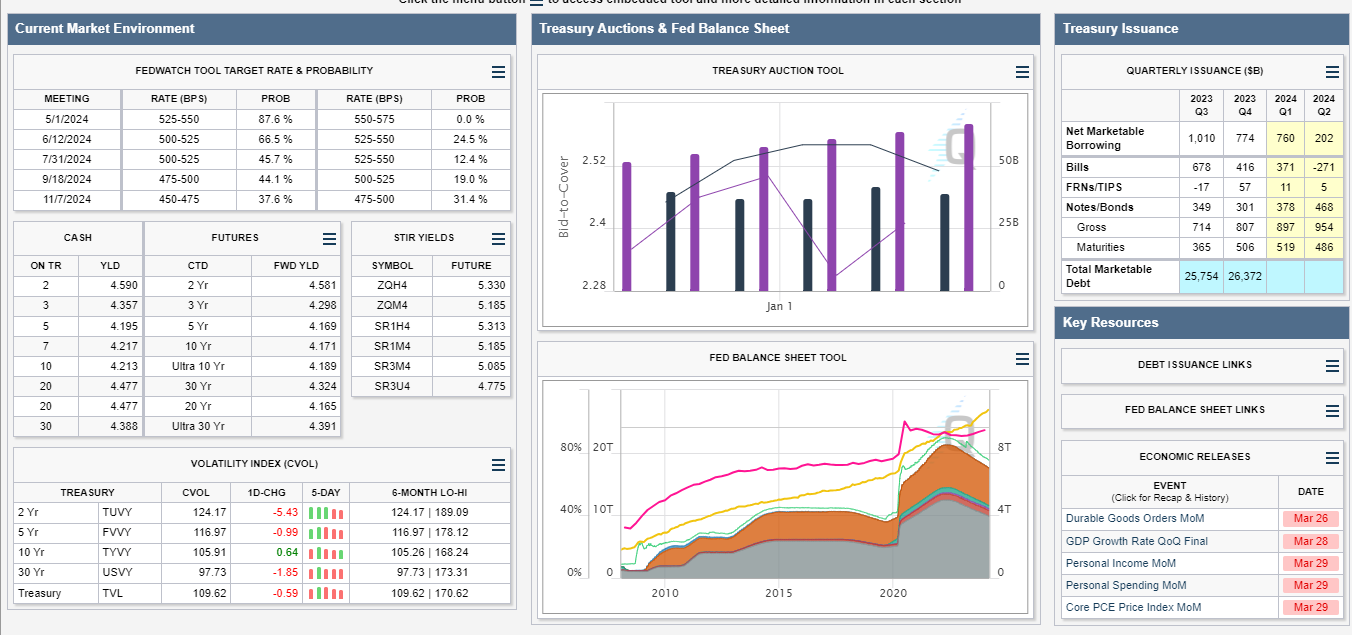
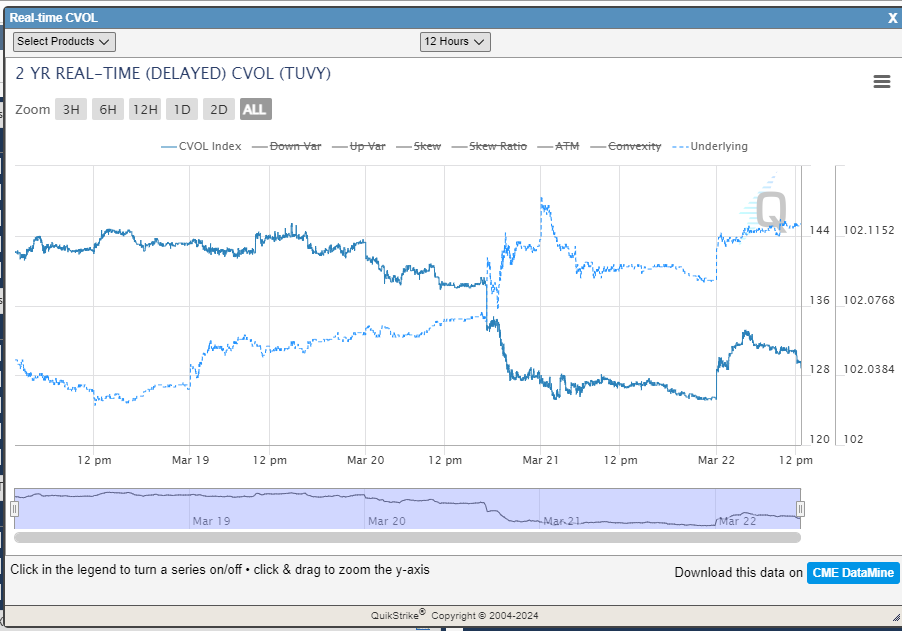
The CVOL tool is especially important for understanding the temporal detention of the UNSEEN because it shows how traders are pricing options (and thereby outcomes) across strikes and expirations on instruments. All of these data points allow you to quantify what is SEEN in order to have foresight on what is UNSEEN.
The 2-year and its implied vol remains a key asset of focus since FOMC. The reason I originally got long the 2-year before FOMC (link) was because we were perfectly pricing what was SEEN on the dot plot. The market wasn’t having foresight on what is UNSEEN.
As you move through catalysts, information moves across the spectrum of uncertainty to certainty and causes what is UNSEEN to finally be SEEN. This is a note from the trade update article (link)
Opportunity will always exist for those who can have foresight into what is UNSEEN and not mistake the shadows on the wall for reality.

Hi ! This shit is freaking gold. I just rabbit holed on everything and anything and tried to kind of get why you longed the 2yr.
Was this 2yr position dated and did you use ZQ to help execute this plan ? Like what made you execute this plan ? I know you have stated that it is because the 2year was hawkish as hell. But what gave you the edge, but what was the unseen advantage to take this trade other than the fact that the 2year was hawkish ? Was it that the fed funds futures was telling you that cuts were on their way, and that was the “unseen” that made you execute this trade ? Was it the dot plot was showing you a downtrend in rates ? Like what was it ? I know the question is kinda redundant but I want this to be as natural as can be. I’m very curious in this. I’m really trying to get my macro spot on.
Thank you !
what do you mean by saying "perfect pricing was seen on the dotplot"? How do you interpret and actually read this?