

Macro Regime Tracker: How to build a macro process
Macro regime and risk assets qualified clearly

Macro Regime Tracker:
The Macro Regime Tracker offers a daily lens on how shifts in growth, inflation, and liquidity affect short-term risk and reward. Leveraging machine learning, AI, and cross-asset data, it identifies macro changes and their impact on market positioning.
Macro Regime Tracker Index:
Macro Regime Context
Macro Tear Sheets: Equities, Fixed Income, FX, Crypto, and Commodities
Macro Regime Dashboard: Excel spreadsheet for economic data and interest rates
Growth, Inflation, Fixed Income, Credit, and Equities Regime Tracker
AI and Machine Learning Strategies - Macro Regime and Positioning Premiums Strategies: S&P 500, 2-Year Interest Rates, Gold, and Bitcoin
Macro Regime Context:
Today, I want to cover an educational point on how to build a signal generation process and show how this is tangibly implemented in the strategies sent out every day.
When we approach financial markets to extract returns, it always starts with understanding WHAT is happening and WHY it’s happening. Macro is about looking at the top down drivers that account for the majority of moves in financial assets. The most important point about this process is testing your views of the world to see if they have predictability.
The Capital Flows team is focused on consistently developing views of the world that have testability and predictability. In order to accomplish this, we break down all of the drivers for a view/asset and test them. The important qualification you need for this is a temporal component, which means a specific time horizon. When you align your macro view and the underlying drivers with a specific time horizon, you are able to actually monetize returns.
For example, the ES model breaks down all of the underlying drivers AND systematically quantifies WHERE the price is likely to be on a 5 day time horizon. In other words, based on the current dynamics we are seeing, what is the skew for the price from its current state to its future state in 5 days? Is it likely to be higher or lower?

This element of testability and prediction on a specific time horizon is CRITICAL for success. Why? Because regular indicators (which can still be immensely helpful!) are primarily descriptive. For example, Bollinger Bands on ES can be incredibly helpful to visualize extreme son the price, but that doesn’t necessarily imply buying at the bottom end of the range and selling at the top is what makes money over time.

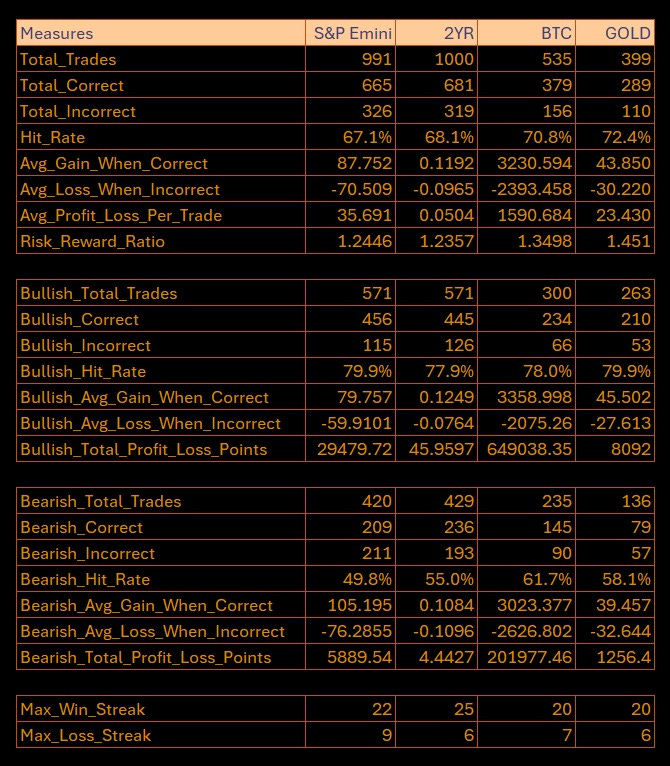
What we want to do is begin venturing into testable theses that have positive EV. This simply means taking ideas and testing them so that the hit ratio and R:R are high enough where, on net the prediction is going to add value. This is only the first step of the building block, though. Below is a basic breakdown of the signals we are running on ES, the 2 year, BTC, and Gold. All of these are forward-tested results, which means they are not just artificially manipulated in a backtest to make performance seem better than it is.
Now here is the deal, there are a ton of full systematic strategies operating in markets with massive amounts of capital. My goal is not to compete against those firms. The greater opportunity lies in merging systematic insights with discretionary decision-making. Everyone in the industry knows the shift toward the hybrid approach of Quant/Discretionary. However, constraints remain in the industry due to the time horizon PMs have to operate on and the drawdown controls they need to adhere to. This doesn’t mean taking large drawdowns is positive, but the industry has morphed into an environment where everyone has A TON of constraints.
This is why we are working on building models, strategies, and research within a specific niche because it has the greatest opportunity for asymmetrical returns. All of the massive returns in markets ALWAYS occur in the tails, and it is incredibly difficult for systematic strategies to consistently extract these returns.
We will continue moving in this direction where there is a suite of systematic models, strategies, and tools as well as specific investment thesisis built around inflection points in markets. Tomorrow, I will be publishing the next trade write up explaining WHERE we are likely to be moving given the developments over the last week.
Main Developments In Macro
*CHINA TO INCREASE TARIFFS ON US GOODS TO 125%
*LAGARDE: ECB IS READY TO USE INSTRUMENTS IT HAS IF NEEDED
*KASHKARI: NO EVIDENCE LONG-TERM INF. EXPECTATIONS ARE CLIMBING
*KASHKARI: MUST ENSURE LONG-TERM INF. EXPECTATIONS DON'T RISE
*KASHKARI INDICATES HE'D PREFER TO FOCUS ON INFL. GOAL FIRST
*KASHKARI: TARIFFS SUGGEST INFLATION WILL BE GOING BACK UP AGAIN
*KASHKARI: A LOT OF GOOD NEWS UNDER THE HOOD OF LATEST CPI
*KASHKARI: SEEING SOME STRESSES BUT MARKET SEEMS TO BE ADJUSTING
*KASHKARI: QUITE AWAYS AWAY FROM PANDEMIC-ERA PLUMBING ISSUES
*KASHKARI: DOLLAR WEAKENING SUGGESTS INVESTOR PREFERENCE SHIFTS
*FED'S WILLIAMS: THINK WE'VE GOT BROAD CONTOURS OF TARIFFS NOW
*LEAVITT: TRUMP REMAINS OPEN, OPTIMISTIC ABOUT DEAL WITH CHINA
*FED READY TO HELP STABILIZE MARKET, FED'S COLLINS SAYS: FT
Macro Tear Sheets: Equities, Fixed Income, FX, Crypto, and Commodities
Macro Regime Dashboard: Excel spreadsheet for economic data and interest rates
Growth, Inflation, Fixed Income, Credit, and Equities Regime Tracker
The Macro Regime Model offers a real-time view of growth, inflation, and yield curve dynamics, integrating these with credit market shifts, equity risk premiums, and positioning data. It connects upcoming catalysts to statistical drivers of asset prices, creating a unified framework that quantifies skew and clarifies risk-reward across asset classes.
Key Points:
S&P 500 Weekly Wrap – Relief Rally Masks Fragile Foundation
The S&P 500 surged +1.95% in a volatile week capped by a broad-based relief rally, its best performance since November 2023. Markets cheered a signal from the Federal Reserve that it stands ready to intervene if conditions deteriorate, following a chaotic stretch marked by spiraling tariffs, whipsawing sentiment, and severe liquidity strains.
Yet beneath the surface, the move looked more like a positioning reset than a conviction-led reversal. Volatility remained elevated, Treasury yields climbed, and investor confidence in US assets continued to erode amid fears that Trump’s aggressive trade policy is inflicting lasting structural damage.
Sector Contribution Breakdown
Information Technology (+0.82%) – The clear driver of the rally, with mega-cap tech snapping back sharply. Short covering and passive flows dominated as investors rotated back into liquid, benchmark-heavy names. Still, fundamentals remain clouded by global demand uncertainty.
Financials (+0.26%) – Banks bounced as bond volatility subsided late in the week. Despite long-end yield spikes, the sector's strength was more a function of mean reversion than a true shift in macro outlook.
Industrials (+0.17%) – A modest contributor, helped by the tariff pause, though skepticism remains high. Global trade exposure and margin risks continue to weigh on forward guidance.
Health Care & Consumer Discretionary (each +0.15%) – Mixed moves within both sectors suggest investors are testing risk appetite in selective areas. Discretionary gains remain vulnerable to inflationary headwinds; Health Care showed defensive resilience but not leadership.
Communication Services (+0.11%) – Rebounded after Thursday’s sharp drawdown. Sentiment remains fragile given the sector’s sensitivity to both ad spending and tech-adjacent volatility.
Consumer Staples (+0.08%) / Energy (+0.07%) / Materials (+0.05%) / Real Estate (+0.04%) / Utilities (+0.03%) – Marginal positive contributions reflected low-beta rotation and tactical positioning. Energy and Materials remain tied to macro sentiment, while rate-sensitive sectors like Utilities and Real Estate benefited modestly from easing yield pressures.
Analysis
This week’s gains were driven by short-term relief and headline whiplash — not improved fundamentals. The “Fed put” narrative re-emerged, calming markets temporarily, but the underlying fragility remains.
Key takeaways:
Volatility remains the dominant feature — the S&P 500 traded in a 10% intraweek range, the widest since the depths of the pandemic.
Investor confidence in US assets is fraying — capital is rotating toward Europe, gold, and the yen as America's safe-haven status is questioned.
Systematic flows are driving intraday extremes — Wednesday’s historic rally and Friday’s bid both reflect risk parity and momentum strategies flipping.
Tariff relief is partial, not permanent — the 90-day pause offers breathing room, but the damage to global trade, emerging market exporters, and supply chains is already being felt.
Forward-looking signals remain weak — Earnings guidance is sparse, economic data softening, and long-end yields imply higher borrowing costs ahead.
This rally is not a trend, it’s a tactical response to oversold conditions and policy whiplash. The structural risks introduced by Trump’s trade policy, coupled with a hesitant Fed and jittery global capital, suggest that volatility will persist.

Unweighted Sector Moves
Information Technology (+2.74%) – Tech led the charge with strength across both mega-caps and the broader cohort. Semiconductors and software rebounded sharply, suggesting short covering and passive reallocation into beaten-down names.
Materials (+2.71%) – A standout performer amid hopes that the tariff pause may ease input cost pressures and supply chain friction. Still, structural demand uncertainty persists, keeping investors cautious.
Energy (+2.12%) – A sharp reversal higher, driven by short-term positioning and a bounce in crude. However, the sector remains highly reactive to global demand expectations and vulnerable to renewed volatility.
Industrials (+2.05%) – Cyclical names bounced strongly, benefiting from the pause in trade escalation. But with fundamentals still clouded, the move appears tactical, not conviction-driven.
Financials (+1.83%) – Banks participated in the rally as yields stabilized, but macro concerns and credit worries remain front of mind. The move appears to reflect market mechanics more than improving outlooks.
Real Estate (+1.85%) – Rate-sensitive names gained as long-end yield pressures eased late in the week. Still, rising funding costs and macro stress suggest durability is questionable.
Health Care (+1.41%) / Consumer Discretionary (+1.40%) – Both sectors participated modestly. Health Care benefited from defensive rotation, while Discretionary rose on hopes that a less aggressive tariff policy could stabilize consumer sentiment.
Consumer Staples (+1.27%) / Utilities (+1.23%) / Communication Services (+1.22%) – Traditionally defensive sectors saw moderate gains. This reflects improved tone across the market, though none emerged as safe-haven leaders, suggesting ongoing uncertainty.
Analysis
This week’s unweighted sector performance showed remarkably strong breadth, with all 11 sectors posting gains, a rare alignment after weeks of narrow leadership. The relief bounce was real, but it sits on a precarious base:
Macro conditions remain turbulent: The Fed’s implied backstop and Trump’s tariff pause offered temporary relief, but neither represents a durable policy shift.
Investor psychology is fragile: The violence of the rally echoes short-covering and forced flows rather than renewed optimism. Market participants remain highly reactive to headlines, not proactive in risk-taking.
Liquidity is thin and volatility remains high: Even small shifts in positioning or sentiment are causing outsized moves across asset classes.
Breadth is improving, but it may prove fleeting. Sustained recovery requires a firmer macro anchor — not just relief from fear, but genuine improvement in trade dynamics, economic visibility, and policy coherence.
While the unweighted performance suggests a broader market lift, it’s not a reliable foundation yet. This was a reactionary rally, not the start of a durable uptrend.

Sector Breadth – Participation Is Improving, But Momentum Is Not Yet Restored
Friday’s data reflects a bounce, not a breakout. The improvement in breadth is encouraging but still sits within a larger structure of deteriorating momentum and persistent volatility.
Until we see the 20- and 50-day breadth metrics sustain upward trajectories, this rally should be treated as tactical, not structural. The market remains highly reactive to headlines, and participation, while broader today…. remains vulnerable to reversal.
In other words: yes, breadth improved, but the foundation is still cracked.

Credit Snapshot – High-Yield Spread Breakout Signals Systemic De-Risking
High-yield credit spreads have surged to 72.98 bps, breaking decisively above the long-term average of 62.90 bps and marking their highest level since the regional banking volatility in early 2023. This is no longer just a sympathy move with equities, credit is now leading the market stress narrative.
The sharp re-pricing of credit risk aligns with broader signals of strain: spiking equity volatility, fragility in sector breadth, and ongoing deterioration in macro sentiment tied to Trump’s aggressive trade policies. The move is particularly notable because it pierces through a multi-year zone of relative stability and pushes into levels historically associated with pre-crisis dislocations.
Credit has moved from lagging indicator to stress signal. The breakout in spreads is a red flag that financial conditions are tightening rapidly and risk tolerance is fading, even among traditionally yield-hungry investors.
Until we see a stabilization in spreads and a resumption of orderly issuance, expect ongoing pressure on equities, wider funding spreads, and increased potential for policy intervention.

Short-End Rates – Three Cuts Priced for 2025 as Disinflation Gives Fed Cover
Rate futures now price in 78 bps of easing by year-end 2025, with a further 21 bps priced through mid-2026, signaling that markets remain confident in a gradual but deliberate Fed cutting cycle — even as the broader macro backdrop remains fraught.
This recalibration reflects a balance between softer inflation data, tightening financial conditions, and the recognition that policy flexibility remains critical in navigating a volatile geopolitical and economic landscape.
Key Pricing Shifts
Three cuts priced by Dec 2025: The front-end reflects a base case of easing beginning mid-year, with cuts in June, July, and September appearing most likely.
Implied policy rate moves to 3.34% by Sep 2026, down from 4.33% on Friday— a cumulative ~99 bps of easing, but now concentrated in the next 12 months.
Short-end volatility has moderated, but the message is clear: the Fed will likely act if tightening credit, weaker consumer sentiment, and tariff-induced uncertainty persist.
Macro Viewpoint
Disinflation trend confirmed: The recent CPI print showed broad-based cooling in both headline and core inflation. This gives the Fed room to pivot without reigniting price pressures.
Fed optionality is now a feature, not a bug: Traders no longer expect “panic” cuts, but rather data-dependent, proactive easing to prevent overtightening through financial conditions.
2026 pricing reflects uncertainty, not conviction: The shallow path beyond year-end 2025 suggests that markets see the Fed as responsive in the near term, but hesitant to commit to an extended cutting cycle unless economic deterioration deepens.
Tariffs complicate the picture: While easing is being priced, uncertainty around trade, foreign capital flows, and dollar strength could slow or shape the Fed’s approach.
Three cuts by December now represent the market’s base case, a scenario consistent with softening data and rising financial stress, but not a full-blown crisis. 2026 is priced more cautiously, reflecting a wait-and-see approach beyond the initial normalization.
The Fed’s messaging in the coming weeks will be critical: If the data holds and volatility persists, June/July cuts will likely move from expectation to consensus.

Tactical Portfolio
One new position in Sofr Futures, expressing the asymmetry in the the expectation of near term fed activity, over the coming 2/3 meetings >25bps being realised.


Macro Regime and Positioning Premiums - Strategies:
As of market close, the strategies have updated, and here are the new directional skews.

Equities (ES)
==================================================
Technical Levels for ES1 Index
==================================================
Daily Range: 172.21
Resistance Levels (Above Close):
------------------------------
R5: 5692.52 | Offset: +301.27
R4: 5683.25 | Offset: +292.00
R3: 5550.75 | Offset: +159.50 *
R2: 5499.29 | Offset: +108.04 *
R1: 5471.00 | Offset: + 79.75 *
------------------------------
Close Price: 5391.25
------------------------------
Support Levels (Below Close):
------------------------------
S1: 5388.48 | Offset: - 2.77 *
S2: 5387.90 | Offset: - 3.35 *
S3: 5336.72 | Offset: - 54.53 *
S4: 5258.75 | Offset: -132.50 *
S5: 5126.25 | Offset: -265.00
==================================================
* Denotes intraday level, likely tested
(In the top panel, the total impulse of macro drivers and positioning is illustrated in its strength. The greater the strength in the move, the higher the probability and amplitude of the move that is likely to take place. The bottom panel illustrates if the skew is either bullish or bearish probability.)

(The next three charts show the underlying contribution for the Total Macro and Positioning Drivers in the chart above. These allow you to see the WHY behind moves.)
(The Equity Risk Premium contribution aggregates major macro factors and the strength of factors driving equity risk premiums. In the same manner, the higher the contribution moves, the more strength the drivers have in pushing the index in a specific direction.)

(The Positioning Premium Driver contribution identifies HOW the drivers of positioning are contributing to equity returns. In the same manner, the higher the contribution moves, the more strength the drivers have in pushing the index in a specific direction.)

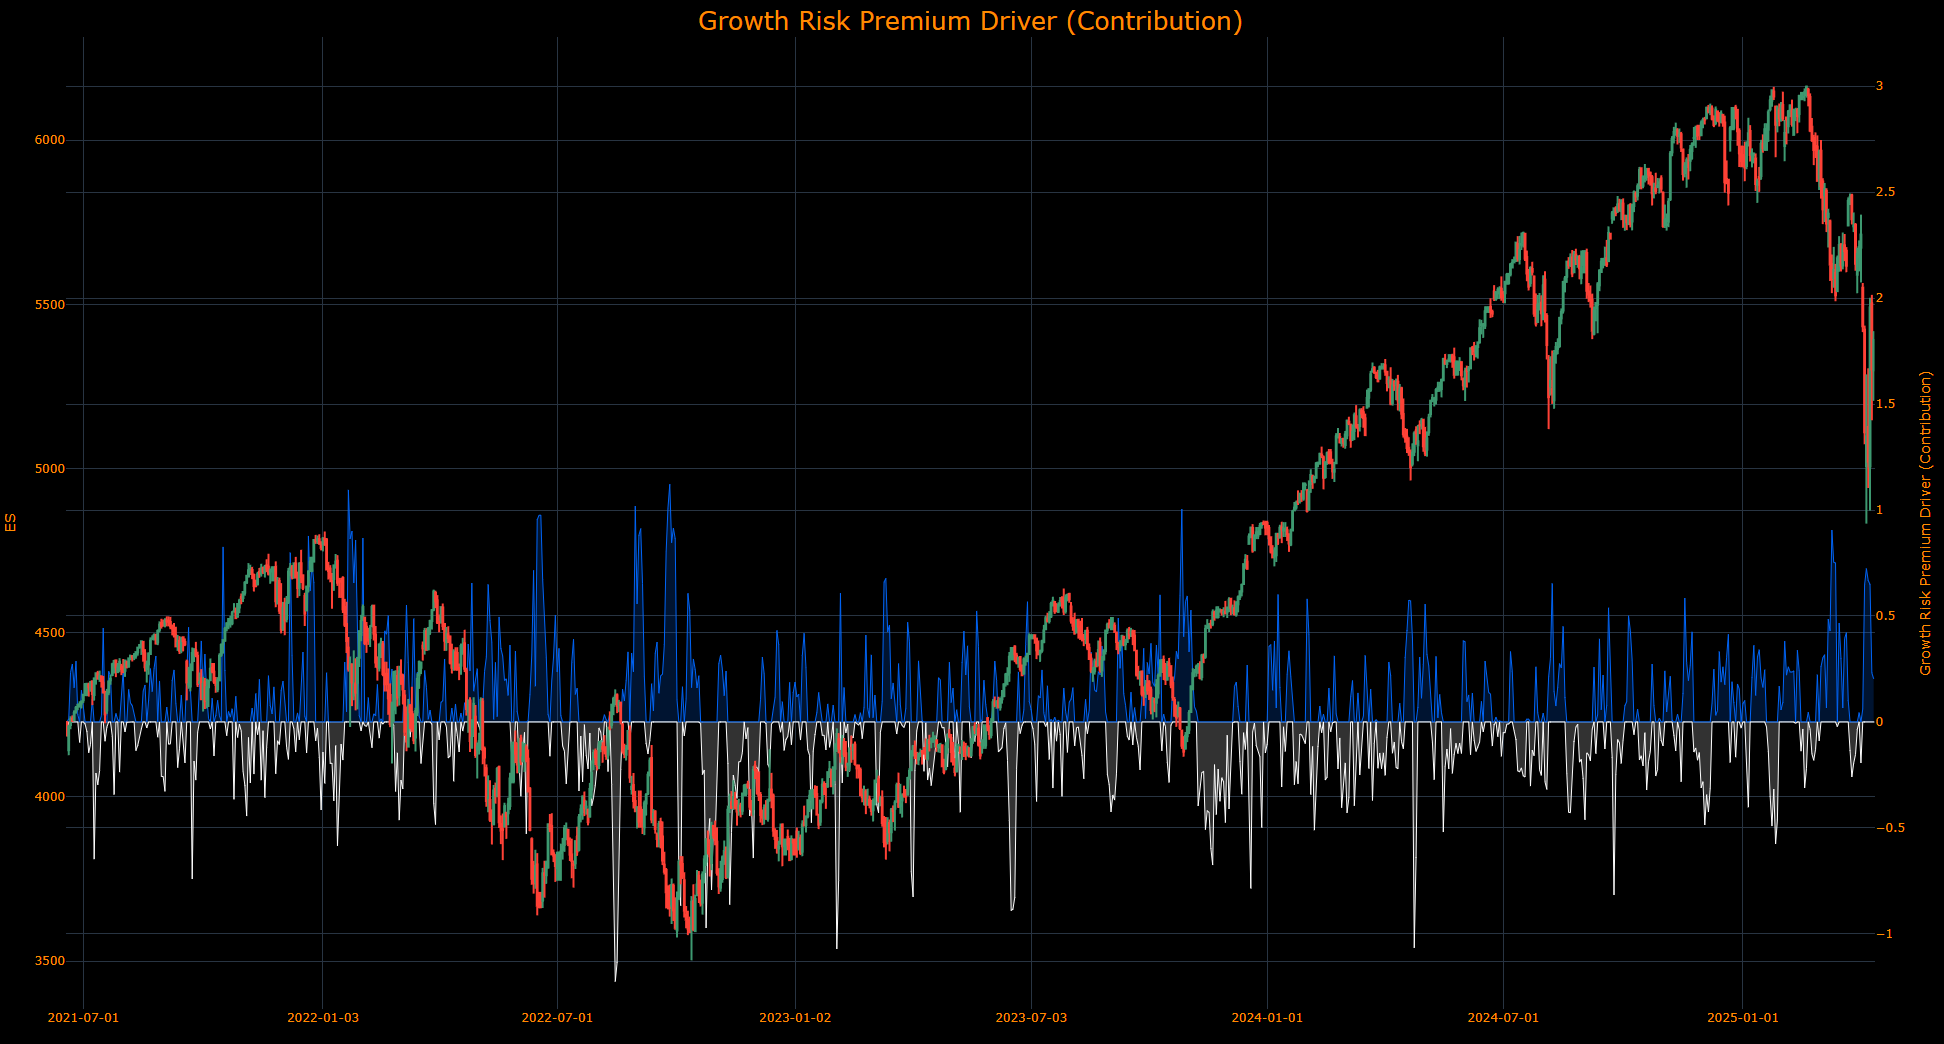
(The Growth Risk Premium Driver contribution identifies HOW the drivers of growth are contributing to equity returns. In the same manner, the higher the contribution moves, the more strength the drivers have in pushing the index in a specific direction.)
2-Year Interest Rate
==================================================
Technical Levels for USGG2YR Index
==================================================
Daily Range: 0.12
Resistance Levels (Above Close):
------------------------------
R5: 4.20 | Offset: + 0.24
R4: 4.16 | Offset: + 0.20
R3: 4.13 | Offset: + 0.17
R2: 4.08 | Offset: + 0.12
R1: 4.02 | Offset: + 0.06 *
------------------------------
Close Price: 3.96
------------------------------
Support Levels (Below Close):
------------------------------
S1: 3.89 | Offset: - 0.07 *
S2: 3.87 | Offset: - 0.09 *
S3: 3.86 | Offset: - 0.10 *
S4: 3.85 | Offset: - 0.11 *
S5: 3.82 | Offset: - 0.14
==================================================
* Denotes intraday level, likely tested
(In the top panel, the total impulse of macro drivers and positioning is illustrated in its strength. The greater the strength in the move, the higher the probability and amplitude of the move that is likely to take place. The bottom panel illustrates if the skew is either bullish or bearish probability.)

(The Inflation Risk Premium Driver contribution identifies HOW the drivers of inflation expectations are contributing to 2-year returns. In the same manner, the higher the contribution moves, the more strength the drivers have in pushing rates in a specific direction.)

(The Commodity Premium Driver contribution identifies HOW the drivers of commodities are contributing to 2-year returns. In the same manner, the higher the contribution moves, the more strength the drivers have in pushing rates in a specific direction.)

(The Growth Risk Premium Driver contribution identifies HOW the drivers of growth are contributing to 2-year returns. In the same manner, the higher the contribution moves, the more strength the drivers have in pushing rates in a specific direction.)

Gold
==================================================
Technical Levels for GC1 Comdty
==================================================
Daily Range: 34.31
Resistance Levels (Above Close):
------------------------------
R5: 3343.45 | Offset: +121.25
R4: 3301.15 | Offset: + 78.95
R3: 3297.00 | Offset: + 74.80
R2: 3266.00 | Offset: + 43.80
R1: 3244.10 | Offset: + 21.90 *
------------------------------
Close Price: 3222.20
------------------------------
Support Levels (Below Close):
------------------------------
S1: 3191.20 | Offset: - 31.00 *
S2: 3160.20 | Offset: - 62.00
S3: 3143.25 | Offset: - 78.95
S4: 3138.30 | Offset: - 83.90
S5: 3120.21 | Offset: -101.99
==================================================
* Denotes intraday level, likely tested
In the top panel, the total impulse of macro drivers and positioning is illustrated in its strength. The greater the strength in the move, the higher the probability and amplitude of the move that is likely to take place. The bottom panel illustrates if the skew is either bullish or bearish probability.

(The US Macro Liquidity Driver contribution identifies HOW the drivers of US liquidity are contributing to the returns of Gold. In the same manner, the higher the contribution moves, the more strength the drivers have in pushing gold in a specific direction.)

(The Gold Risk Premium Driver contribution identifies HOW the risk premium of gold is contributing to returns. In the same manner, the higher the contribution moves, the more strength the drivers have in pushing gold in a specific direction.)

(The Dollar Liquidity Driver contribution identifies HOW the drivers of dollar liquidity are contributing to the returns of Gold. In the same manner, the higher the contribution moves, the more strength the drivers have in pushing gold in a specific direction.)

The Global Liquidity Driver contribution identifies HOW the drivers of global liquidity are contributing to the returns of Gold. In the same manner, the higher the contribution moves, the more strength the drivers have in pushing gold in a specific direction.

Bitcoin
==================================================
Technical Levels for XBTUSD Curncy
==================================================
Daily Range: 2120.43
Resistance Levels (Above Close):
------------------------------
R5: 89098.43 | Offset: +5627.06
R4: 88133.11 | Offset: +4661.74
R3: 85721.16 | Offset: +2249.79
R2: 84988.80 | Offset: +1517.43 *
R1: 84230.09 | Offset: +758.72 *
------------------------------
Close Price: 83471.37
------------------------------
Support Levels (Below Close):
------------------------------
S1: 82811.93 | Offset: -659.44 *
S2: 82739.02 | Offset: -732.35 *
S3: 82238.30 | Offset: -1233.07 *
S4: 82101.61 | Offset: -1369.76 *
S5: 82006.66 | Offset: -1464.71
==================================================
* Denotes intraday level, likely tested
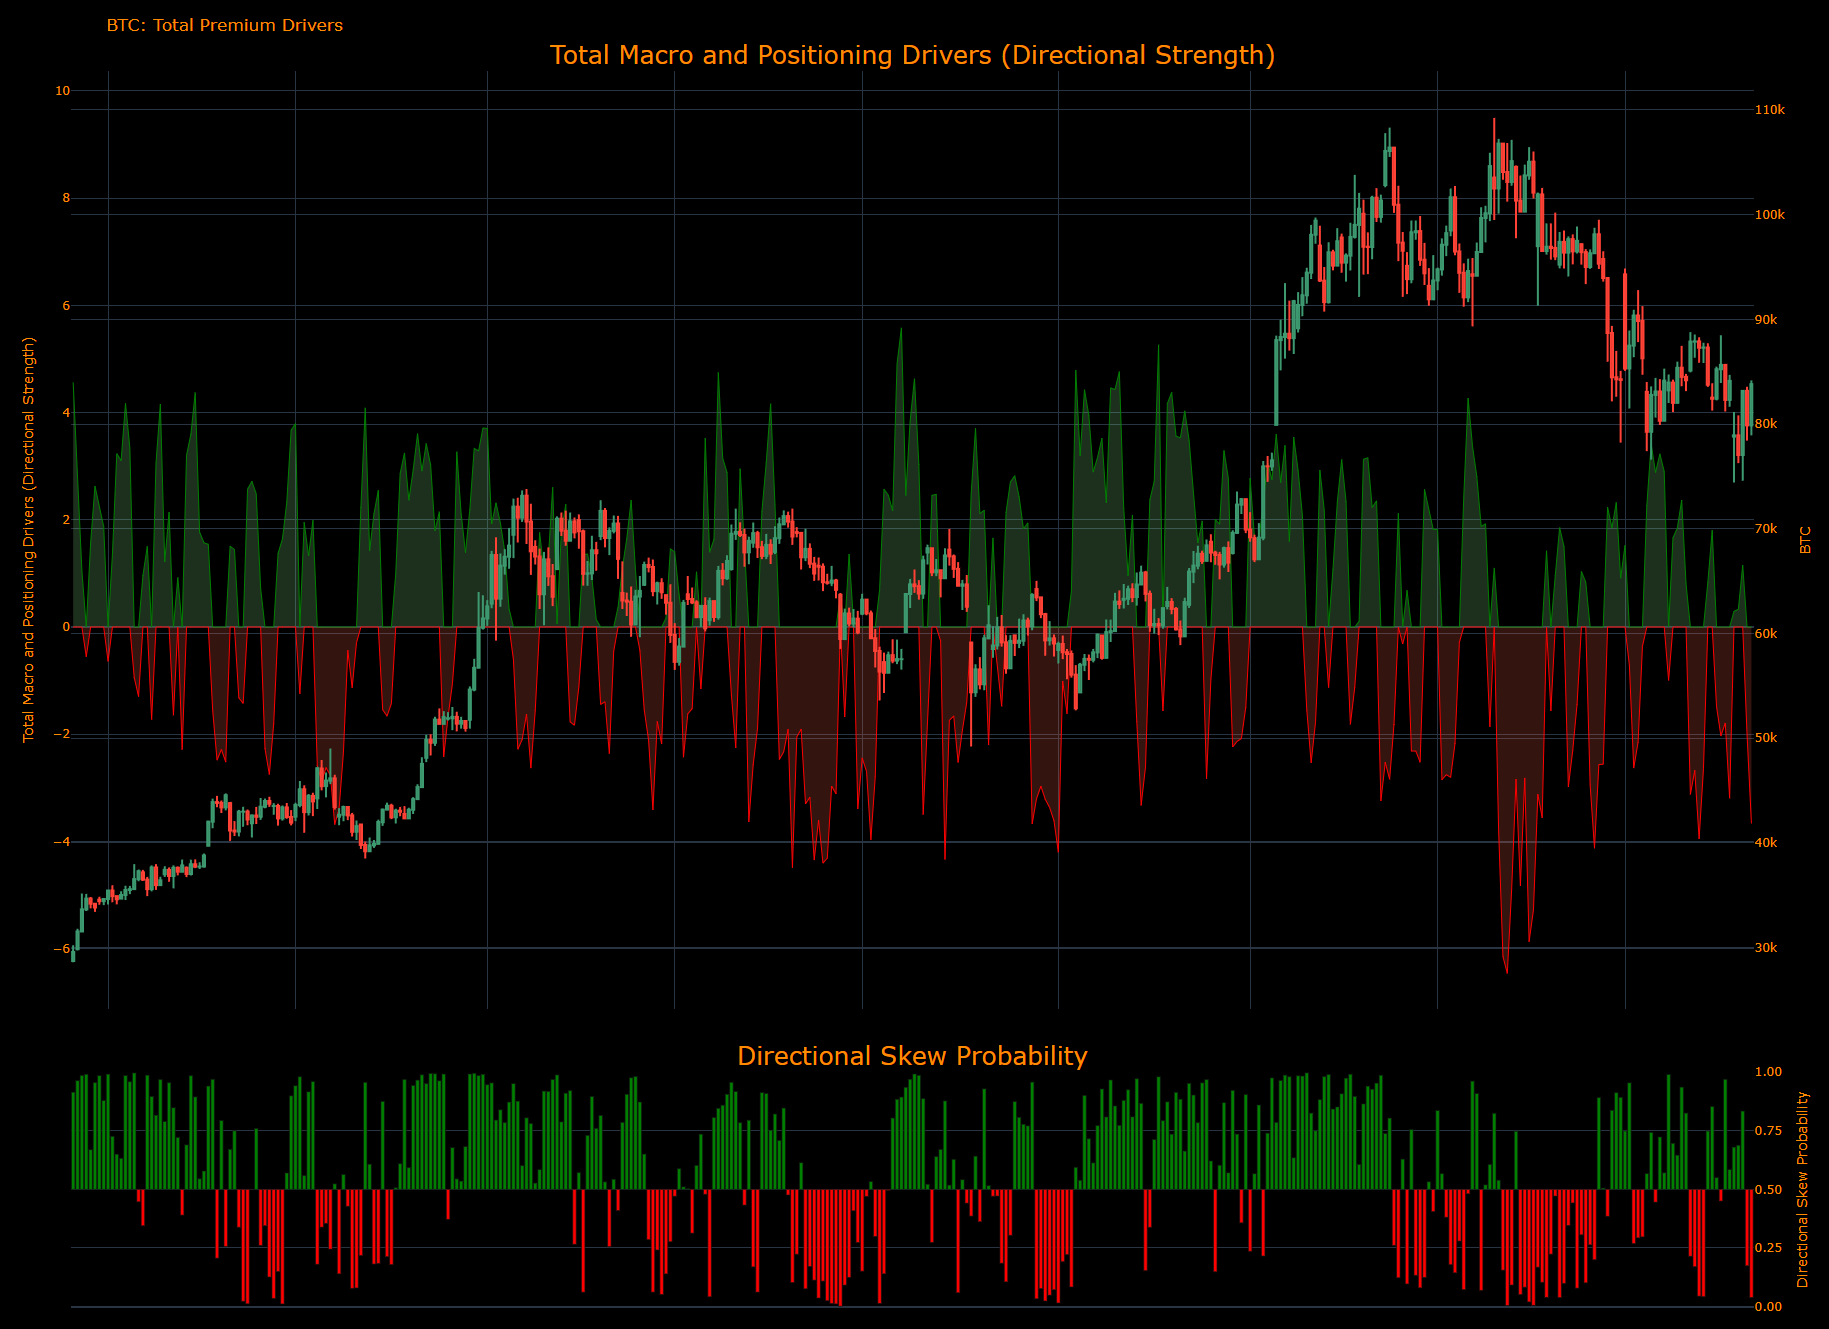
In the top panel, the total impulse of macro drivers and positioning is illustrated in its strength. The greater the strength in the move, the higher the probability and amplitude of the move that is likely to take place. The bottom panel illustrates if the skew is either bullish or bearish probability.
(The US Macro Liquidity Driver contribution identifies HOW the drivers of US liquidity are contributing to the returns of Bitcoin. In the same manner, the higher the contribution moves, the more strength the drivers have in pushing Bitcoin in a specific direction.)

(The Bitcoin Risk Premium Driver contribution identifies HOW the risk premium of Bitcoin is contributing to returns. In the same manner, the higher the contribution moves, the more strength the drivers have in pushing the Bitcoin in a specific direction.)
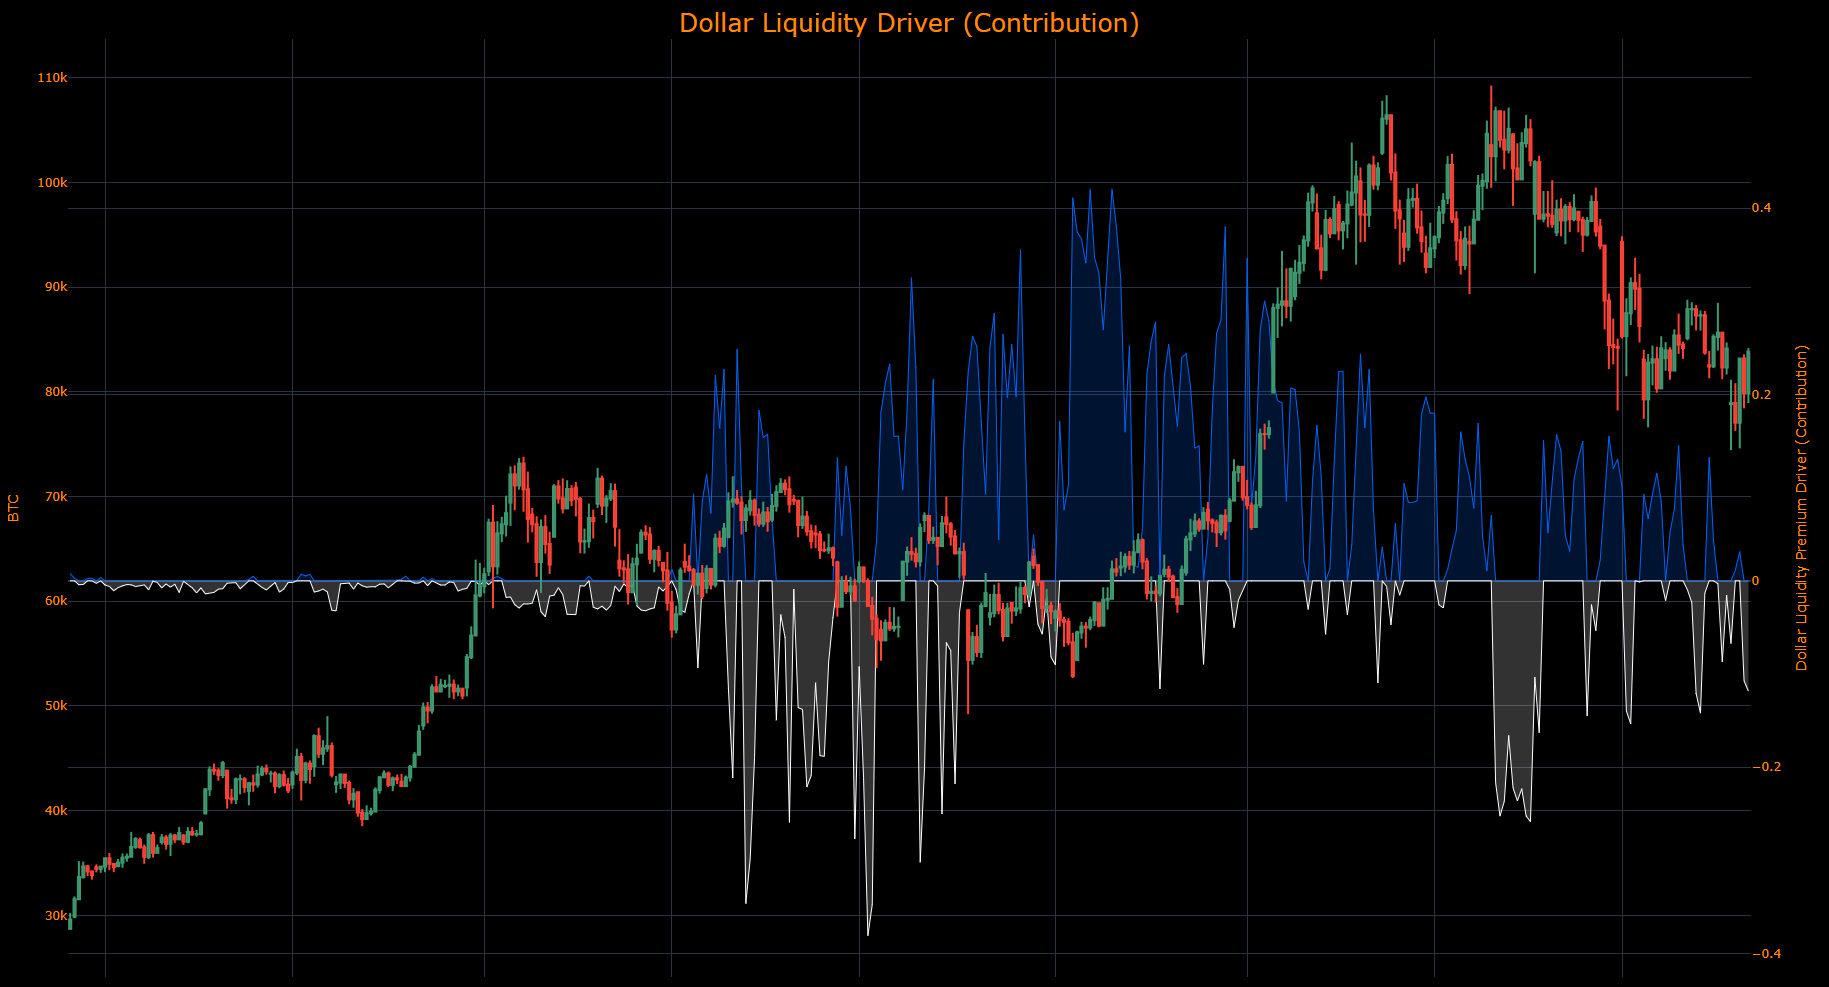
(The Dollar Liquidity Driver contribution identifies HOW the drivers of dollar liquidity are contributing to the returns of Bitcoin. In the same manner, the higher the contribution moves, the more strength the drivers have in pushing Bitcoin in a specific direction.)
(The Global Liquidity Driver contribution identifies HOW the drivers of global liquidity are contributing to the returns of Bitcoin. In the same manner, the higher the contribution moves, the more strength the drivers have in pushing Bitcoin in a specific direction.)

As always, a Pepe for the culture:

The information on this website/Substack is for information purposes only. It is believed to be reliable, but Capital Flows does not warrant its completeness or accuracy. The information on the website/Substack is not intended as an offer or solicitation for the purchase of stock or any financial instrument. The information and materials contained in these pages and the terms, conditions and descriptions that appear, are subject to change without notice. Unauthorized use of Capital Flows websites and systems including but not limited to data scraping, unauthorized entry into Capital Flows systems, misuse of passwords, or misuse of any information posted on a site is strictly prohibited. Your eligibility for particular services is subject to final determination by Capital Flows and/or its affiliates. Investment services are not bank deposits or insured by the FDIC or other entity and are subject to investment risks, including possible loss of principal amount invested. Your use of any information which is proprietary to Capital Flows or a third-party information provider shall only be used on individual devices without any right to redistribute, upload, export, copy, or otherwise transfer the information to any centralized interdepartmental or shared device, directory, database or other repository nor to otherwise make it available to any other entity/person/third party, without the prior written consent of Capital Flows.
Thanks for the great analysis as always! One small request: could you consider using a different separator instead of “=” when noting technical levels? In the audio version, it reads out as “equal to”
each time, which can be a bit distracting. Appreciate all your work!
Are these stats per your target frequency? If so, how far into the future are your targets for your other markets? For instance, I think you mentioned your target for equities is 5 days out.