

Macro Regime Tracker: Strategy Update
Macro regime and risk assets qualified clearly

Macro Regime Tracker:
The Macro Regime Tracker offers a daily lens on how shifts in growth, inflation, and liquidity affect short-term risk and reward. Leveraging machine learning, AI, and cross-asset data, it identifies macro changes and their impact on market positioning.
Macro Regime Tracker Index:
Macro Regime Context
Macro Tear Sheets: Equities, Fixed Income, FX, Crypto, and Commodities
Macro Regime Dashboard: Excel spreadsheet for economic data and interest rates
Growth, Inflation, Fixed Income, Credit, and Equities Regime Tracker
AI and Machine Learning Strategies - Macro Regime and Positioning Premiums Strategies: S&P 500, 2-Year Interest Rates, Gold, and Bitcoin
Macro Regime Context:
Today, it was shown that trading from headline to headline and tariff risk remain real. With such a large rally yesterday, it isn’t surprising to see a marginal retracement today. The end-of-week flows and trading into tomorrow will be critical for directionality into FOMC.
I will be covering more on this in an extensive report tomorrow
Main Developments In Macro
*US JOBLESS CLAIMS 223,000 IN APRIL 5 WEEK; EST. 223K
*US MARCH CONSUMER PRICES FALL 0.1% M/M; EST. +0.1%
*US MARCH CORE CPI RISES 0.1% M/M; EST. +0.3%
Fed’s Schmid Says He’s ‘Squarely Focused’ on Inflation Risks
*SCHMID: GROWTH RATE OF PUBLIC DEBT IS NOT SUSTAINABLE
*BESSENT: PUTTING A PROCESS IN PLACE FOR NEGOTIATIONS
*BESSENT: WILL HAVE GREAT CERTAINTY ON TARIFFS IN 90 DAYS
*TRUMP: WOULD LOVE TO BE ABLE TO WORK A DEAL WITH CHINA
*TRUMP: US STEEL WILL DO WELL BECAUSE OF TARIFFS
*COLLINS: SIGNAL MUST BE 'COMPELLING' TO CUT PREEMPTIVELY
*COLLINS: MIGHT STILL BE APPROPRIATE TO CUT LATER THIS YEAR
*COLLINS: MONETARY POLICY WELL POSITIONED FOR RANGE OF OUTCOMES
*COLLINS: SEE GROWTH SLOWING AND UNEMPLOYMENT RISING IN 2025
*COLLINS: UPSIDE INFLATION AND DOWNSIDE EMPLOYMENT RISKS RISING
*COLLINS: 10%+ EFFECTIVE TARIFF RATE MAY PUSH INF. WELL ABOVE 3%
*TRUMP THREATENS ADDITIONAL TARIFFS ON MEXICO OVER WATER RIGHTS
Macro Tear Sheets: Equities, Fixed Income, FX, Crypto, and Commodities
Macro Regime Dashboard: Excel spreadsheet for economic data and interest rates
An Important Note: Starting Friday, all of the strategies and in-depth commentary will be reserved for paid subscribers and behind the paywall. I have made them public this week so you can get a handle on them and understand the value they add. The mapping of the underlying macro drivers and positioning drivers are not even provided by the best investment banks in the world. We will continue to invest in the highest quality models and strategies that merge the new developments in AI and Machine Learning. If you are an early subscriber, you can lock in the current price of $150 a month for all of the future upside. The best is yet to come!
Growth, Inflation, Fixed Income, Credit, and Equities Regime Tracker
The Macro Regime Model offers a real-time view of growth, inflation, and yield curve dynamics, integrating these with credit market shifts, equity risk premiums, and positioning data. It connects upcoming catalysts to statistical drivers of asset prices, creating a unified framework that quantifies skew and clarifies risk-reward across asset classes.
Key Points:
S&P 500 Intraday – Tariff Turmoil Reignites Recession Fears
The S&P 500 sank -1.45% in a broad-based selloff as investor optimism over a temporary tariff pause quickly faded. Market participants refocused on the growing economic risks tied to Trump’s chaotic trade war escalation, particularly the record 145% tariff rate on Chinese goods. Safe-haven demand surged, growth expectations dimmed, and recession fears resurfaced.
Sector Contribution Breakdown
Information Technology (-0.35%) – Tech led the decline, as mega-cap names saw heavy de-risking. The sector remains acutely sensitive to global growth fears and earnings opacity driven by the unpredictable tariff regime.
Communication Services (-0.31%) – A sharp pullback in growth-heavy names that had led Wednesday’s rally. Reversal trades dominated, with many high-beta names facing renewed pressure.
Health Care (-0.21%) – Defensive characteristics offered little shelter as the sector was pulled down alongside broader equity weakness. Uncertainty in corporate guidance added to the drag.
Financials (-0.20%) – Rising long-end yields failed to lift the sector as macro risks eclipsed any curve steepening benefit. Banks remain vulnerable to risk-off positioning.
Consumer Discretionary (-0.17%) – The sector gave back part of Wednesday’s gains, as doubts re-emerged about the impact of higher consumer prices and trade disruption on household spending.
Energy (-0.14%) – Oil prices slipped again amid global demand concerns, leaving the sector under pressure. Sentiment remains tightly linked to macro expectations.
Industrials (-0.07%) – Trade war exposure continues to weigh heavily. The sector remains a barometer for global trade sentiment, and Thursday's price action pointed toward skepticism over resolution.
Materials (-0.04%), Real Estate (-0.02%), Consumer Staples (-0.01%) – These sectors posted modest losses, offering minimal insulation from broad de-risking. Defensive postures held relatively better, but investors avoided committing capital amid macro fog.
Utilities (0.00%) – The lone neutral sector on the day. A slight bid in rate-sensitive names was offset by the broader market drag.
Analysis
Thursday’s pullback marked a sharp reality check for markets that had briefly embraced the idea of tariff relief. Instead, investors were reminded of the erratic and opaque policy regime, which continues to destabilize both corporate planning and asset pricing.
Risk appetite deteriorated as:
Forward guidance from companies collapsed into silence.
Volatility surged, with the VIX spiking back above 40.
Yields climbed, suggesting that fears of inflation and funding stress are coexisting uncomfortably with recession risk.
Systematic flows reversed, and selling accelerated across growth and cyclicals.
The post-pause rally is now clearly revealed as a technical unwind, not a fundamental shift in outlook. With China still under aggressive tariffs and no diplomatic off-ramp in sight, recession probabilities are rising, not falling. Expect continued volatility, poor visibility on earnings, and fading confidence in policy direction.

Unweighted Sector Moves
Energy (-4.33%) – The worst-performing sector. Oil demand fears reemerged forcefully as recession risks and trade uncertainty overshadowed yesterday’s bounce. E&Ps and service names reversed gains aggressively.
Communication Services (-3.25%) – Growth darlings were dumped. Heavily shorted names saw yesterday’s relief squeezed out in a sharp reversal, underscoring fragile positioning and deep skepticism about forward guidance.
Health Care (-1.91%) – Despite its defensive nature, the sector broke lower amid concerns over margin compression and a lack of visibility into post-tariff consumer behavior.
Materials (-1.79%) – A major reversal in cyclical sentiment. While these names bounced yesterday, today's action shows lingering structural concern about global trade volumes and input cost volatility.
Consumer Discretionary (-1.58%) – Retail and travel stocks fell back as consumer exposure to inflation and trade pass-through effects returned to focus. The policy backdrop remains too chaotic for sustained re-risking here.
Financials (-1.41%) – Yield curve stabilization failed to support the sector. Macro fears continue to outweigh rate moves, and investors remain wary of credit and liquidity risks in a volatile tape.
Information Technology (-1.19%) – Tech leadership crumbled with mega-caps dragging on the unweighted average. Semis and high-multiple names were under particular pressure.
Real Estate (-0.93%), Industrials (-0.86%) – Both sectors suffered broad-based weakness. Industrial names retraced gains as optimism on trade thaw gave way to fresh supply chain anxiety, while REITs struggled with rising rate volatility.
Consumer Staples (-0.11%) – The most resilient of the day’s losers. Modest downside here reflects the defensive nature of the sector, but even staples are no longer immune to tariff-induced margin risk.
Utilities (+0.16%) – The lone green shoot. Lower beta, rate-sensitive, and viewed as a temporary shelter, Utilities caught some inflows amid broad de-risking.
Analysis
Today’s unweighted sector performance paints a far bleaker picture than the headline index. Beneath the surface, breadth has eroded substantially, and participation in yesterday’s rally now looks more like a mechanical squeeze than a foundation for recovery.
High-beta sectors reversed, with Energy, Comm Services, and Discretionary all sharply lower.
Defensives held better, but failed to attract material upside flow — suggesting hesitation, not conviction.
Breadth deterioration adds to concerns that the market is still processing a shock, not stabilizing from it.
Markets remain deeply reactive, not proactive. This is a tape dominated by headline risk, shifting policy stances, and positioning whiplash.
The unweighted view underscores the fragility of sentiment: yesterday’s euphoria was thin, and today’s selling was broad-based and intense.
Until there is a credible policy pivot or macro stabilization, rallies should be treated as tactical and not the start of a durable recovery.
Volatility is the new norm, and average stock performance today sends a clear message: the underlying storm is far from over.

Sector Breadth – Collapse in Participation Breaks Momentum Across All Horizons
Today’s market action marks a stark reversal from yesterday’s surge, with the far-right edge of all three charts (10-day, 20-day, and 50-day moving averages) showing a clear collapse in sector participation.
Unlike yesterday’s surge, which showed synchronized strength across nearly every sector, today’s pullback reflects a decisive rejection of risk, a clear reversion from risk-on to risk-off positioning.
Credit Snapshot – Surge in Spreads Underscores Deepening Market Stress
Credit markets took a sharp turn for the worse today, with high-yield spreads spiking to 74.80 bps, breaching both the long-term average of 62.91 bps and the post-COVID median. This marks a clear deterioration in credit sentiment, coinciding with heightened equity volatility, collapsing breadth, and growing macro uncertainty tied to the ongoing tariff escalation.
Today’s surge breaks the tentative stabilization seen in yesterday’s session and confirms that credit is no longer just reacting to equities — it’s now leading the stress signal. This is often a critical turning point in market structure, where credit deterioration feeds back into equity fragility.
We are watching
A further breakdown in earnings guidance, especially from cyclicals and highly levered firms
Deterioration in primary issuance demand as volatility sidelines buyers
Spillover into investment-grade and funding markets if spreads continue to widen
Renewed policy uncertainty around fiscal or trade that accelerates the de-risking

Short-End Rates – Cuts Firmly Back in Focus as Market Reprices Growth Risks
Rate futures resumed pricing a more aggressive easing path, with 90.7 bps of cuts now expected by year-end 2025, up sharply from yesterday. Traders have shifted decisively toward a renewed Fed cutting cycle, driven by market turmoil, deepening credit stress, and the absence of a coherent policy resolution.
Key Pricing Shifts
Two full cuts priced across the next three meetings:
June 18: 18.8 bps priced (75.2% chance of a cut)
July 30: 20.9 bps priced (83.6% chance) → Market sees back-to-back cuts as baseline, reflecting concern over deteriorating conditions.
May 7: 9.5 bps priced (38.0% probability) – modest but rising chance of an earlier start to easing.
By September 2025: 66.4 bps priced across four meetings – a material shift from the post-rally unwind.
Full year 2025: 90.7 bps of easing priced – retracing more than half of yesterday’s retracement and reflecting growing conviction that rate cuts are coming, and soon.
Macro View Point
Crisis risk re-priced back in: Yesterday’s pause in front-end easing was short-lived. The renewed volatility across equities, credit, and sector breadth has pulled forward expectations for policy response especially if incoming data reinforces softening demand or sticky uncertainty.
June/July now the focus: The market sees June 18 and July 30 as consecutive cut meetings, a clear reflection of deteriorating confidence in the Fed’s ability to wait-and-see. This marks a return to pre-pause urgency in the rate path.
CPI reinforces the shift: This morning’s softer-than-expected inflation data gave markets further confidence that the Fed has cover to begin easing:
Headline CPI MoM printed at -0.1% vs. +0.1% est.
Core CPI MoM at +0.1% vs. +0.3% est.
YoY measures also cooled, with Core CPI YoY at +2.8% vs. 3.0% est.
These results suggest underlying disinflation is broadening particularly in core goods and some services, just as financial conditions are tightening amid trade policy shocks. This dual dynamic strengthens the case for a more front-loaded Fed pivot.
Conditional easing, but urgency rising: Traders still see 2025 cuts as data-driven, but the sharp rise in risk premiums and now-confirmed disinflation trends have reintroduced a near-term bias to act. The market is no longer pricing “panic,” but it is clearly bracing for trouble, and now believes the Fed can cut without stoking inflation fears.

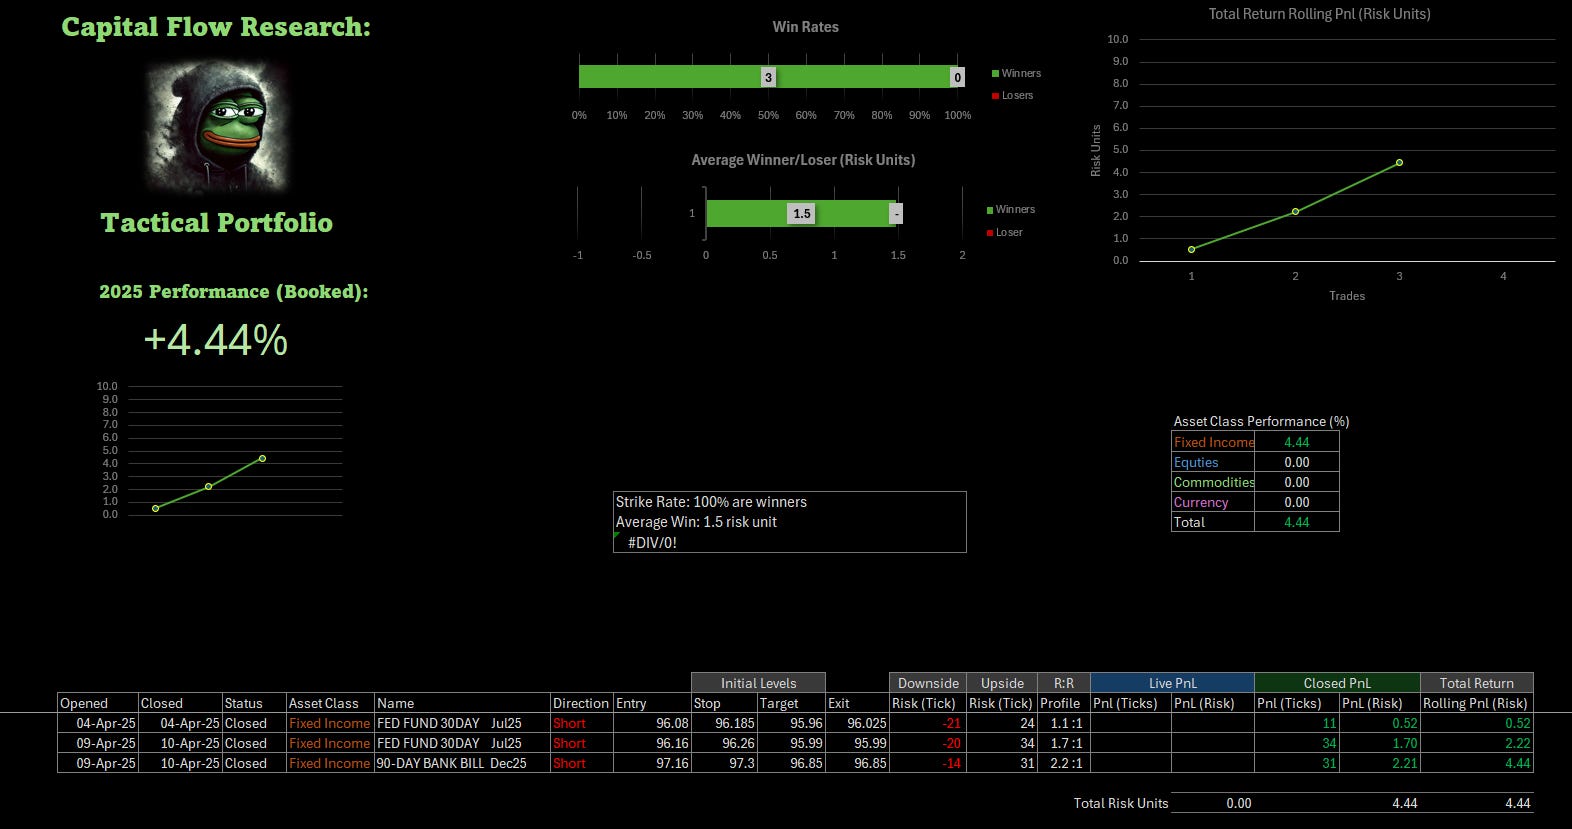
Tactical Portfolio
Two key position where executed some 10 hours before the short end sold off today, (1) short Fed Funds and (2) short Australian Bank Bills (Sofr equivalent). Both a play on excessive cut for each central bank.


Macro Regime and Positioning Premiums - Strategies:
As of market close, the strategies have updated, and here are the new directional skews.

Equities (ES)
==================================================
Technical Levels for ES1 Index
==================================================
Daily Range: 192.31
Resistance Levels (Above Open):
------------------------------
R5: 5347.42 | Offset: + 48.17 *
R4: 5334.08 | Offset: + 34.83 *
R3: 5324.42 | Offset: + 25.17 *
R2: 5311.22 | Offset: + 11.97 *
R1: 5301.42 | Offset: + 2.17 *
------------------------------
Open Price: 5299.25
------------------------------
Support Levels (Below Open):
------------------------------
S1: 5288.08 | Offset: - 11.17 *
S2: 5278.42 | Offset: - 20.83 *
S3: 5016.90 | Offset: -282.35
S4: 4619.67 | Offset: -679.58
S5: N/A | Offset: N/A
==================================================
* Denotes intraday level, likely tested
(In the top panel, the total impulse of macro drivers and positioning is illustrated in its strength. The greater the strength in the move, the higher the probability and amplitude of the move that is likely to take place. The bottom panel illustrates if the skew is either bullish or bearish probability.)

(The next three charts show the underlying contribution for the Total Macro and Positioning Drivers in the chart above. These allow you to see the WHY behind moves.)
(The Equity Risk Premium contribution aggregates major macro factors and the strength of factors driving equity risk premiums. In the same manner, the higher the contribution moves, the more strength the drivers have in pushing the index in a specific direction.)

(The Positioning Premium Driver contribution identifies HOW the drivers of positioning are contributing to equity returns. In the same manner, the higher the contribution moves, the more strength the drivers have in pushing the index in a specific direction.)

(The Growth Risk Premium Driver contribution identifies HOW the drivers of growth are contributing to equity returns. In the same manner, the higher the contribution moves, the more strength the drivers have in pushing the index in a specific direction.)

2-Year Interest Rate
==================================================
Technical Levels for USGG2YR Index
==================================================
Daily Range: 0.13
Resistance Levels (Above Open):
------------------------------
R5: 4.08 | Offset: + 0.19
R4: 4.03 | Offset: + 0.15
R3: 3.97 | Offset: + 0.08 *
R2: 3.91 | Offset: + 0.03 *
R1: 3.89 | Offset: + 0.00 *
------------------------------
Open Price: 3.88
------------------------------
Support Levels (Below Open):
------------------------------
S1: 3.83 | Offset: - 0.05 *
S2: 3.82 | Offset: - 0.06 *
S3: 3.81 | Offset: - 0.07 *
S4: 3.80 | Offset: - 0.09 *
S5: 3.73 | Offset: - 0.16
==================================================
* Denotes intraday level, likely tested
(In the top panel, the total impulse of macro drivers and positioning is illustrated in its strength. The greater the strength in the move, the higher the probability and amplitude of the move that is likely to take place. The bottom panel illustrates if the skew is either bullish or bearish probability.)
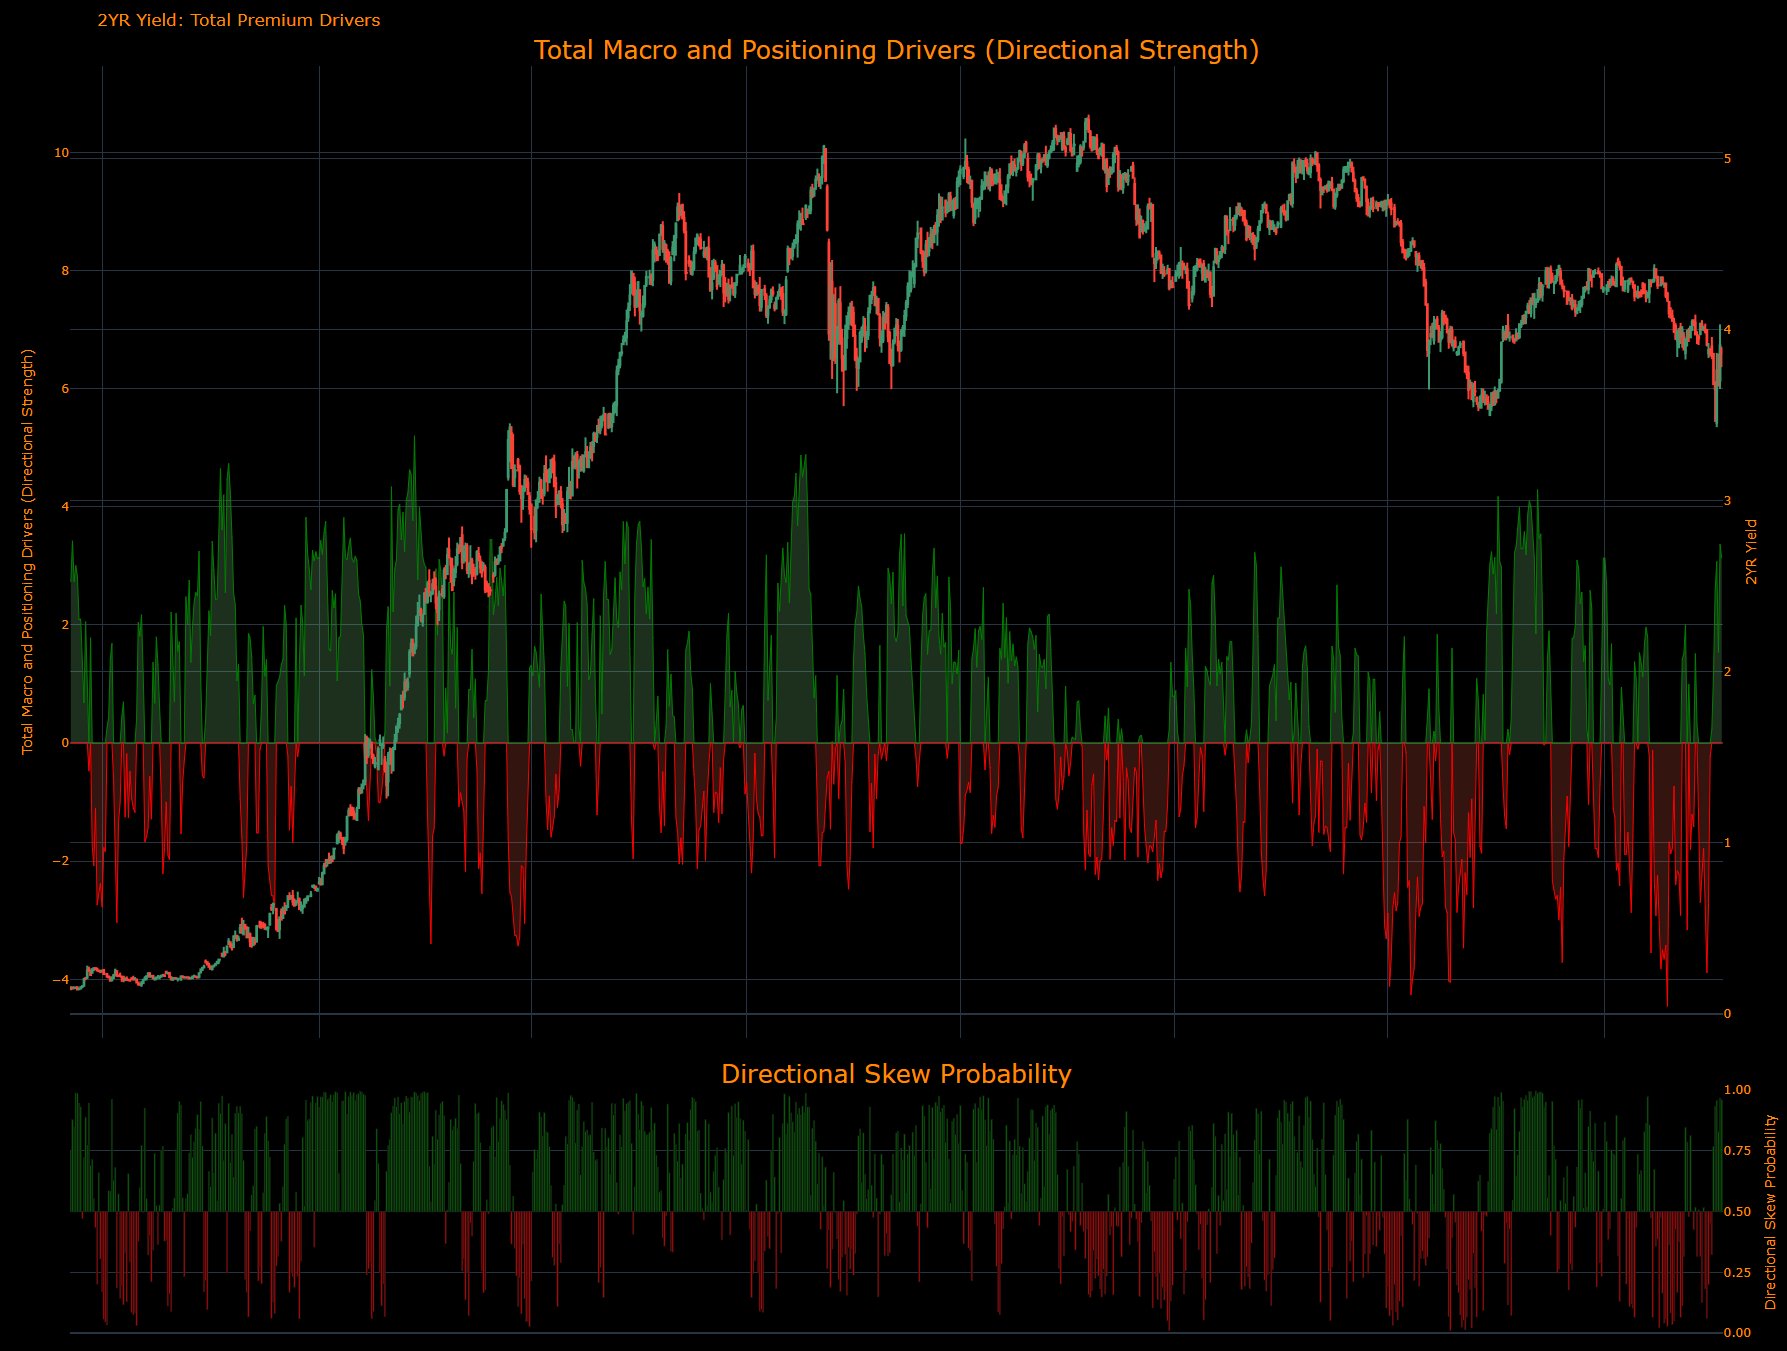
(The Inflation Risk Premium Driver contribution identifies HOW the drivers of inflation expectations are contributing to 2-year returns. In the same manner, the higher the contribution moves, the more strength the drivers have in pushing rates in a specific direction.)

(The Commodity Premium Driver contribution identifies HOW the drivers of commodities are contributing to 2-year returns. In the same manner, the higher the contribution moves, the more strength the drivers have in pushing rates in a specific direction.)

(The Growth Risk Premium Driver contribution identifies HOW the drivers of growth are contributing to 2-year returns. In the same manner, the higher the contribution moves, the more strength the drivers have in pushing rates in a specific direction.)

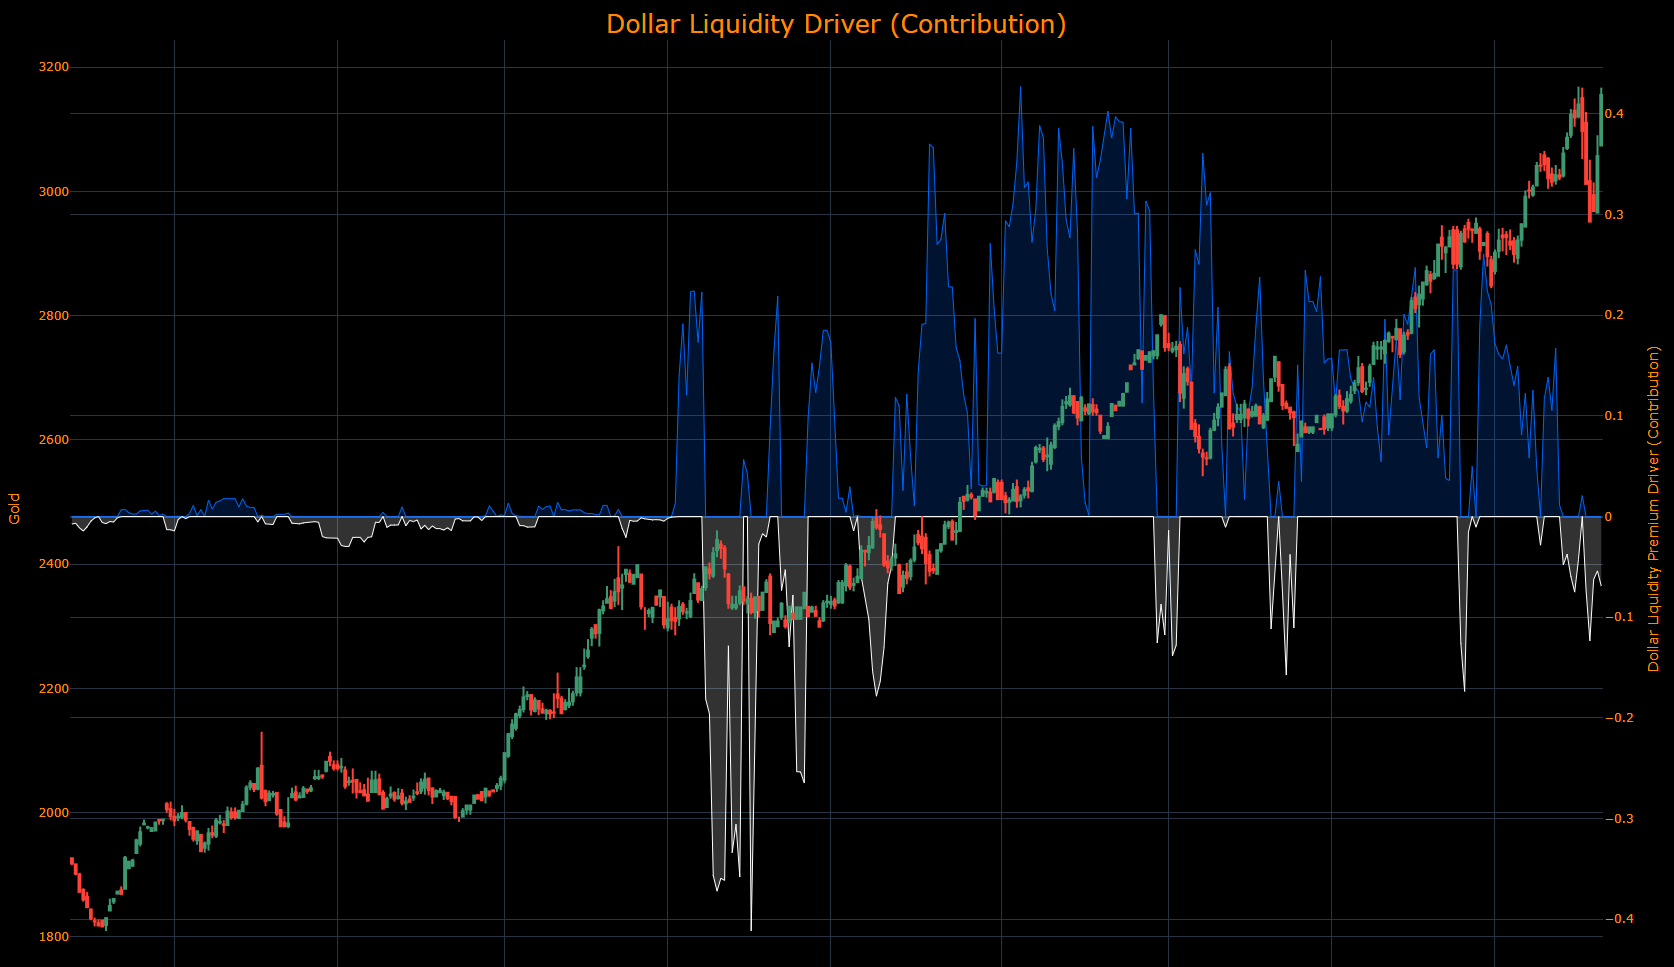
Gold
==================================================
Technical Levels for GC1 Comdty
==================================================
Daily Range: 37.17
Resistance Levels (Above Open):
------------------------------
R5: 3285.67 | Offset: +211.77
R4: 3226.33 | Offset: +152.43
R3: 3190.77 | Offset: +116.87
R2: 3150.37 | Offset: + 76.47
R1: 3095.87 | Offset: + 21.97 *
------------------------------
Open Price: 3073.90
------------------------------
Support Levels (Below Open):
------------------------------
S1: 3070.85 | Offset: - 3.05 *
S2: 3069.22 | Offset: - 4.68 *
S3: 3057.91 | Offset: - 15.99 *
S4: 3036.62 | Offset: - 37.28
S5: 3036.53 | Offset: - 37.37
==================================================
* Denotes intraday level, likely tested
In the top panel, the total impulse of macro drivers and positioning is illustrated in its strength. The greater the strength in the move, the higher the probability and amplitude of the move that is likely to take place. The bottom panel illustrates if the skew is either bullish or bearish probability.

(The US Macro Liquidity Driver contribution identifies HOW the drivers of US liquidity are contributing to the returns of Gold. In the same manner, the higher the contribution moves, the more strength the drivers have in pushing gold in a specific direction.)

(The Gold Risk Premium Driver contribution identifies HOW the risk premium of gold is contributing to returns. In the same manner, the higher the contribution moves, the more strength the drivers have in pushing gold in a specific direction.)

(The Dollar Liquidity Driver contribution identifies HOW the drivers of dollar liquidity are contributing to the returns of Gold. In the same manner, the higher the contribution moves, the more strength the drivers have in pushing gold in a specific direction.)
The Global Liquidity Driver contribution identifies HOW the drivers of global liquidity are contributing to the returns of Gold. In the same manner, the higher the contribution moves, the more strength the drivers have in pushing gold in a specific direction.
Bitcoin
==================================================
Technical Levels for XBTUSD Curncy
==================================================
Daily Range: 2292.32
Resistance Levels (Above Open):
------------------------------
R5: 81044.01 | Offset: +1165.80 *
R4: 80412.91 | Offset: +534.70 *
R3: 80240.87 | Offset: +362.66 *
R2: 80192.33 | Offset: +314.12 *
R1: 79935.13 | Offset: + 56.92 *
------------------------------
Open Price: 79878.21
------------------------------
Support Levels (Below Open):
------------------------------
S1: 79457.35 | Offset: -420.86 *
S2: 79236.77 | Offset: -641.44 *
S3: 78979.57 | Offset: -898.64 *
S4: 75386.44 | Offset: -4491.77
S5: 72954.22 | Offset: -6923.99
==================================================
* Denotes intraday level, likely tested
In the top panel, the total impulse of macro drivers and positioning is illustrated in its strength. The greater the strength in the move, the higher the probability and amplitude of the move that is likely to take place. The bottom panel illustrates if the skew is either bullish or bearish probability.
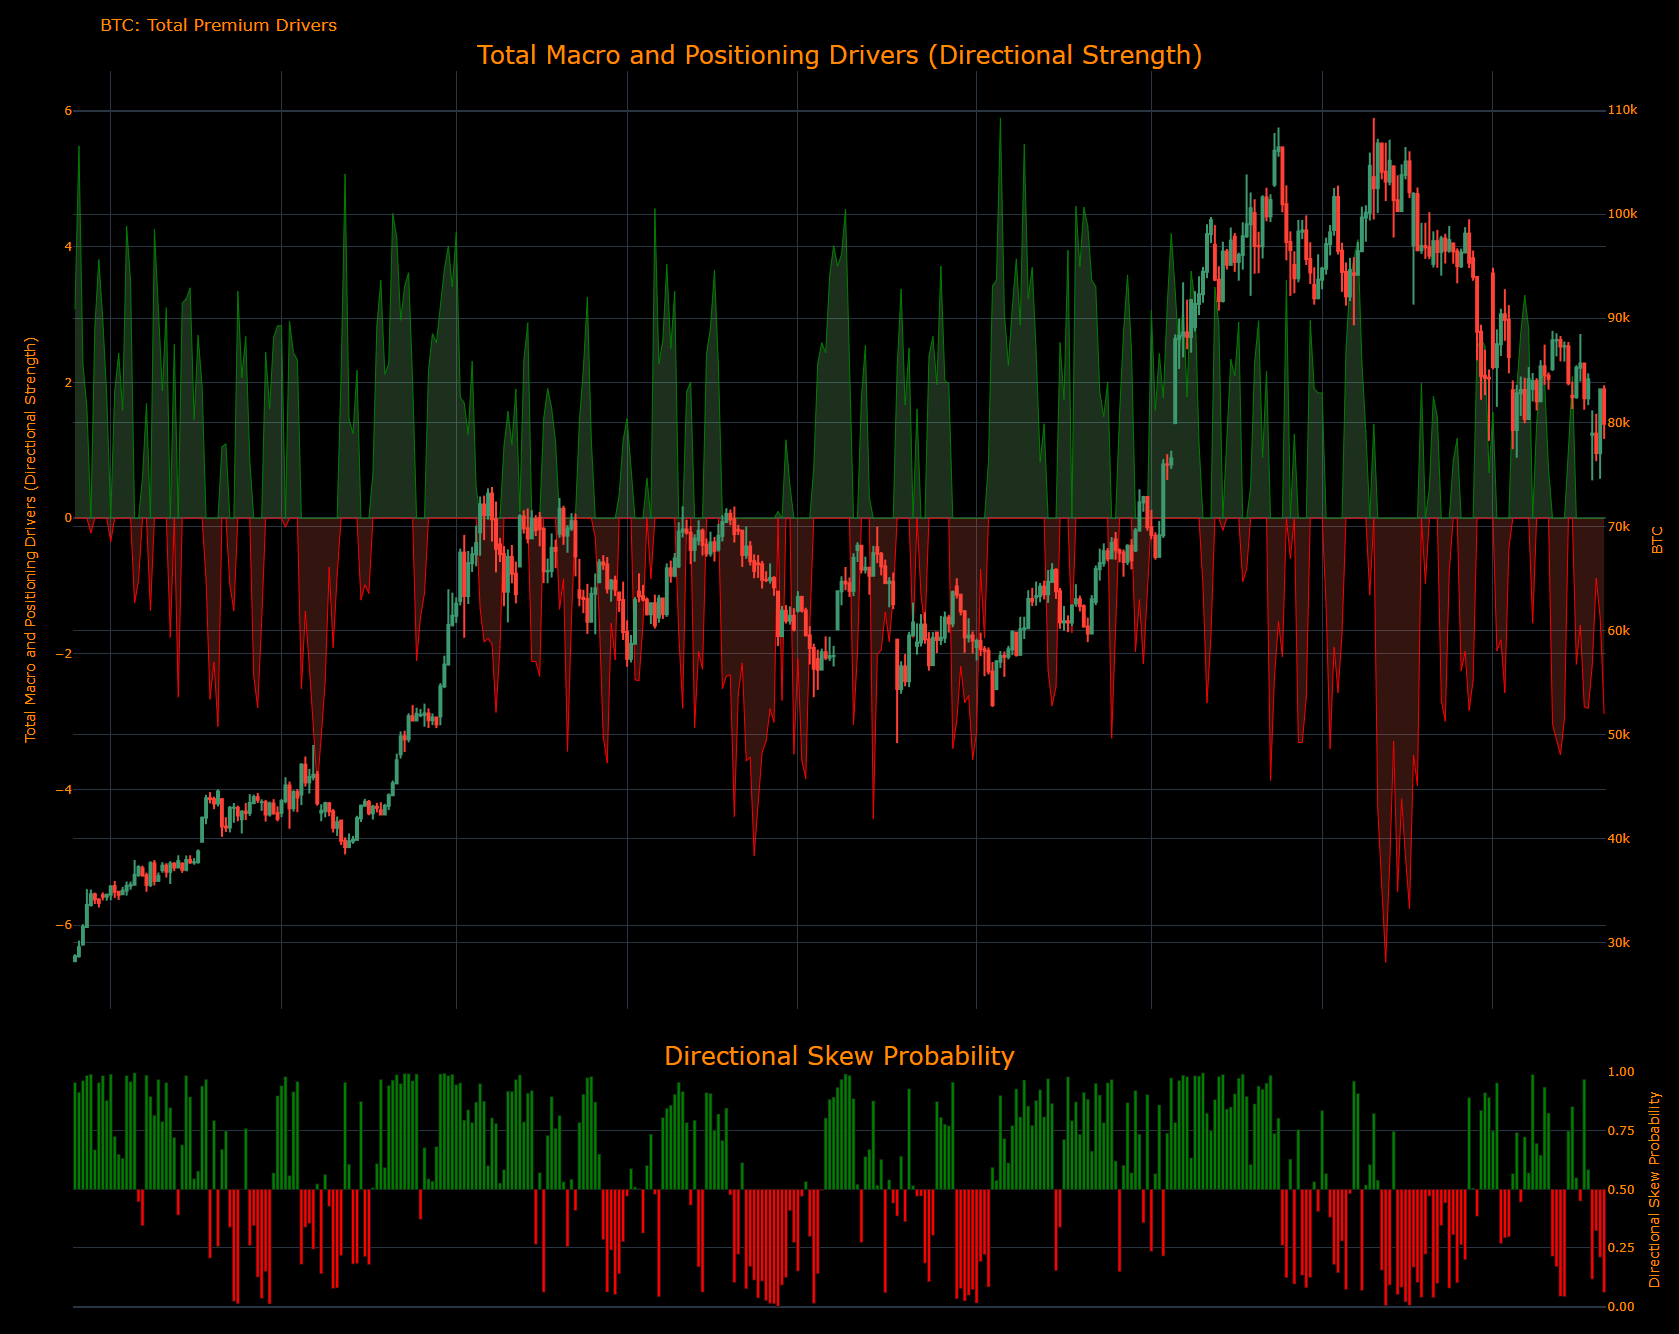
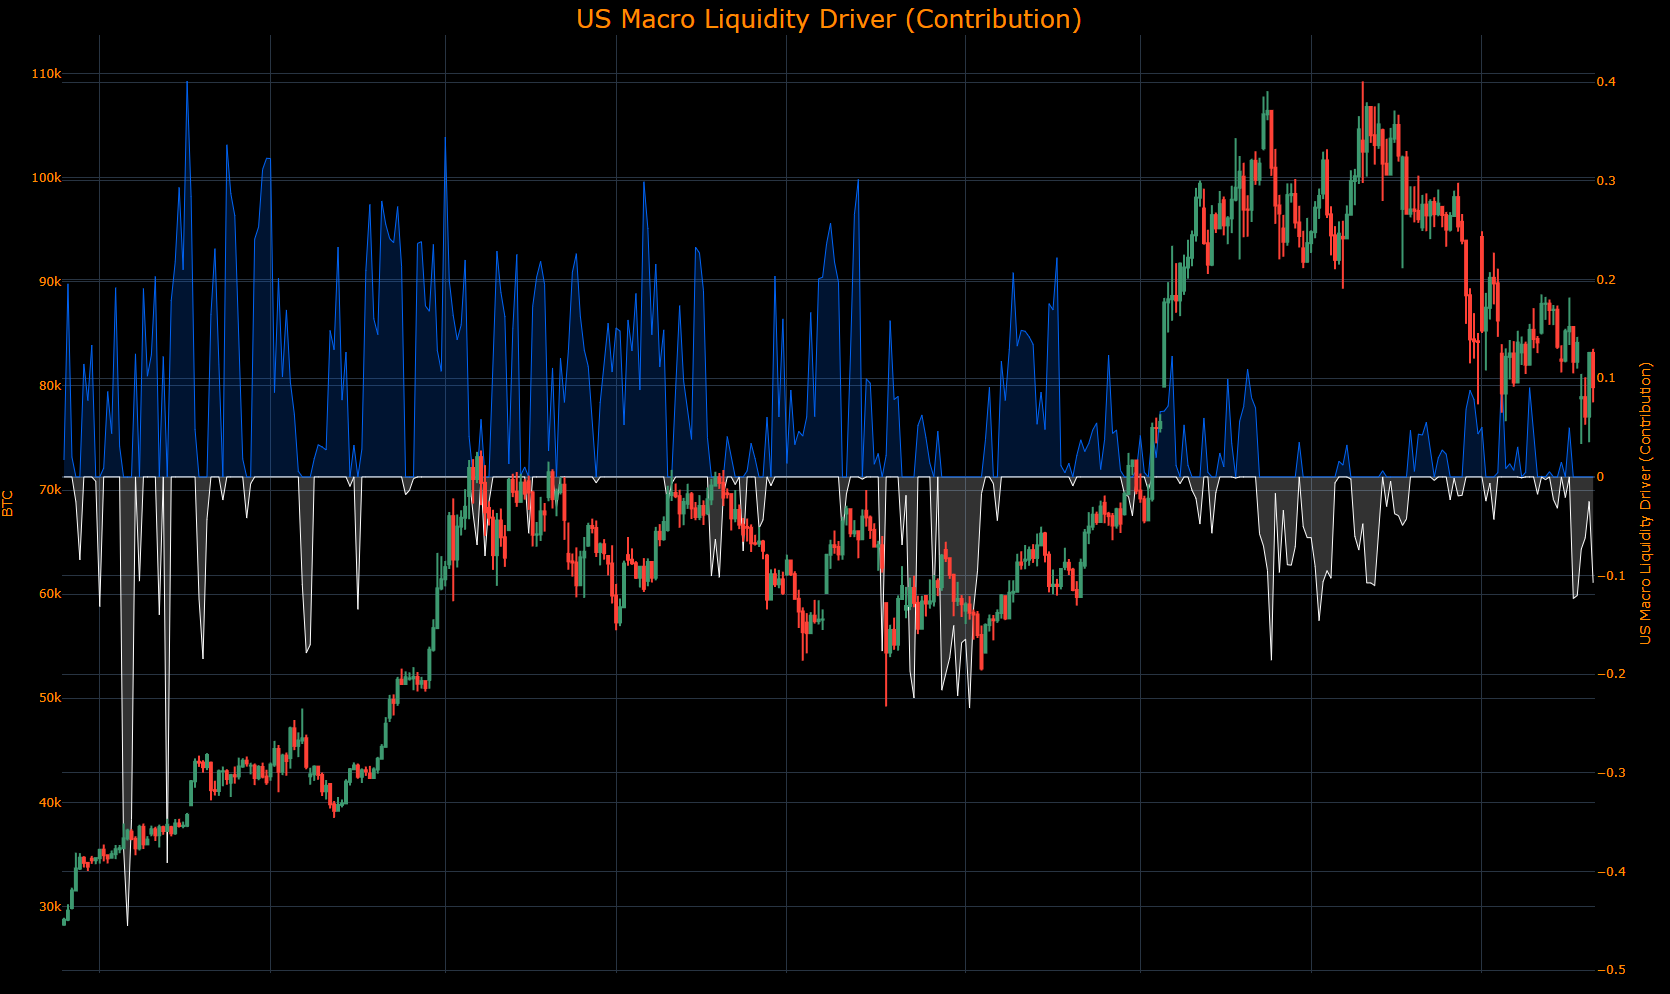
(The US Macro Liquidity Driver contribution identifies HOW the drivers of US liquidity are contributing to the returns of Bitcoin. In the same manner, the higher the contribution moves, the more strength the drivers have in pushing Bitcoin in a specific direction.)
(The Bitcoin Risk Premium Driver contribution identifies HOW the risk premium of Bitcoin is contributing to returns. In the same manner, the higher the contribution moves, the more strength the drivers have in pushing the Bitcoin in a specific direction.)

(The Dollar Liquidity Driver contribution identifies HOW the drivers of dollar liquidity are contributing to the returns of Bitcoin. In the same manner, the higher the contribution moves, the more strength the drivers have in pushing Bitcoin in a specific direction.)

(The Global Liquidity Driver contribution identifies HOW the drivers of global liquidity are contributing to the returns of Bitcoin. In the same manner, the higher the contribution moves, the more strength the drivers have in pushing Bitcoin in a specific direction.)

As always, a Pepe for the culture:

The information on this website/Substack is for information purposes only. It is believed to be reliable, but Capital Flows does not warrant its completeness or accuracy. The information on the website/Substack is not intended as an offer or solicitation for the purchase of stock or any financial instrument. The information and materials contained in these pages and the terms, conditions and descriptions that appear, are subject to change without notice. Unauthorized use of Capital Flows websites and systems including but not limited to data scraping, unauthorized entry into Capital Flows systems, misuse of passwords, or misuse of any information posted on a site is strictly prohibited. Your eligibility for particular services is subject to final determination by Capital Flows and/or its affiliates. Investment services are not bank deposits or insured by the FDIC or other entity and are subject to investment risks, including possible loss of principal amount invested. Your use of any information which is proprietary to Capital Flows or a third-party information provider shall only be used on individual devices without any right to redistribute, upload, export, copy, or otherwise transfer the information to any centralized interdepartmental or shared device, directory, database or other repository nor to otherwise make it available to any other entity/person/third party, without the prior written consent of Capital Flows.
I saw that you added stats to the tactical portfolio, but could you also summarize the stats to the macro regime and positioning strategies (win rate, Sharpe, etc.)? Thank you!
How much credit do we give to Bessent? Outside of his time with Soros, his personal ventures have been fairly poor.