Macro Report
Growth, Inflation and Liquidity
Below is a macroeconomic report breaking down the current situation in financial markets.
Quick logistics note: if you have not read the first post where I laid out my framework, that would likely be helpful:
Also please don’t forget the disclaimers in the “About” section. Final thing, if you only subscribed and didn’t make a substack account, it might be difficult to see past publications. If there are any issues then feel free to reach out.
On to the macro report!………
Summary: During 2022, inflation was the primary driver of financial markets. We are now entering a period where slowing growth is likely to be the primary driver of financial markets. Since October 2022 when Core inflation peaked, both stocks and bonds have rallied from their low which has given market participants the illusion that the bear market has ended. This narrative of “inflation has peaked so the FED will stop hiking and the bear market is over” doesn’t take into account all the causal drivers of asset markets. On a macro basis, there are fundamentally three drivers of asset prices: growth, inflation, and liquidity. After we account for these primary drivers, then further analysis can be conducted on specific asset classes to further refine a view regarding their performance. This report will provide an analysis of 3 things: 1) growth, inflation and liquidity as it is likely to unfold in 2023 with scenario analysis. 2) the probable asset class performance in light of the analysis from #1. 3) specific trade setups and future catalysts.
Growth:
Growth in the US economy has a specific composition and each part functions differently during inflationary periods or monetary tightening periods.
The highlighted sections are the percentages of overall GDP. Personal consumption makes up the majority of GDP with goods accounting for 23.3% and services accounting for 44.9%. Gross private investment makes up 17.8%.
Each of these line items are interconnected and have different sensitivities to inflation and monetary tightening. On the inflation front, durable goods usually have a higher sensitivity to inflationary or disinflationary pressures. Service spending has a different inflation sensitivity in that when it begins to trend, it has an outsized impact because the primary input is wages. In the GDP line items, the variable with the highest sensitivity to interest rates is investment. All of these variables are connected and function in feedback loops that drive the cycle.
During 2022 we saw real wages decelerate as higher inflation decreased the ability of consumers to maintain the same quantity of goods and services. Simply put, as the prices went up, people bought less stuff.
Nominal consumption (in blue) is now decelerating as we come off the inflation peak but real consumption (in red) has been decelerating for a period of time.
To provide a clearer picture, this chart shows nominal consumption which is the same data point (in blue) from above. The chart backgrounds show 4 different scenarios where nominal and real consumption are either accelerating or decelerating. The yellow background is what we have been in for the past year. Basically, yellow shows the price going up and as a result, people buy less.
This type of dynamic transmits through the economic system in a very specific way. Any combination of growth and inflation that transmits through the economic system has different implications for various businesses and asset classes. Any business or asset class has varying degrees of sensitivity to changes in growth and inflation.
When the quantity of things purchased decreases, inevitably this transmits back to businesses but there is a time lag. Inventory-to-sales ratios are continuing to increase which means businesses need to produce fewer widgets to meet real demand.
The implication of lower real demand means businesses order fewer goods which transmits to industrial production. When industrial production begins to decelerate due to fewer widgets being ordered, companies will begin to lay off employees.
We are currently at the period of the cycle where falling output is going to constrain businesses to lay off employees. This constraint of laying off employees will cause earnings to decrease and credit spreads to expand. We can see historically that the two most recent recessions saw a combination of falling employment and rising inventory-to-sales ratios.
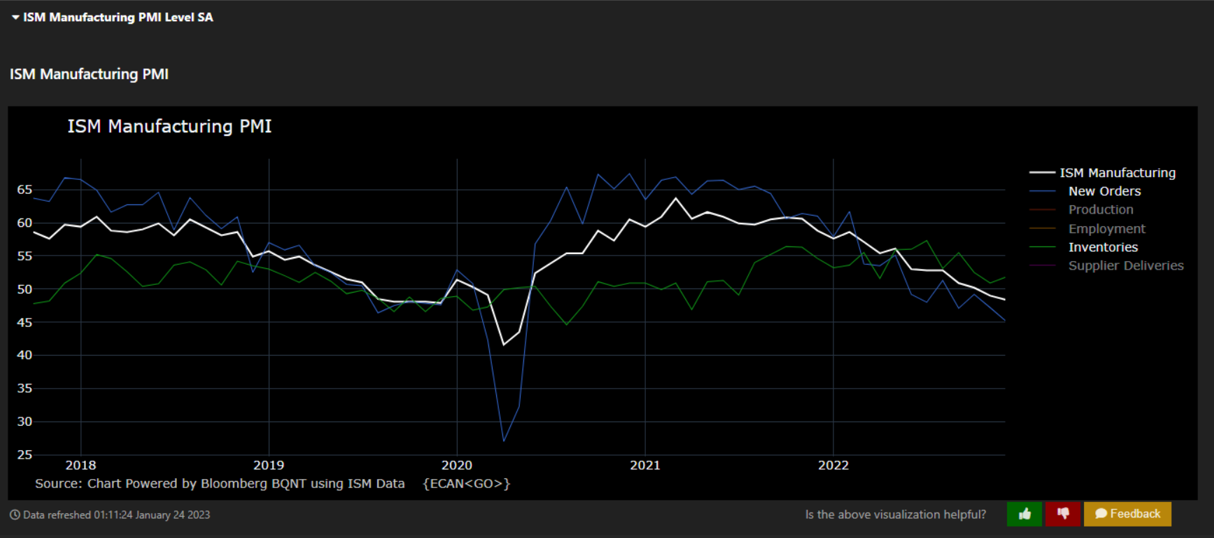
We can already see the PMI indices decelerate below 50 as the inventory to new orders spread widens.
With the most recent data print, the service index is also in contraction:
These are the preconditions for earnings to be skewed to the downside and credit spreads to expand.
Inflation:
Inflation connects with slowing growth, in that, as demand slows, inflationary pressures will decrease. However, the persistence of disinflation is likely dependent on how deep growth decelerates.
The chart below shows two inflation data points. The first is core CPI (in red) and the second is headline CPI (in blue). The distinction between these is important for two reasons.
First, interest rates topped when CORE CPI peaked as opposed to headline CPI. Core CPI is primarily connected to service sector prices while headline has inputs such as food and energy. In the current environment, the market is focused on CORE CPI because of its connection with the service sector and wages. We can have fluctuations in food and energy prices but wages are the key input.
Second, the CORE inflation component is directly connected to the service sector of the economy and thereby wages and employment. The growth picture laid out above indicates a skew to the downside in employment which likely means less upward pressure on wages. If the labor market begins to deteriorate, which appears very likely given the preconditions of the growth situation, the CORE component of CPI is likely to decelerate. This has implications for monetary policy and all asset classes.
The majority of market participants are focused on the fact that inflation is currently falling. The more important focus should be on the persistence and depth which inflation falls because this will be the primary input for any further interest rate hikes by the FED.
Liquidity:
Liquidity in this regime has primarily been dependent on the FED hiking interest rates and conducting QT operations. The FED has communicated a pause in their interest rate hiking operations (via SEP) in order to “hold higher for longer.” The chart below shows this dynamic with the dot plot and how the market is pricing that in.
The risk that exists is that the market is already pricing in rate cuts at the end of 2023 and into 2024. With core inflation still considerably elevated, it is unlikely that this market pricing will be realized. This means any bull market in bonds is going to be dependent on how much inflation falls which is dependent on the depth of a recession.
Further evidence of the negative liquidity impulse is the yield curve. The yield curve doesn’t fundamentally predict recession as much as it creates the preconditions for a recession via negative liquidity. The yield curve inversion means a negative liquidity impulse is occurring either by the FED hiking the short end or investors aggressively buying the long end in an attempt to find safety.
Until we see a steepening of the yield curve with growth bottoming, it’s unlikely that we will see a durable bottom occur in risk assets.
Given the growth, inflation, and liquidity picture laid out above, the scenario analysis is as follows:
- Scenario 1: growth decelerates considerably causing a recession, negative earnings, and the expansion of credit spreads. Core Inflation decelerates considerably allowing the FED to ease monetary policy marginally. The outcome is likely a disinflationary recession.
- Scenario 2: Growth decelerates marginally but not enough to cause core inflation to make a persistent move down which constrains the FED to do another round of hiking. This is likely to create the preconditions for a stagflationary recession.
In both of these scenarios, growth is skewed to the downside, inflation is skewed to the downside with the risk of an upside surprise and the FED’s actions are dependent on the degree to which inflation falls.
Asset Class Performance:
Stocks: When we look at equities, they are squarely in a bear market. Historically, these can last for prolonged periods of time even though dominant narratives propagate the end being just around the corner.
The most recent low in equities and bonds occurred at peak CPI. The following rally is primarily due to a marginal change in liquidity as there is less pressure on the FED to hike at the same speed. However, as the speed of FED hiking is slowing which puts less downward pressure on equities, the force of slowing growth is increasing. Furthermore, as noted above, the future rate cuts are likely overly optimistic which means the market is likely to surprise to the downside as the FED doesn’t cut but instead holds rates flat.
As noted in the introduction, the popular narrative of “inflation has peaked so the FED will stop hiking and the bear market is over” doesn’t take into account all the causal drivers of asset markets. This narrative doesn’t take into account growth dynamics. If growth deteriorates considerably during 2023 while the FED holds rates constant, equities have a high probability of making new lows. The bull case for equities is based on the assumption that inflation will fall considerably thereby allowing the FED to cut rates that will support equities. While this scenario is theoretically possible, it is improbable in its timing given that core inflation remains considerably high.
A bear market is a series of lower highs and lower lows. When a bear market in equities occurs, vicious rallies occur shaking out short positioning. The model below shows optimal places to short and cover the short. We are currently in a bear market rally.
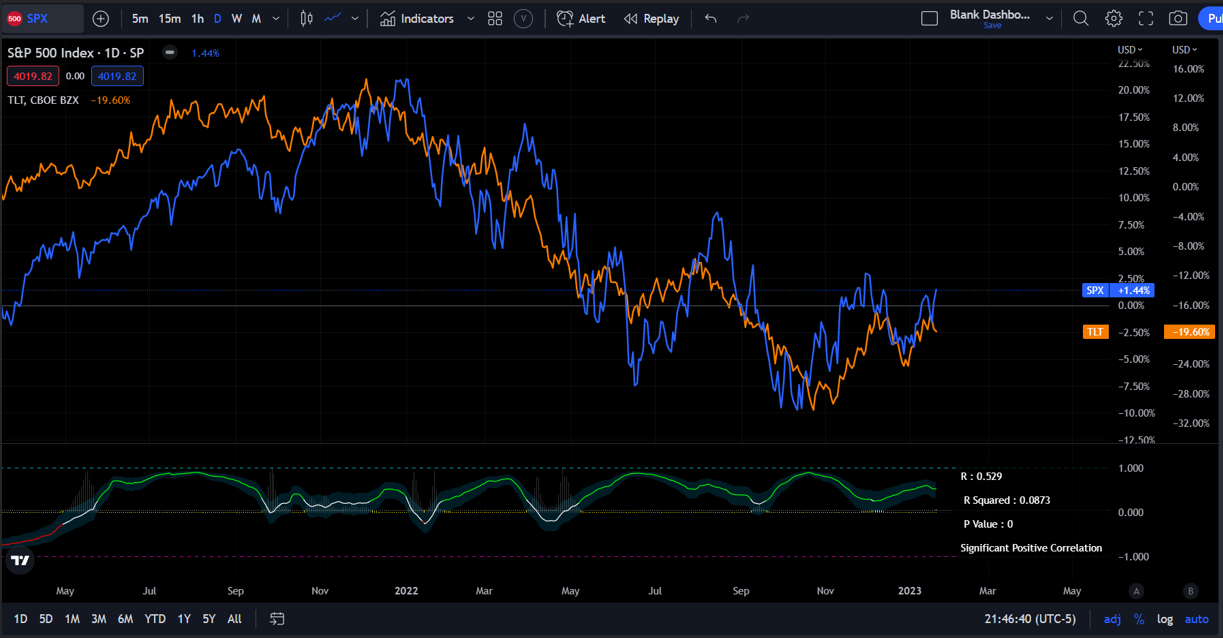
Bonds: Bonds sold off in tandem with equities during 2022 because of the elevated inflation and tightening monetary policy. During stagflationary regimes with tightening monetary policy, the stock-bond correlation is positive: https://papers.ssrn.com/sol3/papers.cfm?abstract_id=3075816
The question for bonds is about the persistence of monetary tightening and inflation. The stock-bond correlation is directly connected to the scenario analysis provided above. If scenario #1 unfolds, the correlation is likely to go negative. If scenario #2 unfolds, the correlation is likely to stay positive as stocks and bonds continue to sell off during an inflationary recession.
Right now, bonds are skewed to the upside until we begin to see a bottoming in inflation. As the FED holds the terminal rate flat, the falling inflation will exert upward pressure on bonds. The amplitude of a rally in bonds will be dependent on how deep inflation falls which in turn relates to the depth of a recession.
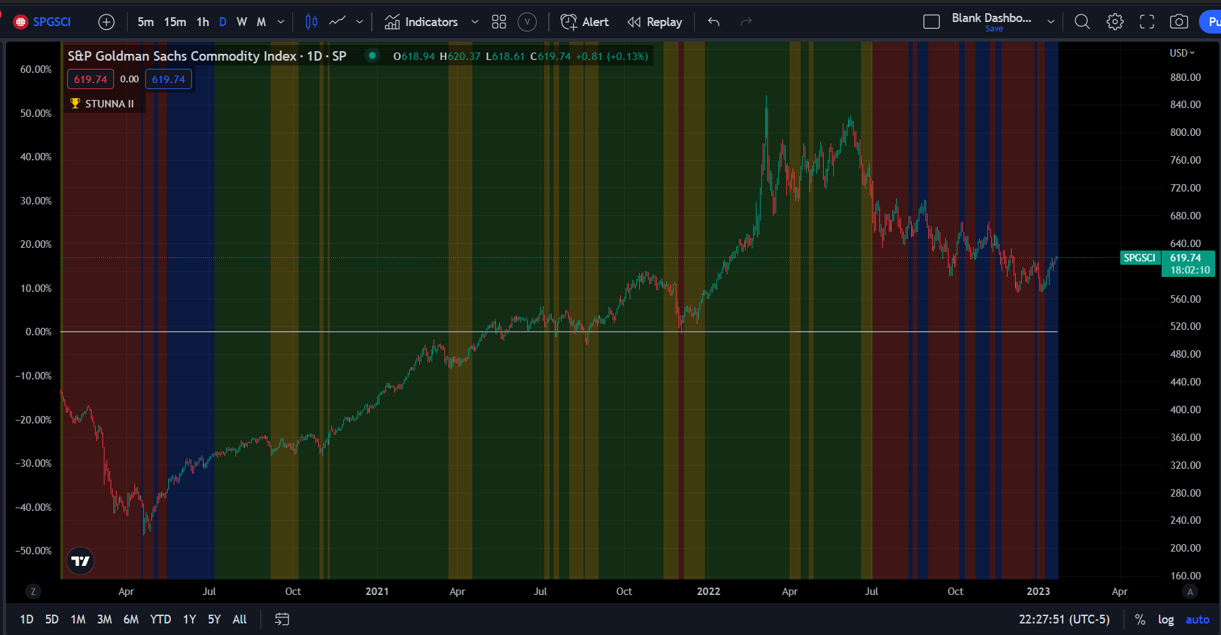
Commodities: Commodities are currently in a downtrend and likely to continue either chopping or trending down as growth deteriorates. With the demand side skewed to the downside, the primary reason commodities could rally would be a supply-side shock. This is entirely possible as evidenced by the Ukraine invasion. However, until a supply shock occurs, commodities are skewed to the downside.
Currencies: the strong dollar against almost all currencies during 2022 was primarily driven by monetary policy differentials. As we move into 2023, we are likely to see a wider distribution in the performance of various currencies against the dollar.
The dollar is skewed to the downside in the short term until recession occurs when investors flee to save haven assets, or the FED has to start hiking again.
Trades:
The primary short-term trade (initial duration 2-3 months) is going long bonds.
Long the 2-year via futures or SHY:
And going long 10-year or 30-year bonds via futures or IEF/TLT: However, the long end could have some type of marginal pullback.
The primary catalyst for bonds is FOMC at the beginning of February. The key signal to watch for is if the positive stock-bond correlation begins to break down. We have already seen a marginal break in the stock-bond correlation during some market opens and closes over the past week but we need a clearer signal.
As always, please keep all information private. I am happy to add people on a referral basis but would like to know who my readers are. Thanks!
Be well!


