Macro Report/Insights: Credit and Duration
What is the set up?
I recently shared a chart and people were asking a lot of questions about it so I wanted to take a moment and explain it.
The top panel of the chart has spreads between SOFR contracts. The bottom is the FRA-OIS and CDX indices. Basically, the top chart is showing how the market is pricing the forward curve of rate hikes/cuts and the bottom chart is showing credit risk.
If you really want to understand this in-depth, you need to take each instrument and do a deep dive into what it is. Just ask ChatGPT and it will provide a decent explanation.
Here is a tradingview link functionally showing the same chart: https://www.tradingview.com/chart/BYDB5FPx/
Why did I share this?
The initial spike you see in the chart is from the SVB banking crisis. When this occurred, credit spreads widened. As a result, the forward curve priced fewer rate hikes which in turn caused the yield curve to steepen. What we saw was an inverse relationship between credit risk and how expectations surrounding monetary policy were being priced.
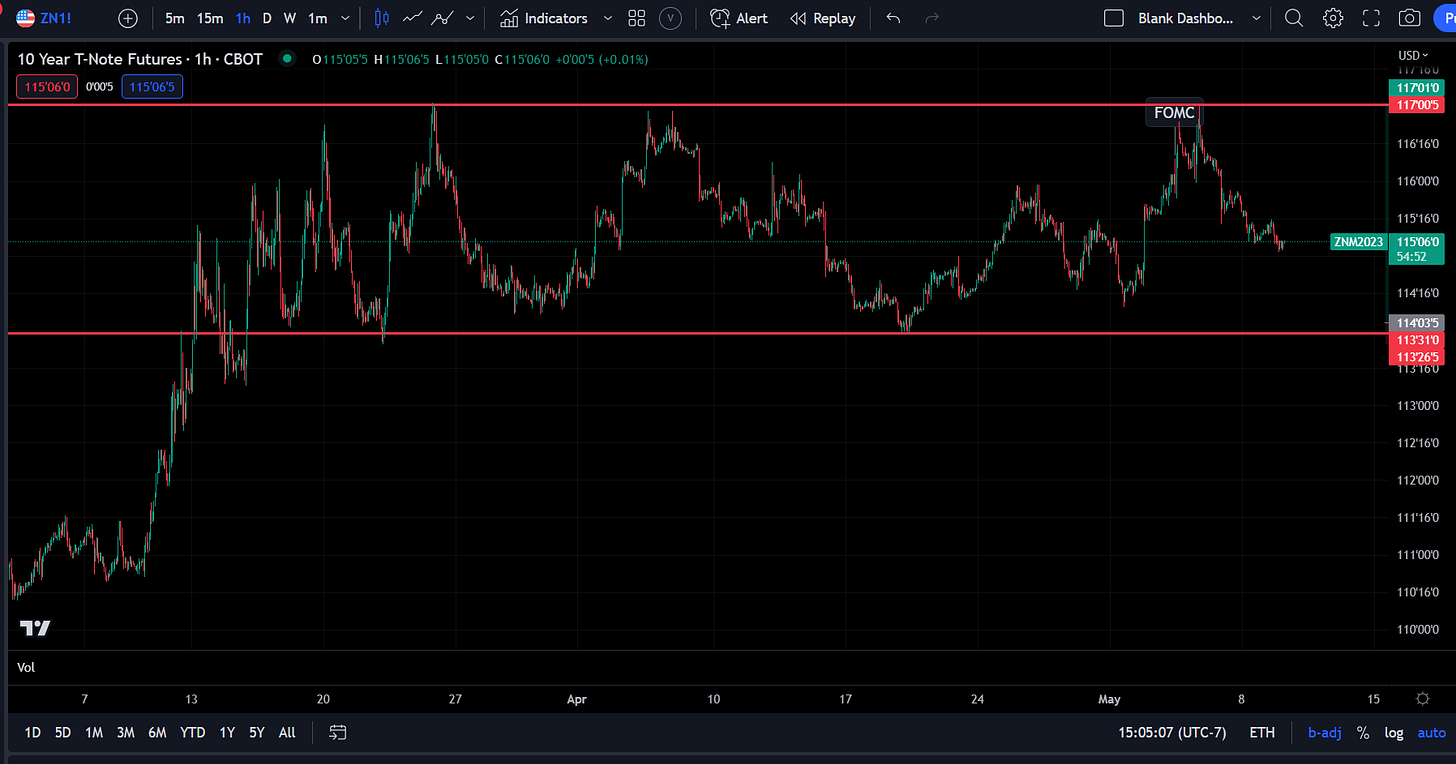
Right now we are in a situation where core inflation is elevated but we haven’t entered a recession yet. However, given the negative liquidity impulse from the yield curve being inverted, things are blowing up (like SVB). Therefore, the price action in bonds has been oscillating in a range.
Bonds have been mean reverting in this range as either growth and inflation surprises to the upside (think the NFP number last week) or credit risk spikes causing a bid in bonds.
As we enter into the end of the year, I am watching how growth and inflation data come out because it will impact how the forward curve prices cuts/hikes. Additionally, I will be watching credit risk because any expansion in credit spreads is likely to cause a bid in bonds.
In sum, we have two competing variables exerting causal force on bonds: growth/inflation data releases and credit risk. There is a bit more that goes into this but this is a good explanation of the chart and where we are in the cycle.
Conclusion:
You need to be sure to watch how the market prices information as it comes out. Watch data releases and the forward curve. You can watch the forward curve on Tradingview or the CME Tool: https://www.cmegroup.com/tools-information/quikstrike/treasury-watch.html
Thanks for reading!


thank you very much for changing the trading view chart setup! I have been playing around with it a bit and I find that HYG/IEF is a slightly better stand in for the HY CDX index. At least in my opinion, Im also curious as to why you added vix onto the bottom panel as opposed to MOVE? Thank you again for sharing all of your great insights