Macro Report/Insights: FX, Rates, S&P500 and Bitcoin
What you need to know about the coming inflection point
Hey everyone,
I hope you had a great weekend!
As all of you know, during the 2021 bull market we went to extremes in everything. Stocks, bonds, currencies, and commodities all went to extremes. This caused many “market experts” to say that macro was dead. The delusion of people to believe that the FED’s QE mutes the business cycle was laughable. As we moved into 2022, FX and bond volatility came back with a vengeance showing that if you ignore macro inflection points, your 60/40 portfolio will get destroyed.
I believe we are at another macro-inflection point where bond, equity, and FX volatility will begin exerting its force. However, the flows and correlations will be different from 2022 which will confuse most people.
Side note: I am continuing to transition the majority of research behind a paywall for paid subscribers. I am sharing the alpha trades and in-depth research I am running with paid subscribers. An overview of the direction I am taking things can be found in the pinned article (link). I will be rolling out a lot more analysis on macro flows and option flows soon. My goal is to make this Substack a place where you can continually come to read a synthesis of information for strategic action.
“In the information age, you simply need to be at the right place, at the right time, with the right information to succeed”
Let’s get right into it!
The Big Picture:
We are in the process of a regime shift where a negative growth impulse is likely to become the dominant factor driving asset prices, as opposed to inflation. This inflection point is likely to show considerable discontinuity from 2000 and 2008, given the level of inflation. Managing this inflection point will be the most important task for traders and businesses over the next 18 months.
There has been clear and explicit complacency surrounding the time lag of monetary policy. This is expected given how time lags in complex systems cause divergences in expectations and positioning. If and when we experience an inflection point driven by the macro regime, it will be reflected across all assets. This write-up will provide the interpretive framework for major assets.
Summary of Structure:
Economic Data
Rates
FX
Equities, Credit, and Crypto
Economic Data:
Economic data across the world is poised for a pronounced deterioration, given the existing preconditions. China has already begun to cut rates due to the deterioration of its economy, which is causing the Dollar to rally against the Yuan.
This dynamic is likely to persist:
Eurozone PMIs, both in manufacturing and services, are showing a pronounced move to the downside as they surprise expectations:
Here is the composite for France:
Here is the composite for Germany:
And here is the composite for the Eurozone:
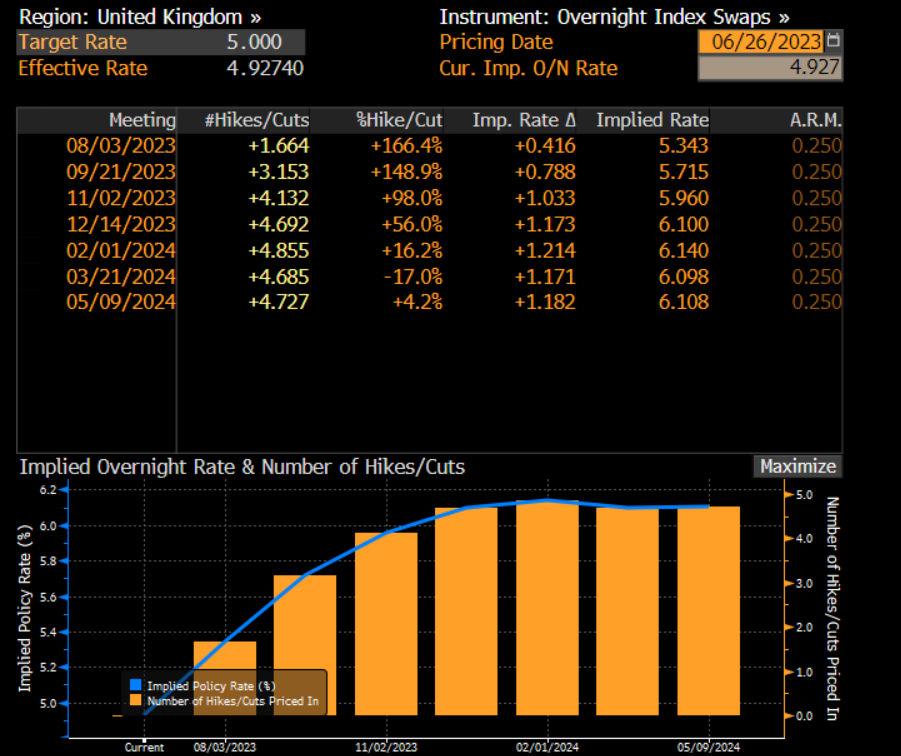
The key thing to note here is that it's BOTH manufacturing and services showing this trend. Previously, we saw divergences between the goods and service sectors in 2022. For a considerable deterioration in overall growth to occur, we need to see both goods and services deteriorate as the labor market weakens. This slowing in both goods and services is coinciding with aggressive tightening by global central banks, especially from the BoE and ECB. The BoE just surprised expectations with a 50bps hike instead of the expected 25bps.
Additionally, we are seeing initial claims tick up just as the Fed's dot plot has been revised higher. Now, Powell is talking about two more rate hikes:
What we are witnessing is a final push of central bank hawkishness as growth data deteriorates and global yield curves have inverted to extremes. This extreme action by central banks is juxtaposed with unrealistic expectations priced into financial markets regarding the probability of a recession, credit risk, and dollar liquidity. These factors create the preconditions for significant volatility across all assets, driven by a macro regime inflection point.
If you want to read more on this, see the macro reports I have written: link and link
Rates:
When we examine the inflation picture, the "hawkish skip" by the Fed at the most recent FOMC has allowed the Fed funds rate to remain just below core CPI. The chart below shows the core CPI data (blue), expectations of core CPI (purple), core PCE data (orange), expectations of core PCE (yellow), and the 1-year OIS swap:
What we can observe is that the July meeting is pricing in a 25bps increase, with a marginal probability of hikes occurring in the two subsequent FOMC meetings:
A rate hike in July is very likely. We don’t have a meeting in August, and the possibility of a rate hike in the September FOMC meeting is currently a toss-up, pending additional data. However, when we look at the big picture, this is likely the final push in hawkishness that the Fed will make before an “official pause.”
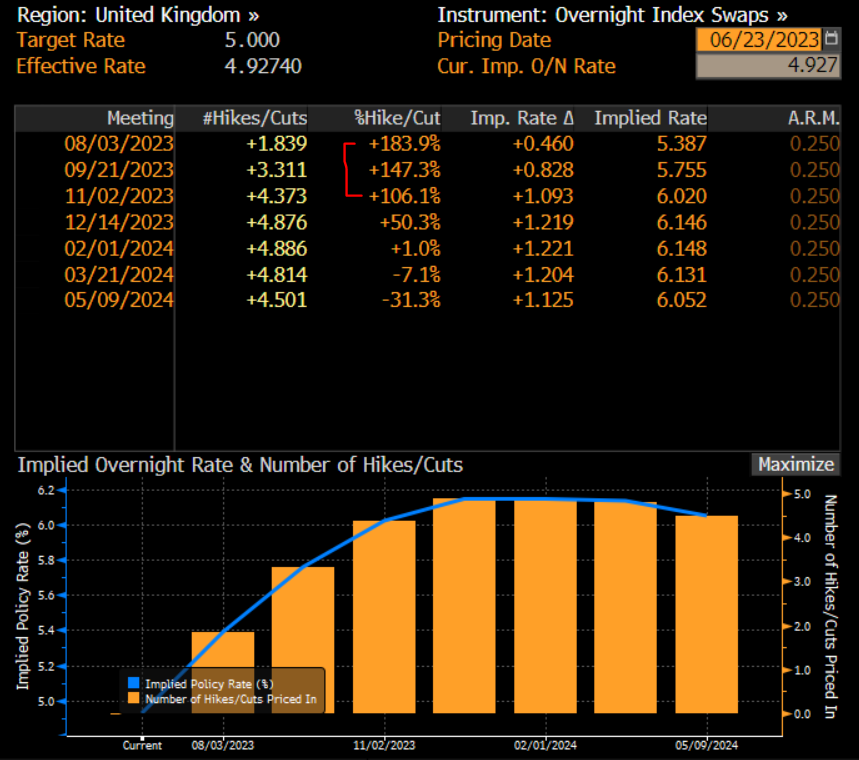
Since the inflation problem in the UK and Eurozone is significantly worse than in the US, the BoE and ECB have taken a stronger stance than the Fed. When we examine the forward curves of the ECB and BoE, they are pricing in a much higher certainty of rate hikes over the next three months:
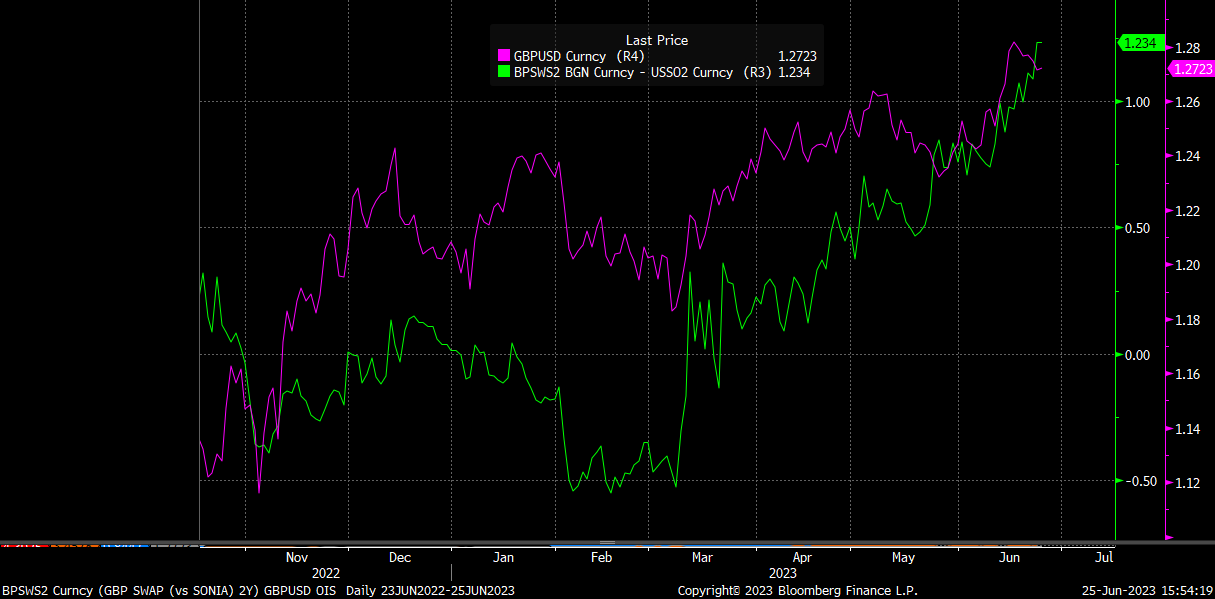
This dynamic of relative hawkishness, as it relates to the inflation differential, has been the primary driver of FX YTD.
On a larger scale, global bond markets are moving in lockstep as central banks tighten due to the level of inflation. However, as we transition into a period of negative growth, it is likely that we'll begin to see divergences in both rates and FX as relative growth and credit differentials become the primary drivers of flows and correlations.
Final Note on Rates:
I believe we are in the final stages of reaching a peak in rates.
Since the market is already pricing in a significant degree of certainty around a hike in July, it's likely that the subsequent rate hike will either be the final one, or its absence will signify an 'official pause.'
The market is already reflecting this dynamic as the spot yield curve has fallen lower than the 3-month, 6-month, and 1-year forward yield curves:
FX:
This context in rates directly correlates with FX flows. While monetary policy differentials have been the primary driver of FX YTD, there are some key factors to note as it relates to dollar liquidity.
First, just because monetary policy differentials are driving FX, it doesn’t necessarily mean there is a liquidity crunch for a specific currency in the system. For instance, the chart below shows EUR/USD (blue), 1-year OIS differentials between the ECB and Fed, and cross-currency basis swaps (XCCY) for EUR/USD (white). The cross-currency basis swaps illustrate what the OIS differentials don’t show - a demand or 'liquidity crunch' for dollars. For example, notice in March of 2023, cross-currency basis swaps moved down as the SVB crisis caused a demand for dollars.
(If you want to follow someone who provides exceptional explanations surrounding cross-currency basis swaps and the plumbing of the system, Subscribe to Concoda . He is one of the smartest guys I know on the subject).
Notice that the XCCY has risen over the past couple of weeks, indicating that there isn’t currently a dollar shortage or a dollar liquidity problem. This has confused many market participants as we see strong dollar days while risk assets are rallying.
Looking at the big picture, I am closely monitoring both monetary policy differentials (along with inflation data releases) and credit risk differentials (alongside growth data releases) as we approach the end of the year. I want to see XCCY indicate a demand for dollars as credit risk spikes on poor growth data. This is likely what will cause FX volatility to pick back up.
For example, here's a chart of the EURUSD XCCY and EURUSD implied volatility (inverted). What we can observe is that implied volatility moved in lockstep with XCCY as the demand for dollars fluctuated.
Observe the most recent period where FX implied volatility fell considerably (remember, implied volatility above is inverted) as the XCCY rallied. This indicates that we aren't experiencing dollar liquidity issues yet. These conditions have partly contributed to a divergence between credit risk and monetary tightening. Observe the same chart below, but with an added panel showing the 1-year OIS swap (in purple, representing monetary policy) and BBB credit spreads (green). Monetary policy has tightened further, but credit risk hasn't spiked:
During the SVB crisis and in the weeks following it, we saw monetary policy expectations move inversely to credit risk. However, we are now in a situation where monetary policy has tightened, but it hasn’t caused credit risk to spike. This divergence is likely due to the dollar liquidity (as reflected by XCCY) in the system and the fact that we are only just beginning to see deterioration in the labor market.
So what does all of this pragmatically mean? It means that because we haven't experienced a shortage of dollars yet, risk assets have been able to rally and credit spreads have remained low. This has created a situation where the Fed has been able to make a final hawkish push while the S&P 500 has rallied to YTD highs. In essence, equities are pricing in a highly optimistic outlook and bonds aren't factoring in any sort of recession. The importance of correctly quantifying these ideas and performing the attribution analysis for price action is to ensure that we have a clear signal for when this changes as we move into the end of the year.
Several final FX observations:
GBPUSD:
Here we have the 2-year OIS spread between the UK and the US (in green) alongside GBPUSD (in purple). Since the UK has a more significant 'inflation problem' than the US, the BoE has been tightening more aggressively than the Fed. This has led to a considerable rally of the Pound against the Dollar.
However, it is likely we are at some type of inflection point for the Pound since the majority of hikes are priced across the curve and GBPUSD just sold off on a surprise 50bps hike:
Additionally, we're observing implied volatility consolidate and spike marginally during the pullback. This will be a crucial signal to monitor moving forward:
USDJPY:
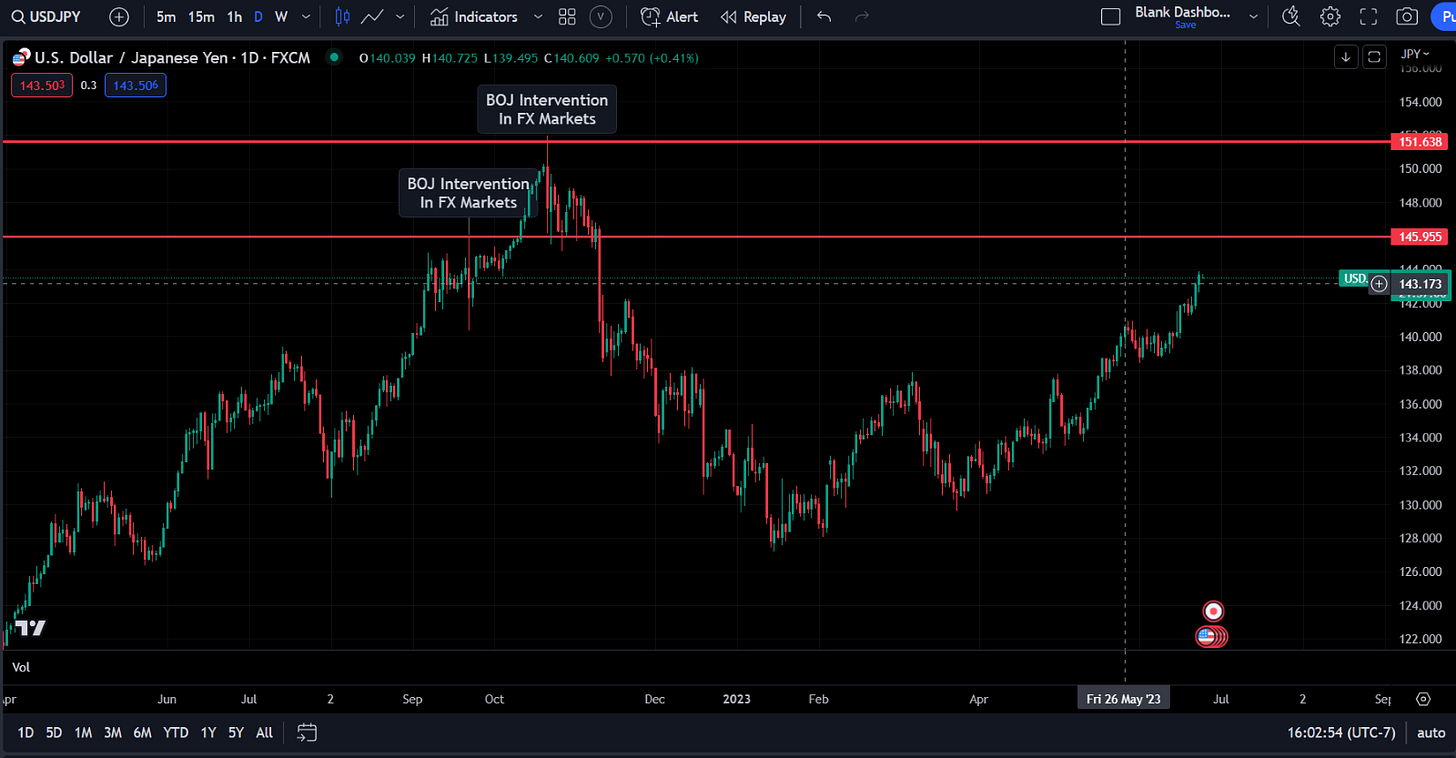
The USDJPY pair is returning to the levels where the BoJ intervened in currency markets. These levels will be important to monitor for flows into US bonds:
We are beginning to see implied vol (blue) spike marginally as we approach these levels in USDJPY (white):
AUDUSD and AUDJPY:
The Aussie dollar continues to move in lockstep with risk on/risk off flows:
The RBA currently has more hikes priced across the curve compared to the FED:
This is part of the reason we've observed bullish price action in AUDUSD (blue) as OIS differentials widen (green). Monitoring AUDUSD XCCY in conjunction with OIS spreads will be vital as we move into the end of the year. Keeping an eye on AUDUSD and AUDJPY along with these metrics will be crucial for interpreting risk-on/risk-off flows in stocks.
USDCAD:
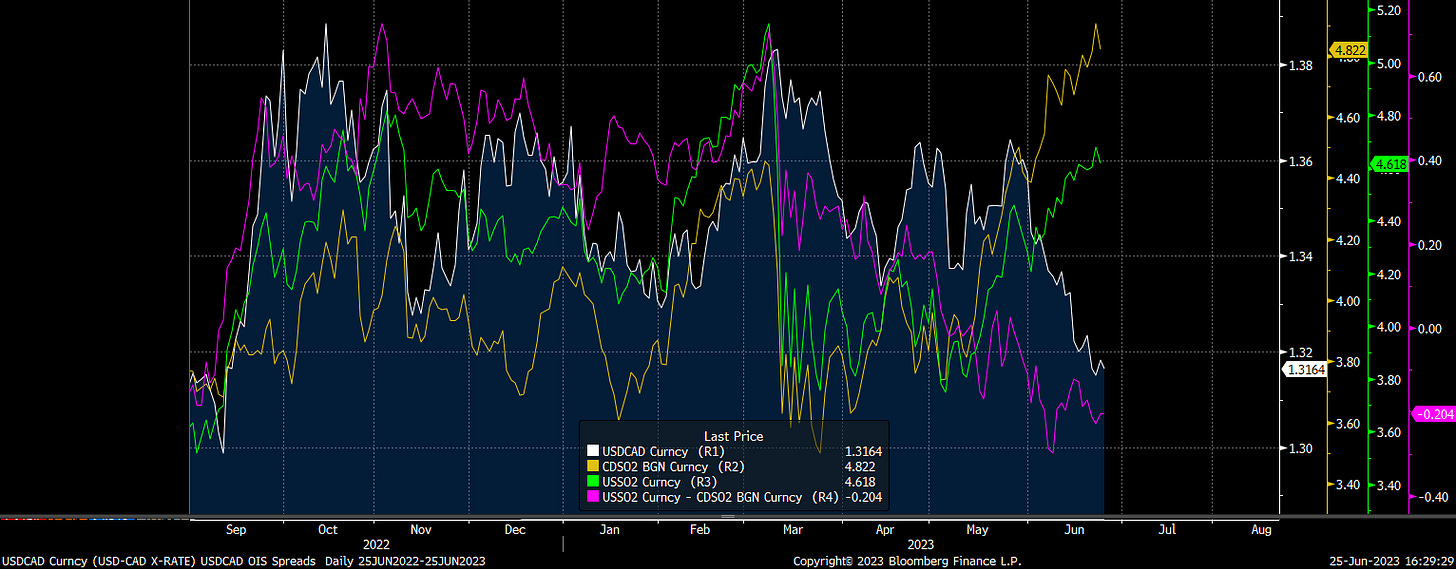
Monetary policy differentials are continuing to drive USDCAD. We can observe the OIS spread (purple) consolidating at this point:
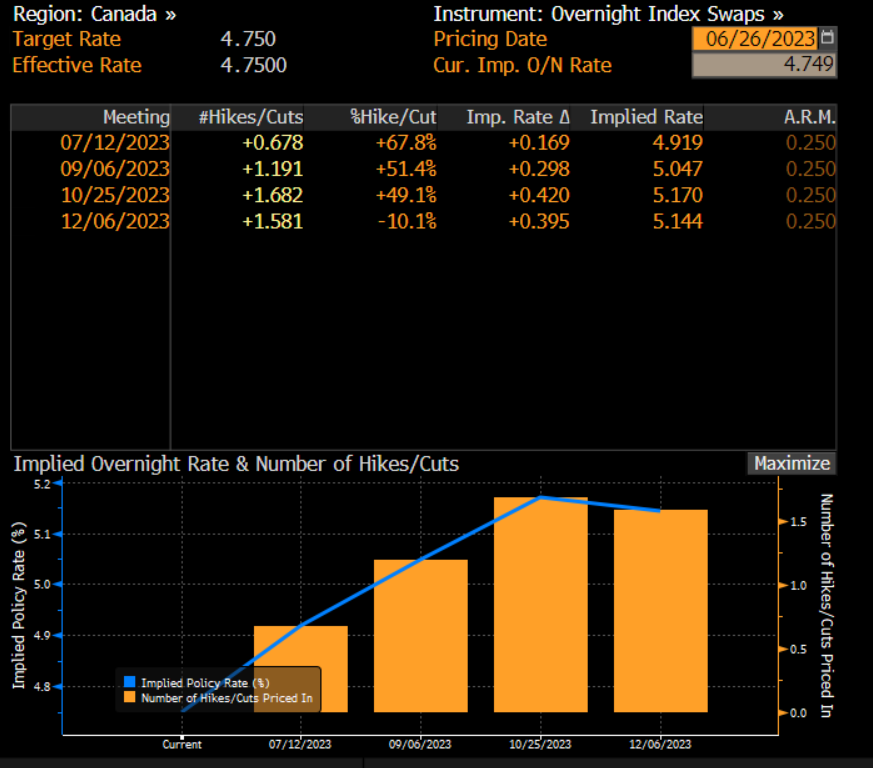
Canada's forward curve has rate hikes priced in for the next three meetings. It's crucial to remember that for the BoC and other central banks, the majority of their rate hikes are already priced in. The US, however, is NOT pricing in a high probability of a second rate hike yet. Moreover, the US curve is projecting rate cuts for 2024. Monitoring this divergence will be critical as the US and foreign central banks adjust their stances.
While the monetary policy differential is important for Canada, watching oil is key for interpreting divergences:
The bottom line is that across all major FX pairs, monetary policy differentials are currently the primary driver. We are not currently observing a dollar shortage or high implied FX volatility. However, given the points I've made about slowing growth, complacency in the monetary time lag, and complacency in positioning, the drivers of FX are likely to shift soon. This brings us to risk assets.
Equities, Credit, and Crypto:
Equities are currently in a vulnerable position as they price in optimistic growth and rely on the wave of short-term liquidity we have witnessed year-to-date.
The chart below illustrates the deviation of price from analysts' earnings expectations. Previous extremes in this deviation have typically been followed by some form of marginal pullback. The question arises regarding the persistence of the upcoming pullback. Will it hold fundamental significance or simply be a technical pullback that should be considered as a buying opportunity?
Understanding whether a move has fundamental significance or is merely a technical one requires conducting an attribution analysis on the drivers of price action. In simple terms, it involves identifying the various factors that contribute to price movement and assessing whether the macroeconomic backdrop supports the persistence of these drivers.
Monitoring the ES (E-mini S&P 500) in conjunction with the dollar liquidity metrics provided earlier will be crucial in determining the sustainability of any price move. As an example, below are the XCCYs for EUR, JPY, AUD, and GBP, with the ES overlaid in yellow:
When examining skew and the TDEX index (which reflects the cost of hedging against tail risks), we can observe that these indices spiked during the recent rally but are now retracting. In this environment, the crucial factor for implied volatility is to monitor whether a spike is driven by rising credit risk and falling dollar liquidity.
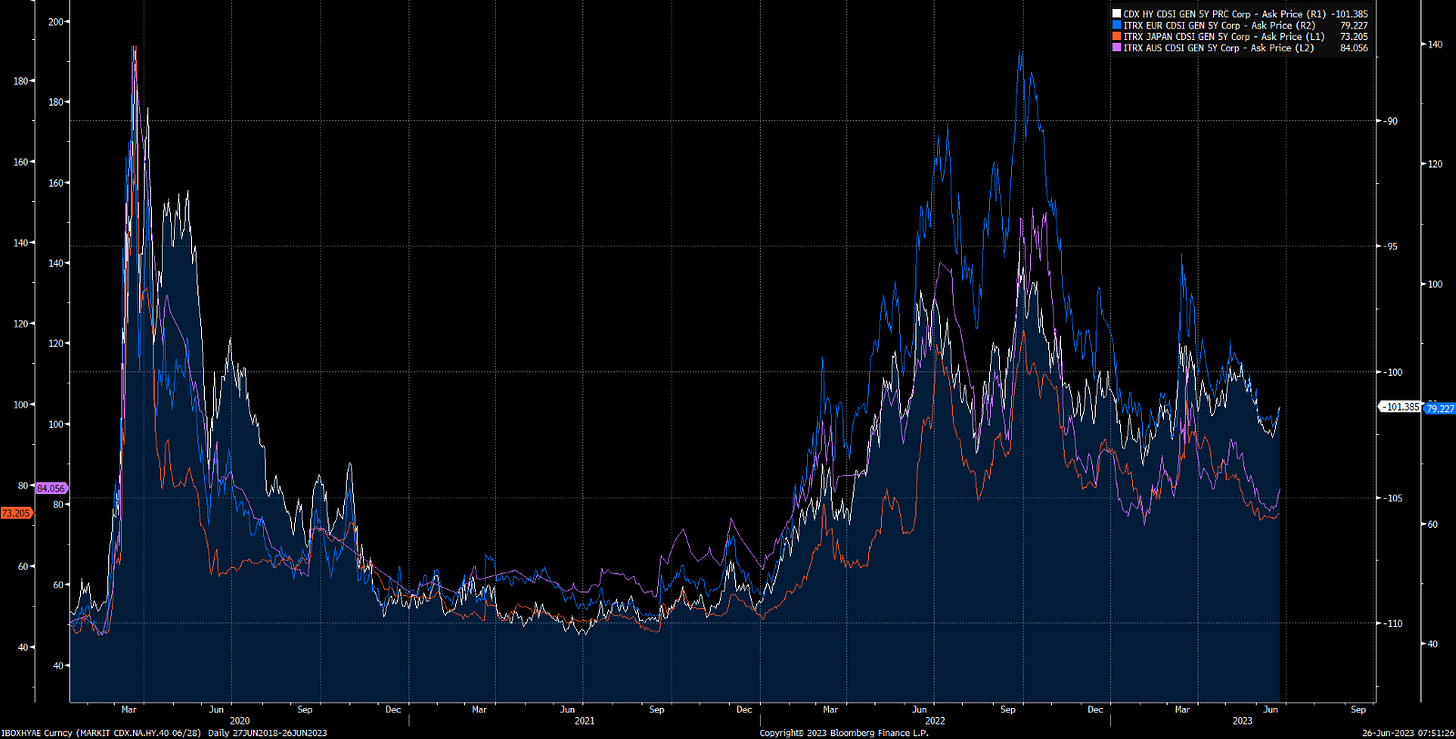
Here are the credit risk indices for the US, Europe, Japan, and Australia. Given the significantly elevated real rates in the face of slowing growth, it is highly probable that we will witness a pronounced increase in credit risk.
When it comes to crypto, there are two major ways to consider flows. First, we have the bottom-up drivers, such as adoption, use cases, or access for specific investors. Second, we have global macro liquidity, which is constantly changing and highly complex. News regarding a BlackRock ETF, for example, could certainly impact price action. However, this factor still needs to be compared to the macro liquidity side. In essence, it is essential for both factors to align for optimal risk-reward on any timeframe.
We know that a significant portion of the price action in crypto has been driven by real rates, as indicated by the inverted orange line:
However, many of the divergences we have observed from real rates can often be explained by the major cross-currency basis swaps (XCCYs). The chart below illustrates the Euro XCCY (white), Japan XCCY (blue), UK XCCY (purple), and BTC (yellow). Once again, it is important to note that for any asset denominated in dollars, its price action will be directly influenced by dollar liquidity constraints.
The question regarding BTC is whether any fundamental forces, such as the introduction of a BlackRock ETF, can exert enough influence on the price to counterbalance potential future dollar liquidity constraints.
Also, notice that the most recent rally in BTC overlapped with a rally in XCCYs across multiple currencies. How much of this rally is from the ETF announcement or from a short-term FX move is still unclear. Watching metrics such as GBTC/BTC is likely a better proxy for how much the market is pricing in the ETF announcement than the outright BTC price action.
TraderSZ has been sharing really helpful risk-reward analysis on BTC that I would recommend watching: https://twitter.com/trader1sz/status/1673269076888547329
Conclusion:
I believe we are in the process of a macro regime shift that will be reflected across ALL assets. This is likely to be reflected in the following ways:
Deteriorating economic data where negative growth becomes the dominant impulse in markets.
Rates are likely to move down as we approach the end of the hiking cycle and negative growth becomes the dominant impulse.
Dollar liquidity is likely to contract which will bring back FX volatility.
Equities, credit, and crypto are likely to exhibit risk-off behavior as we move into this regime.
Thank you for reading! The best is yet to come!
In the information age, you simply need to be at the right place, at the right time, with the right information to succeed
Referral: I have developed a referral option for Substack, granting you free access to the research articles I write exclusively for paid subscribers. Check it out here: link












Thank you for sharing. Cheers
I have noticed that the CAD $ moves in a pretty decent lock step with crude oil. In this article you highlight that to a degree. I’m just wondering what you think is causing the current divergence? Is it the OIS spread?