


The Starting Point Determines Clarity:
Saying we are in a bubble grossly underestimates the power of the underlying forces driving capital across global markets. False narratives diagnosing price action always set the stage for epic melt-ups and catastrophic melt-downs because uninformed market participants are forced to buy and sell at inopportune times.
Professional risk takers approach the future with humility by starting from first principles and ascertaining how they can add value to the liquidity process that dynamically unfolds. Starting from first principles instead of starting with narratives produces dramatically different outcomes and is what differentiates those who make asymmetric returns on the credit cycle melt UP and melt DOWN.
This report will explain WHAT the unique drivers of the current credit cycle are, WHY they matter for global financial markets, HOW the drivers are directly connected to specific markets, and then give you all of the models (the actual code) to monitor these flows in real time.
Macro Context:
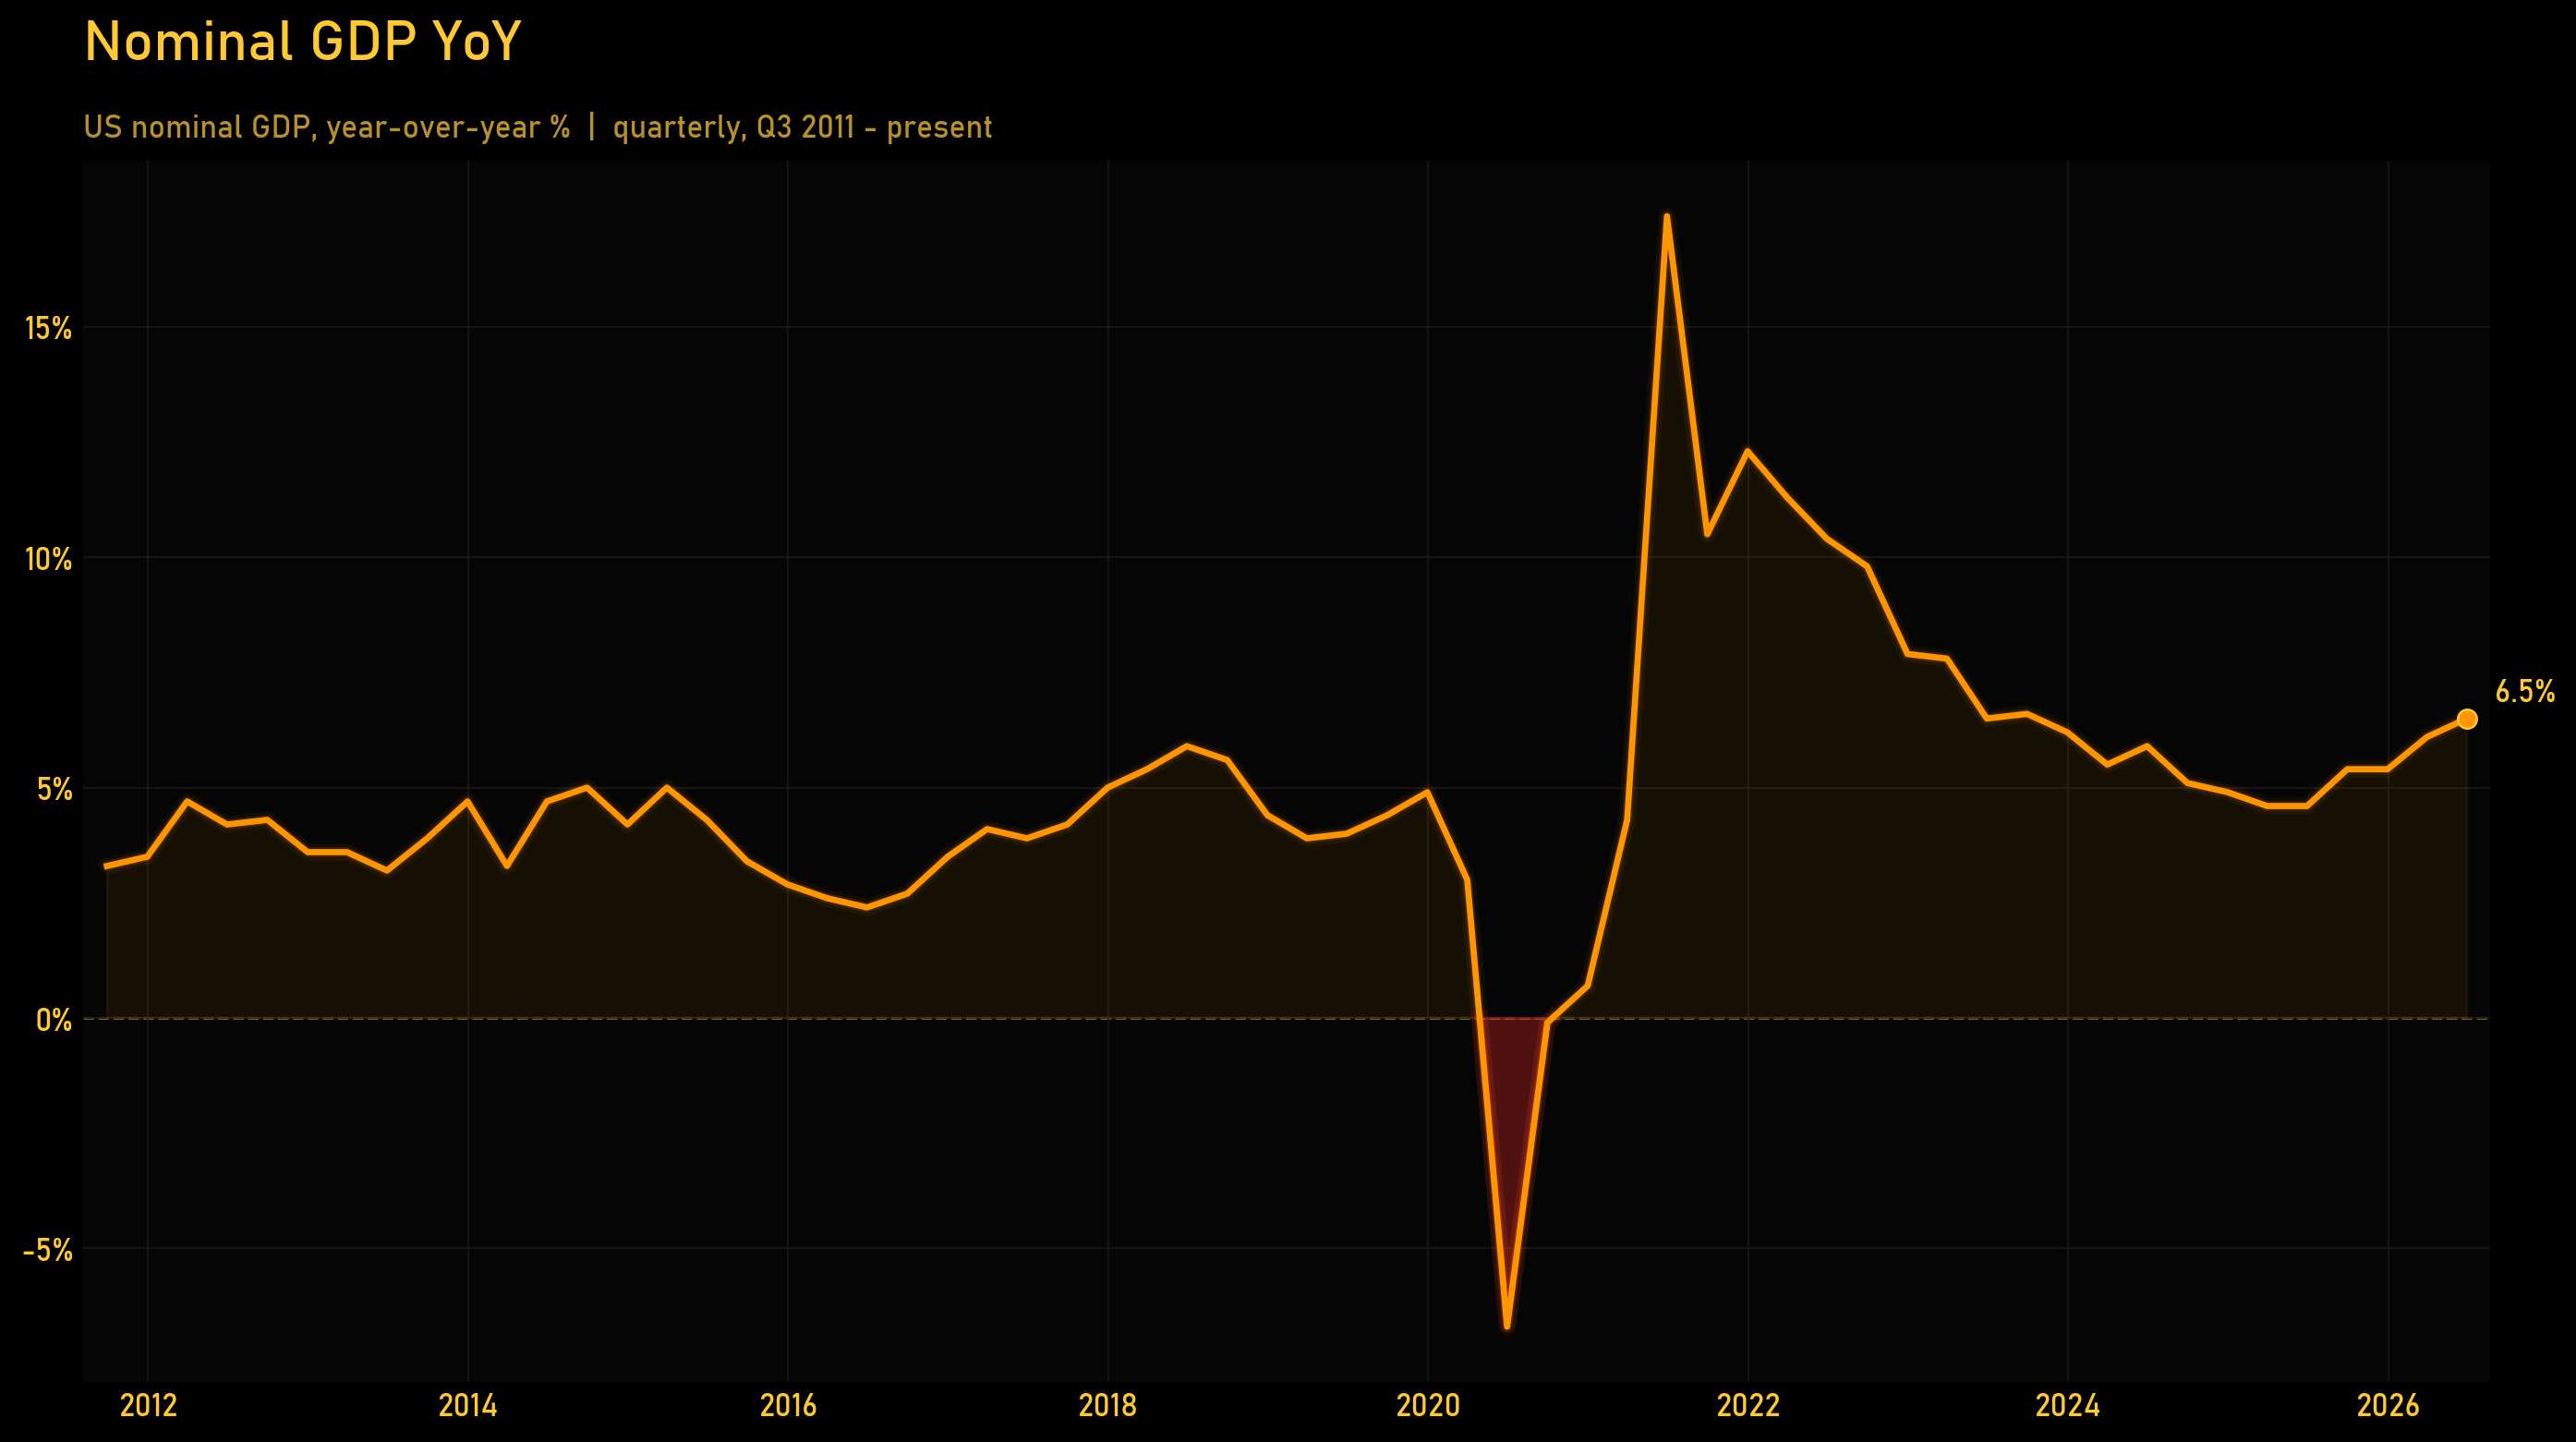
Let’s start with the big picture to frame the underlying drivers for WHAT is happening. First, nominal GDP is running at 6.5%, which is incredibly high relative to recent history. This acceleration to a higher level of nominal GDP is WHY long-term interest rates have been rising.
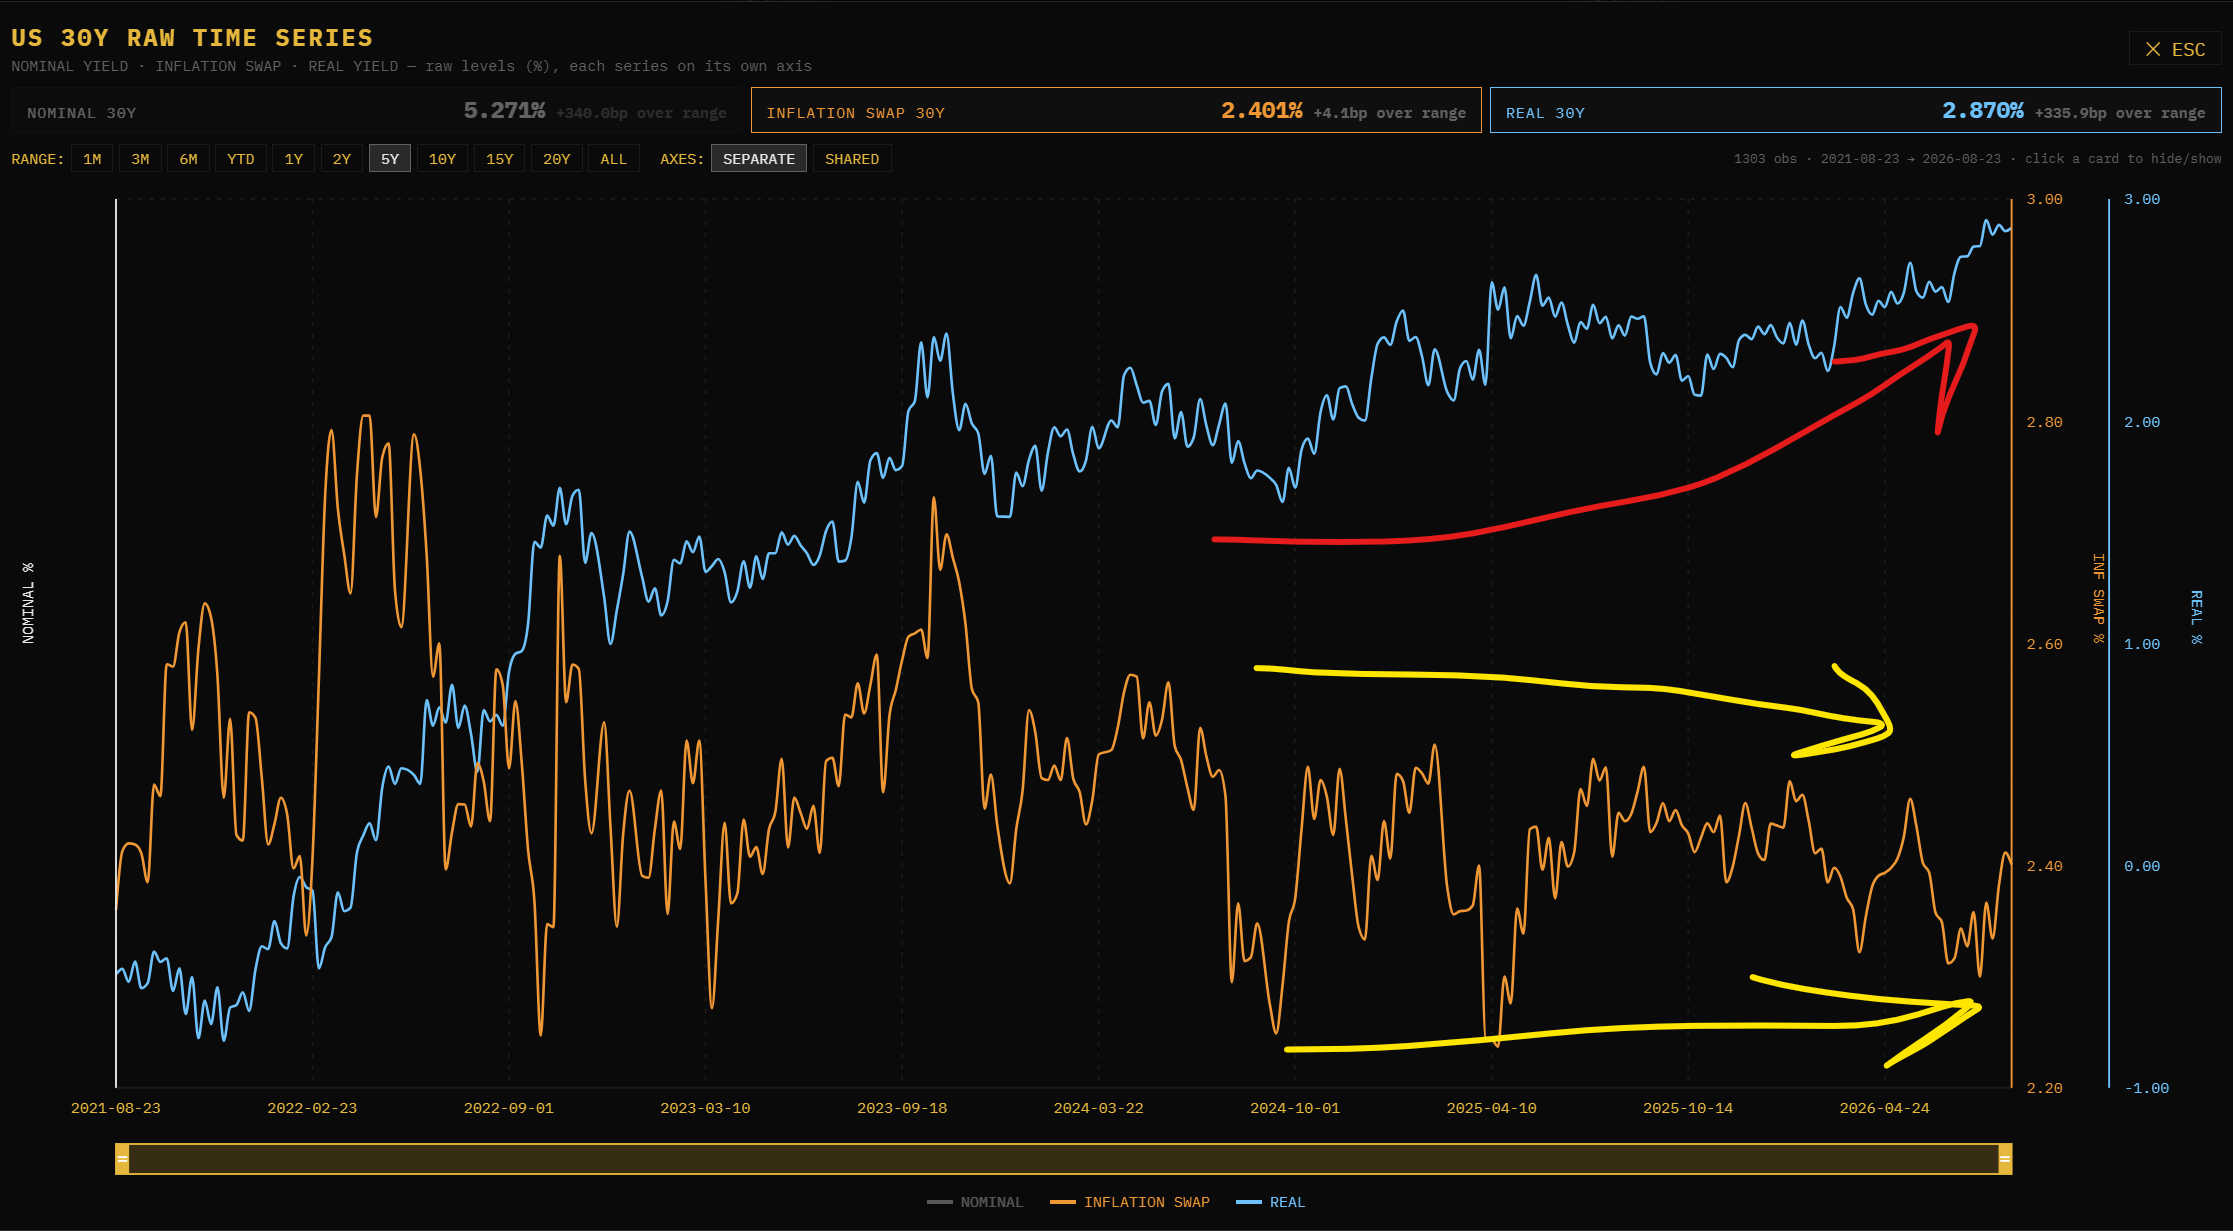
You will notice that even during the oil shock earlier this year, long-term inflation swaps remained in their range, and real rates have been the primary driver of higher nominal yields in the 30-year. This is because growth and term premia, not inflation expectations, are what have been pushing long-end rates higher.
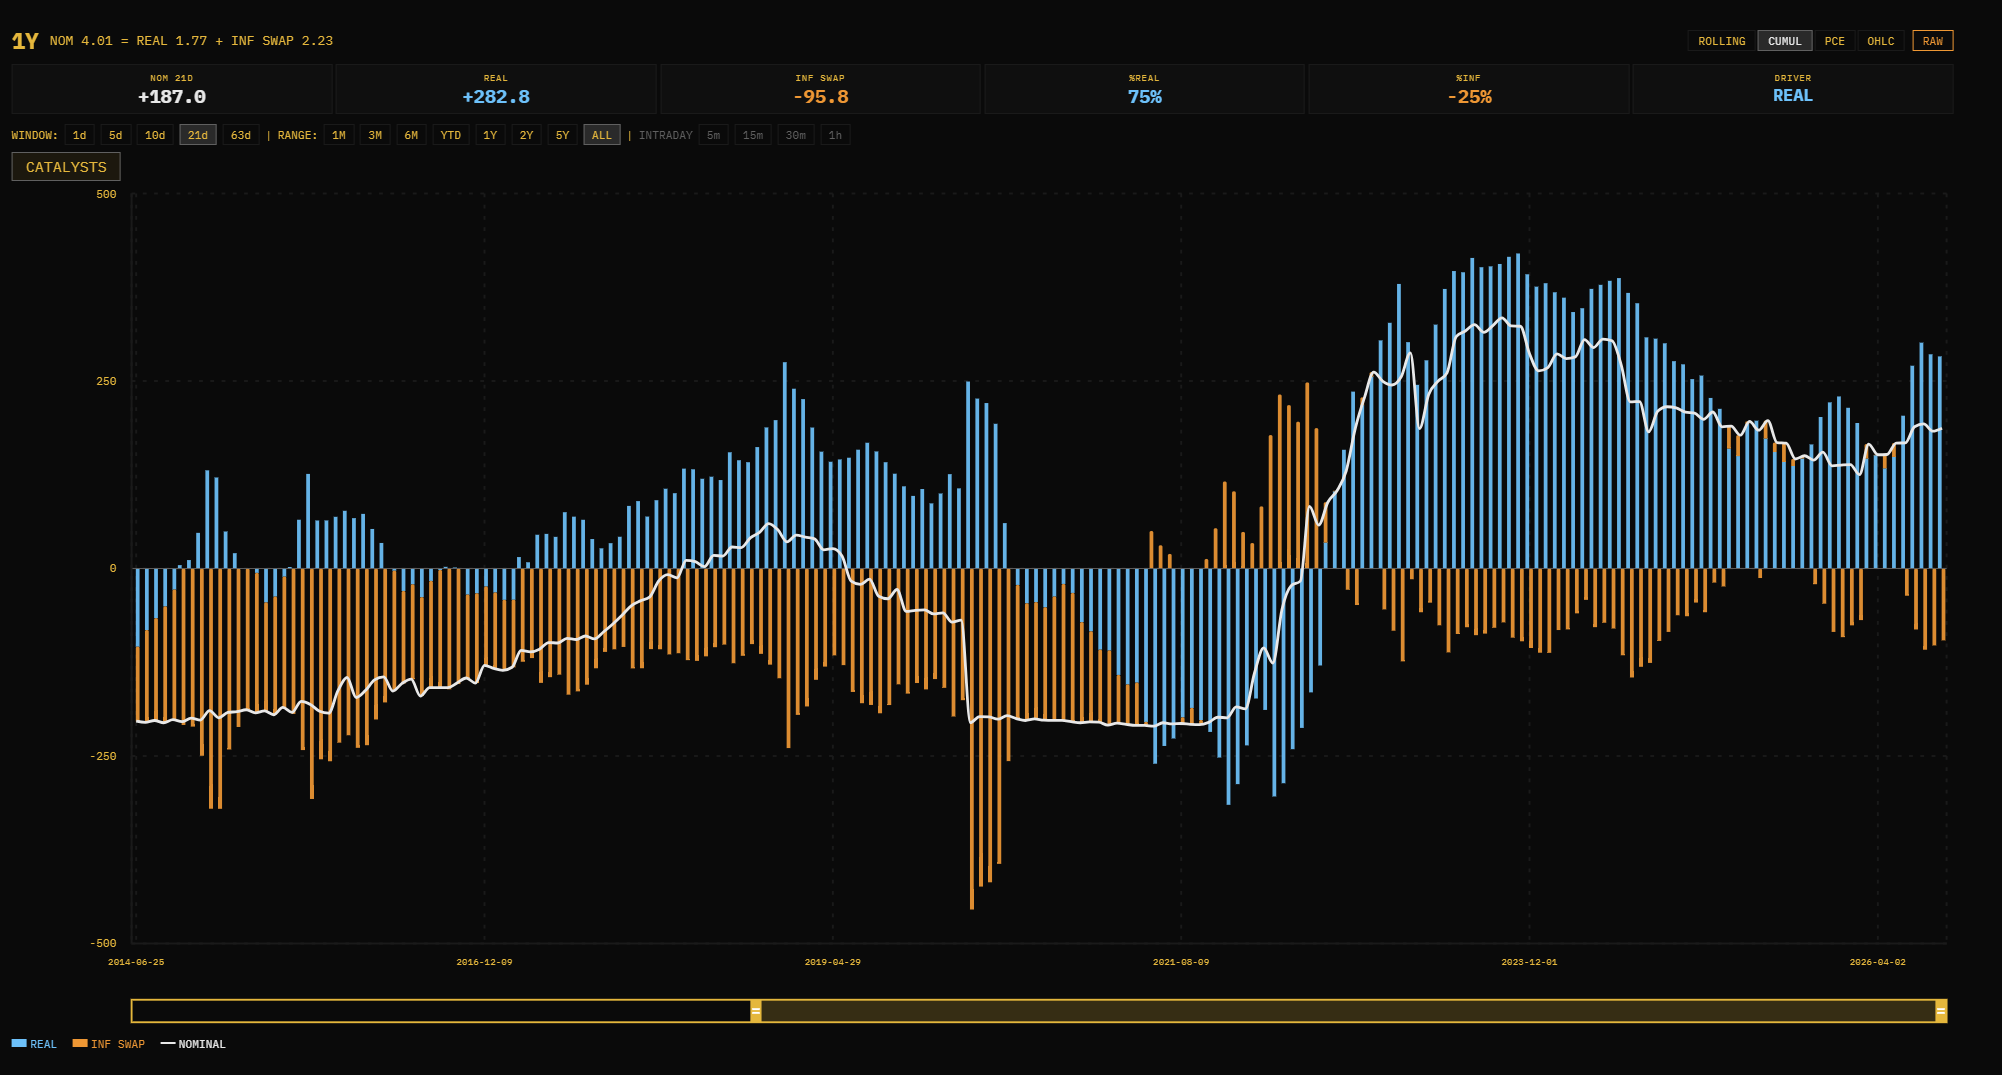
Long-end rates are pointing to the fact that there is a lot more driving interest rates than short-term inflation expectations; it is about the strength and breadth of underlying growth. Notice in the chart below, which shows 1-year nominal rates, that the Fed is holding rates ABOVE inflation. The blue bars visualize when real rates are driving the short end vs inflation expectations (orange). Historically, when the Fed begins widening the spread between nominal rates and inflation, it is trying to take a more restrictive stance. Simply put, if there is a ton of growth in the economy, even if inflation is falling, the Fed does not need to cut rates.
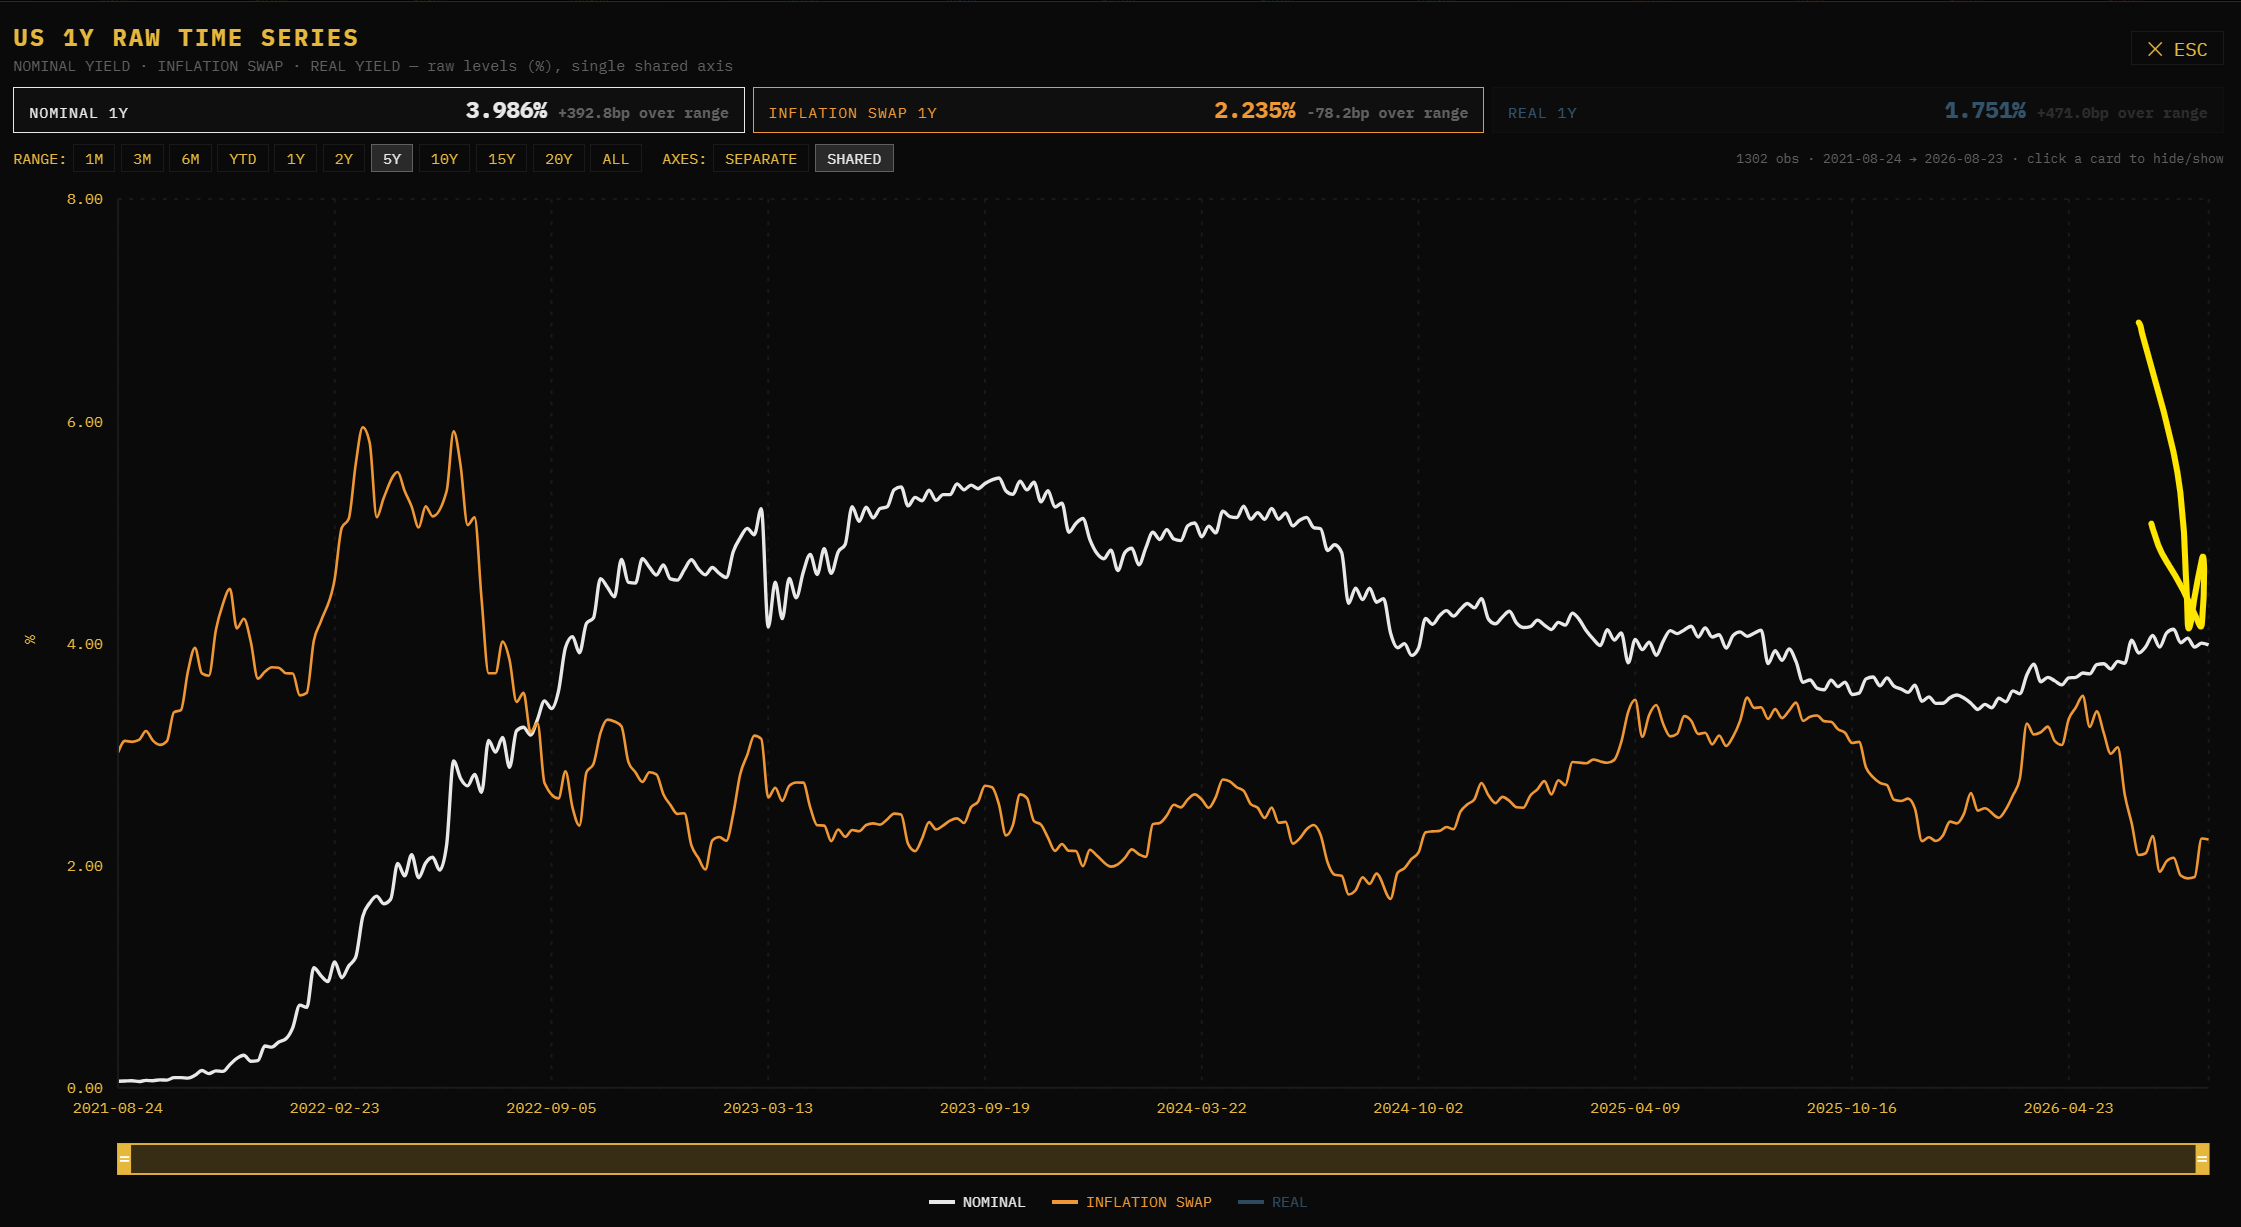
The more growth there is in the system, the higher the Fed can hold short-end rates (white) above inflation expectations (orange). The risk in the system is that if growth decelerates and the Fed pauses, this can create a liquidity gap in markets that pushes the highest-beta equities down. This is why the 2nd derivative of growth in both economic data and stock fundamentals has such a heightened significance right now. Smaller changes can have a larger effect due to the compressing spring in macro liquidity.
The question is: WHERE is all of this growth coming from that is allowing the Fed to hold rates above inflation? And how much of it is real GDP vs inflation? If we can understand this, then we can begin to break down the drivers of interest rates and the sustainability of macro liquidity in the current credit cycle (see previous report providing geopolitical context here: LINK).