Model for Markets
Markets connecting to economic data
Alright, let’s get right into it!
For all the new subscribers, we are doing a series of articles breaking down the basics of what you need to know in markets.
Here was the first laying out the path forward:
And then here is the country analysis (link) and economic data (link).
Now we move to asset markets.
Asset Market: Here are the bullet points we will be going over
Fundamentals connecting to economic data
Equities
Earnings, Valuations and cross-sectional fundamentals.
Factors connecting to the regime
Fixed Income
Connecting to credit risk
STIR, bills, notes, bonds
Commodities
FX
FX Model: BoP, cross-border flows, reserves.
FX forwards
XCCY
These are the main things I think about:
Expectations vs Actual:
- Economic Surprise Indices
- MoM extrapolation, 3 Month Trend.
- Earnings Surprise
- EPS, Sales
- Economic Mechanics/Structural Dynamics Set Probable Distribution/Skew for Expectations vs actual.
Now let’s go one by one:
I already went over economic data so let’s say you have built models to monitor all economic data in a country. You then need to connect this to asset markets.
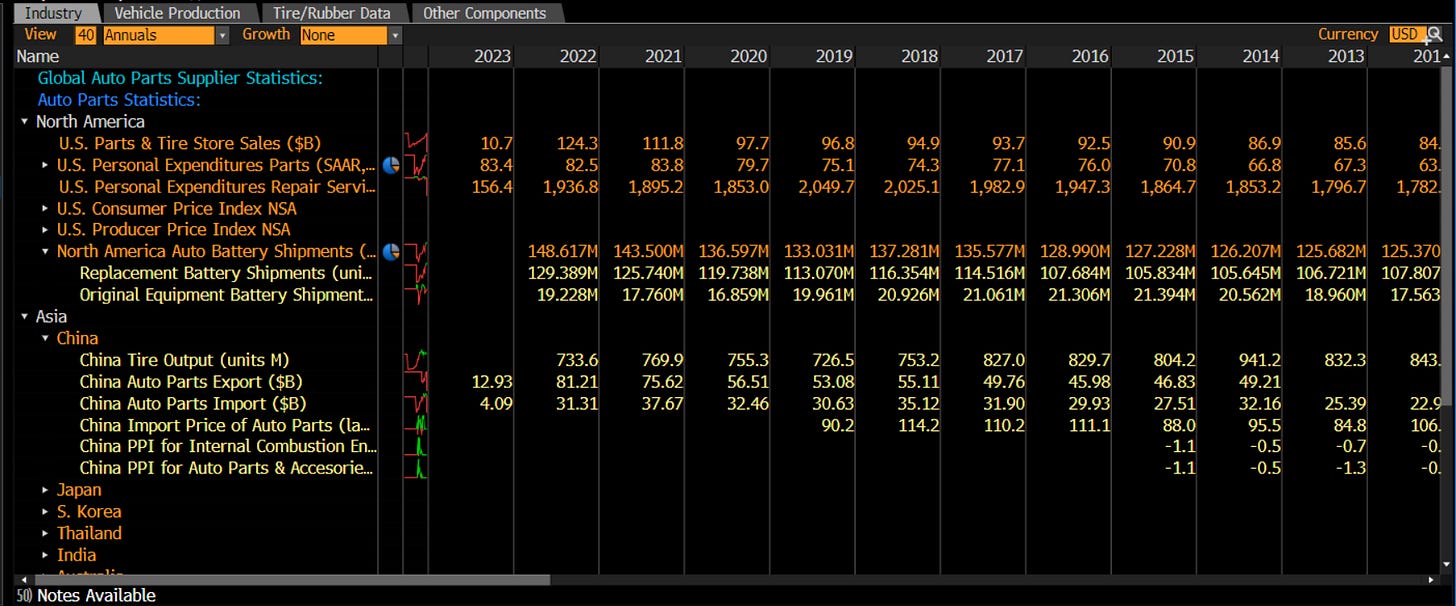
For example, if we are looking at auto stocks, you want to connect it to the auto economic data:
Same thing with retail:
You then want to aggregate assets by their respective sector and sensitivities. For example, if you have retail sales, you want to look at all retail stocks. If we have inflation data, you want to focus on bonds. If we have industrial production you probably want to look at…….industrials! This is not rocket science.
The main idea is to have a comprehensive view of every asset in the market as it connects with a comprehensive view of the economic data.
Equities:
Broadly speaking, you need to think about equities in several different ways:
First, earnings and valuation functions: for earnings you want to look at the TTM or most recent earnings, earnings expectations, and if the earnings releases come in above or below expectations. Valuations are primarily going to be a function of liquidity but there can be other things moving valuations. Always ask, if the valuation function or the earnings function moving this sector/stock? All of 2022 the main driver of the bear market was valuation contraction, NOT earnings revisions. This was key and will be important for this year!
Second, you want to look at all of these data points across all sectors because different sectors outperform/underperform depending on the macro regime we are in. So you want to look at cross-sectional (just means relative) fundamentals and cross-sectional momentum (or returns). Relative relationships send you a signal just as much as absolute levels.
Here are all the major S&P sectors that you are going to want to watch: their tickers are in Tradingview as well.
Here is a list:
Third, you are going to want to look at factor exposure and returns in equities. A really good book on this is Strategic Risk Management:
Here is the PDF of the book! I got you guys!
Once you have an idea of how all the different sector returns work as economic data is released and how different factor performances work in different regimes, you can then have a much clearer understanding of what the market is pricing in on a macro and even intraday basis.
Fixed Income
I did a tweet with some excellent books on Fixed Income:
And then Credit from Macro to Micro shared some book recommendations. I would definitely follow this guy's Substack and Twitter. He has been incredibly generous with his knowledge which is rare!
Fixed Income, especially the short-term interest rate market is one of the most important things you can know when trading markets.
The two main things you always want to know are: 1) What is happening with duration and 2) What is happening with credit?
If all bonds are selling off but credit spreads are not expanding, its because credit risk is remaining constant (or decreases). This is why you need an economic data model to know how growth AND inflation are currently functioning in the economy. When you correctly establish the skew of growth and inflation, you can then correctly analyze when and how much duration risk and credit risk are occurring.
Like I said in the last article, you first want to make sure that you are correctly analyzing the present, then we can use that as a foundation for speculating on the future.
Commodities:
Commodities are really important but you need to know how they fit into the big picture. Commodities impact specific components of the CPI complex and can (but don’t always) feed into CORE CPI. Inflation doesn’t = commodities though!
Fundamentally, you want to have some type of broad supply and demand model for each commodity so that you can know where you are in the commodity cycle.
Here is how I think about it: I want to have a top-down model telling me how broad GIP is getting priced into all commodities. Then I want to have a bottom-up model on each specific commodity that can tell me where there is continuity and discontinuity between my top down model. This is how I like to think about each asset. Your top down and bottom up models should connect and give you an explanation that accounts for various pieces of evidence.
FX:
FX is one of the toughest but its where there is the most opportunity in my mind. FX is difficult because to get it right, you need to get every other thing I mentioned above right.
Fundamentally, a currency is a gateway into a country’s goods/services and assets (an idea from Prometheus Research ). So you basically need to break down all the various reasons someone might be constrained to buy or sell the currency by breaking down the various drivers of the Balance of Payments.
If you don’t know what the Balance of Payments is, go back to the economic data and see how the BoP is the bridge connecting a country to other countries. You can read this on it: https://www.imf.org/external/np/sta/bop/bopman.pdf
In the short term, what you want to do is always know what is driving the buying and selling of a currency. Then you want to see how that might change in the future and what the implications are.
There is truly so much we can go over on FX because it is so complex which is why I am doing this Substack. I am going to be sharing A LOT more specific details on all these things.
For now, I’m just helping you get the big picture.
Let’s walk through these now:
Expectations vs Actual:
- Economic Surprise Indices
- MoM extrapolation, 3 Month Trend.
- Earnings Surprise
- EPS, Sales
- Economic Mechanics/Structural Dynamics Set Probable Distribution/Skew for Expectations vs actual.
You always want to watch how data comes in above or below expectations.
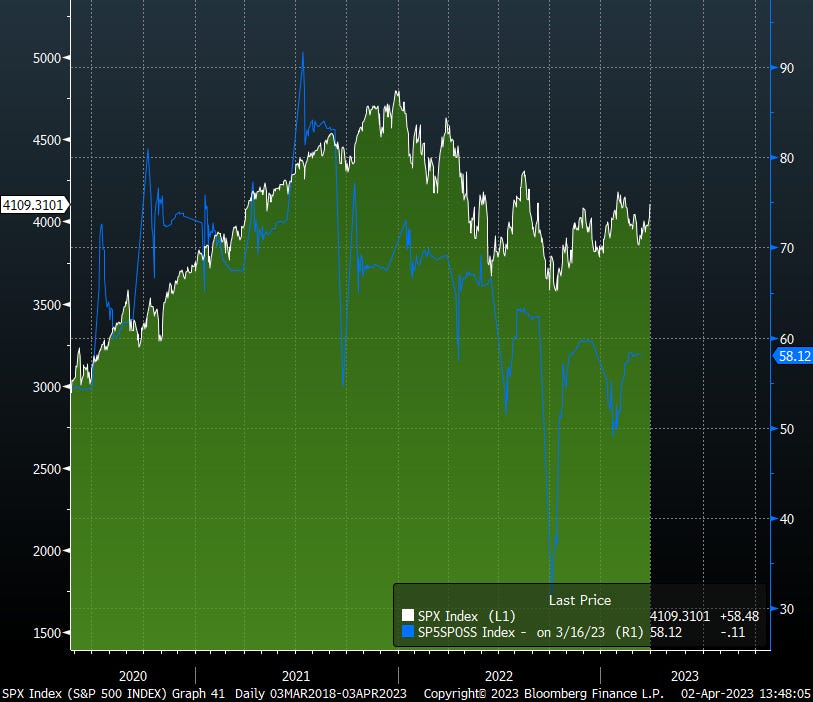
At all times, you can watch how each sector is coming in above or below expectations: here is an example from Bloomberg
If you don’t have a Bloomberg, the CME tool is a great resource to watch it: https://www.cmegroup.com/tools-information/quikstrike/treasury-watch.html
The next thing is economic data trend. I did a short tweet on this but what you want to do is watch the YoY, MoM and 3-month trend of all economic data. Then you want to position yourself in alignment with these as it connects with your time horizon:
What I do is compare the earnings/sales surprises of equities with the economic data surprises. Then I compare this with the earnings/valuations of equities and how the STIR market is changing future expectations for rate hikes/cuts.
Final note: if you understand the big-picture cyclical regime that you are in, you will be able to know the distribution of probable outcomes for economic data releases and asset class returns. This is where connecting longer-term economic models with shorter-term expectations vs actual releases can be incredibly powerful.
In my mind, the best trades are simply identifying points in time where the market is pricing something incredibly unrealistic and fading it. I like this type of logic because instead of having a thesis via confirmation (I think x will do y), you can have a thesis via disconfirmation (I don’t think x can do y). This goes back to a lot of the fundamentals for how to construct a logical thesis that operates optimally under uncertainty. Nassim Taleb and Karl Popper have great books on these ideas. Obviously, George Soros as well.
I will actually do some Substacks in the future explaining more about this type of thinking on a fundamental level because this is likely where most people lack today. Let me know in the comments or on Twitter if that is something you guys would be interested in!
Conclusion:
Build a model for every asset class connecting it to economic data
Have top-down and bottom-up models that connect in order to identify continuity and discontinuity from the macro regime.
Compare expectation with actual releases as it connects with the cyclical regime and watch how the market prices this in.
All asset classes are connected. Nothing operates in a silo. You are riding blind if you are only focusing on a single asset class or single data point.
Thanks for reading!


Hi. Keep up the good work. I'd suggest to remove the pdf link to the book to avoid getting into trouble. There are plenty of sites where people can get pirated books on their own.