Research Drop + Framework
There is a lot in this one but it will be good
Alright guys,
I will be going through a lot in this one but it will be helpful, especially if you are newer to financial markets. Basically, this is what I wish someone laid out for me a long time ago.
As I said a couple of articles ago, we will be breaking down every single country and the flows between them. Why? Because the whole world is simply nothing more than a flow chart of capital!
Now, this is a nice quote but how do we tangibly do that? Well, we start by building a country profile:
Country:
- Country Profile/History
- Demographics
- Investment/Output Capacity
- Geography
- Natural Resources, Weather, Transportation Networks, Technological Abilities
- Political Structure/Political Regime/Geopolitics
- Currency Regime/Monetary Regime/Fiscal Regime
Peter Zeihan’s (@PeterZeihan) books are really helpful in this process. I have read almost all of his books and watch his Youtube channel regularly. Geopolitical Alpha by Marko Papic (@Geo_papic) is also a great breakdown.
The main purpose behind understanding a country is to get a big-picture idea of who they are. The problem that usually occurs is people don’t do a good job quantifying these big-picture ideas or connecting them to economic data. For example, if a country has a lot of natural resources (think commodities), you would want to know how much of that accounts for overall GDP. We could then begin to connect this to input and output prices depending on the supply and demand cycle.
Generally speaking, you hear these narratives but they always seem really vague. This brings me to the next part of the framework, economic data:
This is a very Very VERY simple breakdown of economic data. In reality, you want to have a really good understanding of ALL the economic data and the underlying mechanics of the economy.
Economic Data:
- Flows:
- GDP
- Consumption
- Goods/Services
- Investment
- Fixed Investment
- Inventories
- Net Exports of goods/services
- Exports: Goods/services
- Imports: Goods/services
- Government Expenditures/Investments
- National Income
- Corporate Profits
- Employee Wages
- Labor Market/Demographics
- Service Sector
- Retail/Wholesale Sector
- Industrial Sector
- Manufacturing/Trade Inventories
- Housing and Real Estate
- Personal/Household Sector
- Government
- Economic Activity
- Surveys/Cyclical Indicators
- International Trade & BoP
- Prices
- Capital Structure:
- Financial Accounts/Balance Sheets
- Household, Corporates, Financials, Sovereign.
The thing I will say over and over is that most people in the market only watch data releases but barely ever know the “why” behind data points. There is a ton of edge in actually understanding why things are occurring.
Final point on economic data is that you want to watch it across all frequencies: quarterly, monthly, and weekly. Personally, I spend a lot of my time on the Integrated Macroeconomic Accounts because it’s the most overlooked dataset. This type of data is across all countries but the US typically has the most high-quality data.
Quick Summary:
Ok so we have a country profile and you want to connect all parts of a country with economic data so that your ideas are quantified and are not false narratives.
Financial Markets:
If you went through the economic data correctly, you would see the balance sheets of all households, corporates, banks and the government. These balance sheets consist of assets and liabilities which are traded in financial markets.
There should be a clear continuity between your economic analysis and fundamental analysis of markets.
Here is a simple breakdown.
Asset Market:
- Fundamentals connecting to economic data
- Equities
- Earnings, Valuations and cross-sectional fundamentals.
- Factors connecting to the regime
- Fixed Income
- Connecting to credit risk
- STIR, bills, notes, bonds
- Commodities
- FX
- FX Model: BoP, cross-border flows, reserves.
- FX forwards
- XCCY
Let me provide a couple of examples to make this more tangible. Let’s say a country has a lot of natural resources that make up a large portion of its GDP. The GDP of the country will be leveraged to the supply and demand cycle of that specific resource. That resource, lets say it’s something like copper or oil, is extracted and refined by companies. If those companies are publically traded, we can go look at the revenue, operating expenses, profits, and debt of the companies operating in the sector. We now have a clearer picture into the GDP of the country.
We want to do this for every sector of the economy and every sector of the market.
Here is nominal GDP by industry for the United States.
Something that has been important as of late is service inflation which is highly connected to wages in the economy. This directly connects with the FED’s actions and bond price action. We know that wages are directly connected with the labor market and that the labor market is directly connected to the output of each industry. So if you look at the expansion and contraction of each industry and then see how many people are employed in that industry, you can begin to get an idea of how much of a contraction in GDP we need to get in order to cause the labor market to deteriorate. In turn, this would likely cause inflation to fall and bonds to rally.
It’s all connected! I have mentioned Prometheus Research multiple times but they do a really good job at breaking this down and tangibly connecting it to a portfolio of decisions. If you look at their most recent portfolio update, they are long bonds which I like.
Part of connecting economic data to markets is looking at how data and earnings come up above or below expectations.
These are the main things I think about:
Expectations vs Actual:
- Economic Surprise Indices
- MoM extrapolation, 3 Month Trend.
- Earnings Surprise
- EPS, Sales
- Economic Mechanics/Structural Dynamics Set Probable Distribution/Skew for Expectations vs actual.
Here is the economic surprise index with the 6-month change in SPX:
Don’t forget that this is simply growth and inflation, we aren’t taking into account monetary policy so there will be divergences. You would need to account for these divergences by monitoring the FED and STIR market (short-term interest rate). You can monitor STIR here.
Sir of Finance always has good tweets on this.
So watching economic data releases and earnings releases helps us connect fundamentals to price action. We can watch how these releases get priced through an entire Globex session.
Positioning and Microstructure:
The final thing you want to account for is positioning and the microstructure of the market for a country:
Here is a broad breakdown:
Positioning and Market Microstructure:
- Financial Plumbing
- COT Positioning
- Option Positioning
- Sentiment/ ETF Flows/Mutual Fund Flows, Foreign Investment Flows.
- Active/Passive/Systematic Performance and Positioning
- Autocorrelation of assets and positioning
Microstructure of the market:
- Intraday dynamics/execution
- Globex session
- Seasonality
- Order imbalances
- Market elasticity and liquidity
- Limit Order Book and transaction characteristics
I will provide some resources on this:
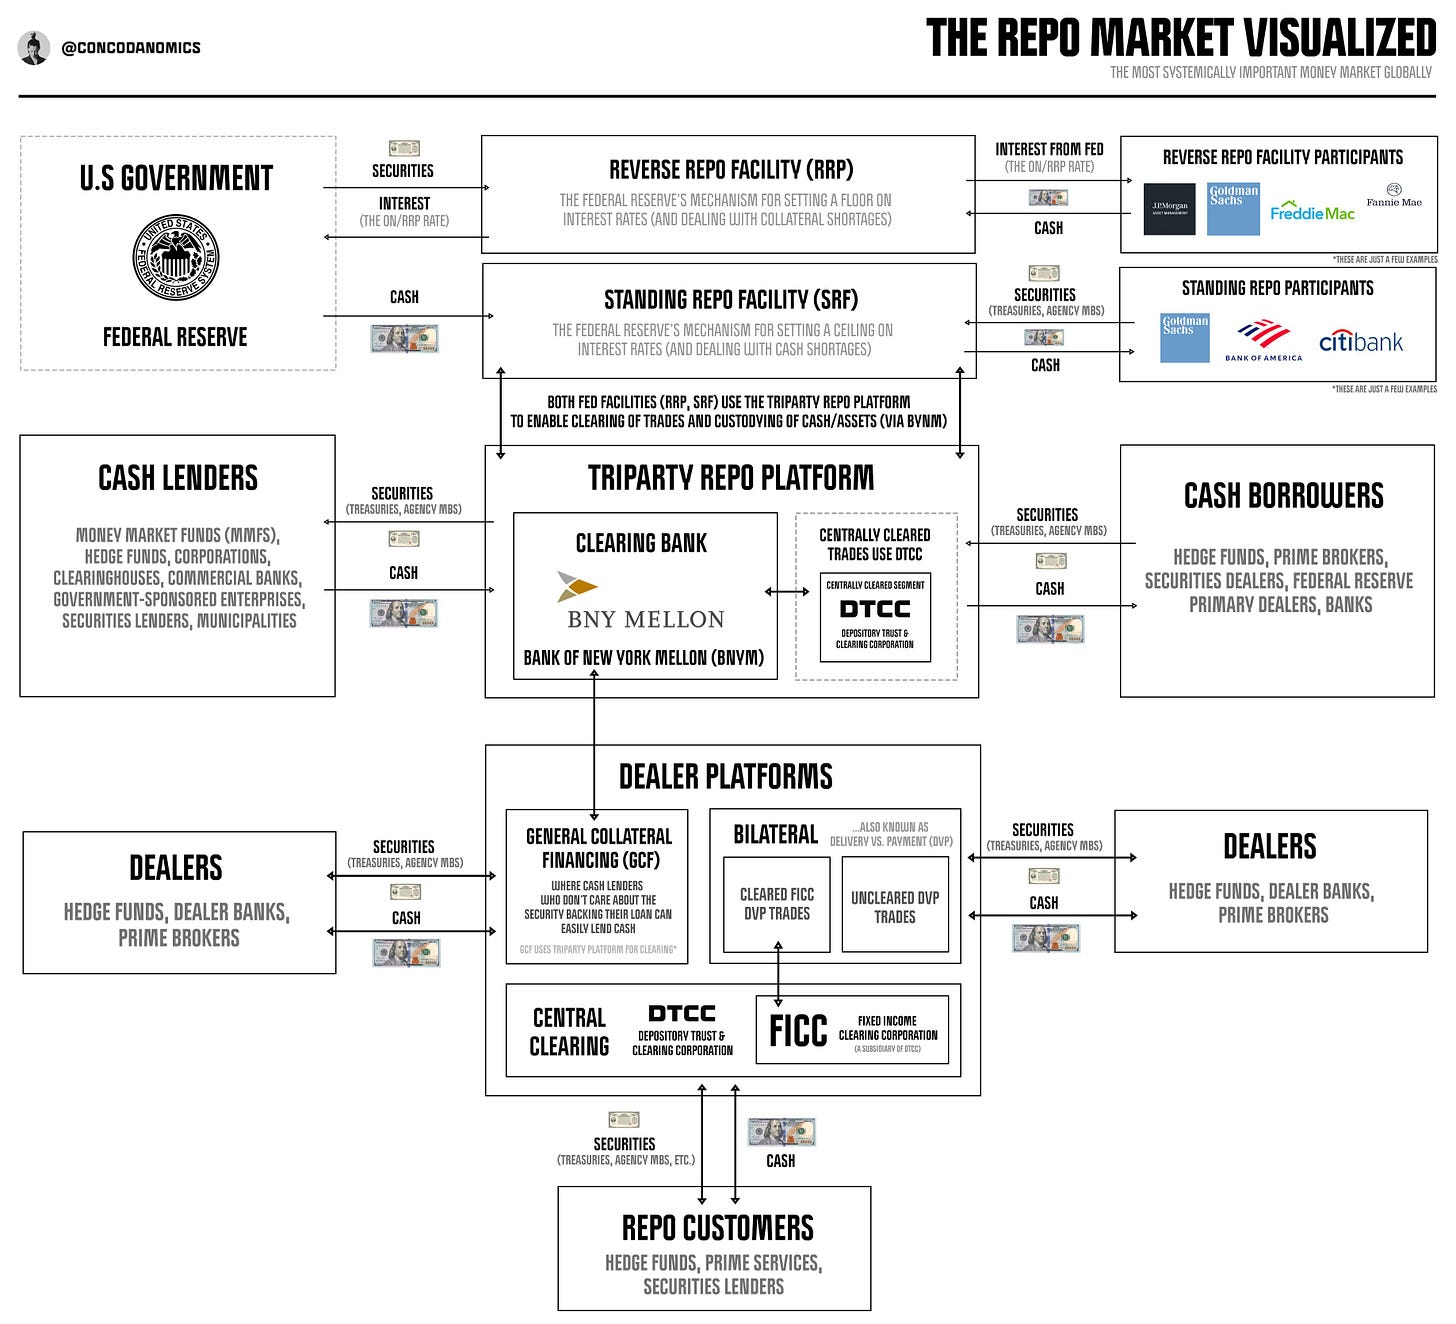
Here is an exceptional visual breakdown of the repo market which is part of the financial plumbing. It is by @concodanomics and he has a substack Concoda which I definitely recommend.
Joseph Wang always has great thoughts on financial plumbing and his book is really good:
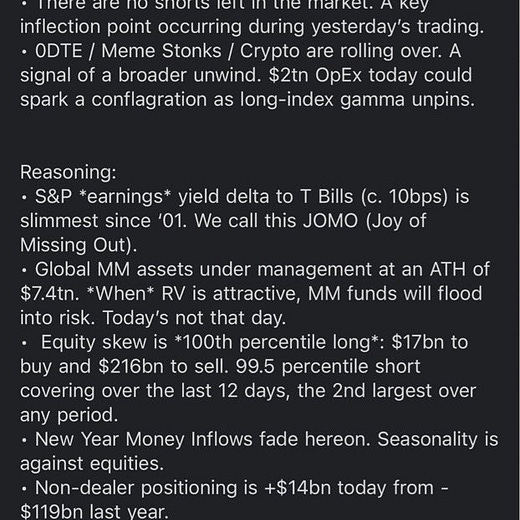
If you want very tangible examples of taking into account flows and price action, @acrossthespread on twitter has a great podcast on it.
Here are some great papers on intraday characteristics that were originally shared by @WifeyAlpha on Twitter.
https://papers.ssrn.com/sol3/papers.cfm?abstract_id=3760365
https://papers.ssrn.com/sol3/papers.cfm?abstract_id=4139328
https://papers.ssrn.com/sol3/papers.cfm?abstract_id=3760365
https://papers.ssrn.com/sol3/papers.cfm?abstract_id=3798844
https://www.researchgate.net/publication/326472346_Re-Appraising_Intraday_Trading_Patterns_What_You_Didn%27t_Know_You_Didn%27t_Know
I would definitely recommend people go and read all the research that @wifeyalpha has shared!
In terms of the microstructure of the market,
Trades, Quotes and Prices: Financial Markets Under the Microscope is a great book.
Here are a couple of papers I have found helpful as well:
https://papers.ssrn.com/sol3/papers.cfm?abstract_id=2878945
https://papers.ssrn.com/sol3/papers.cfm?abstract_id=2852760
I also found the book Dark Pools really fun to read which was originally recommended by @quant_arb on Twitter.
Wrapping Up:
All of the things I have shared thus far are very broad. In reality, the bullet points I shared have hundreds of subpoints! The main thing I want to communicate is that everything is connected. Nothing operates in a silo.
What we will be doing in the coming articles is digging into each of these bullet points, understanding them correctly and then connecting them to the rest of the system correctly. All of this will be honed into HOW to actually execute trades. It’s not meant to be theoretical! (You can see some of the past articles on a trade we ran)
Like I said above, this is very basic but it’s what I wish someone broke down for me when I started.
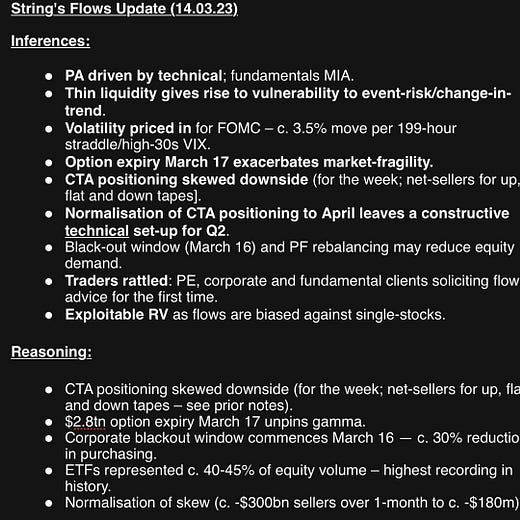
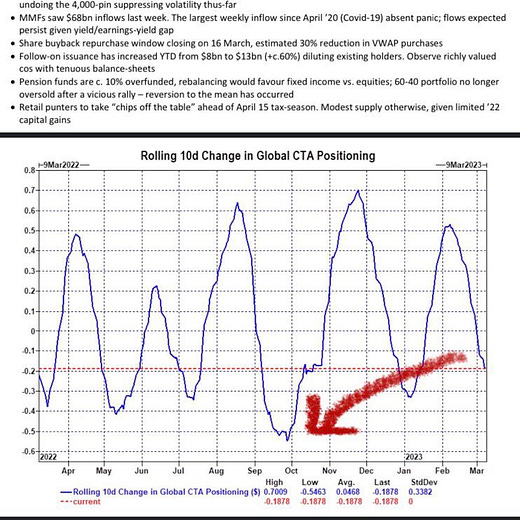
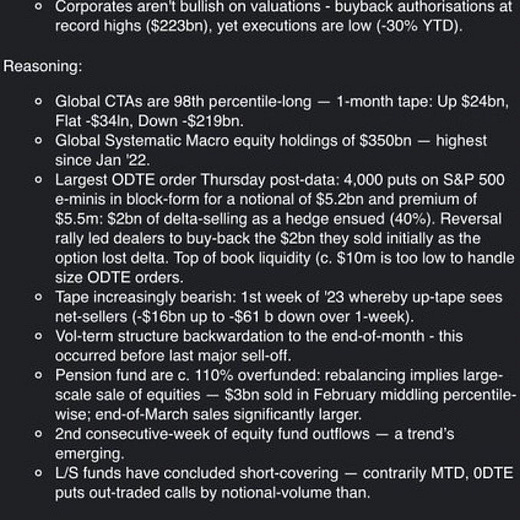
An example of how this analysis can be synthesized for redundancy planning is the Tweet by @8StringerBell8.
@roaringmeows also does a good job at this. You can see some examples on Sam’s Twitter:
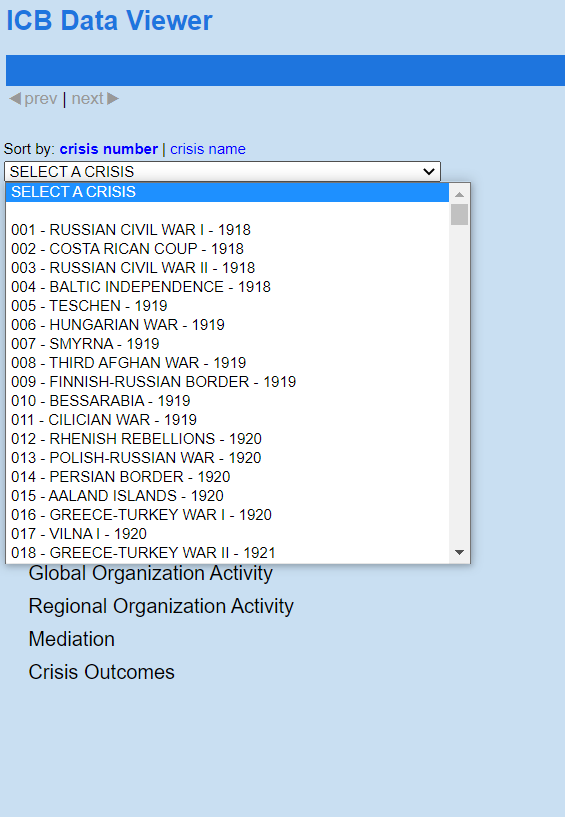
The final thing I will share is that once you get all of these models set up and have an understanding of flows, you can begin to think with more creativity. One way I do this is by going through the ICB data viewer studying past crises: http://www.icb.umd.edu/dataviewer/
You can see they have studies going back to 1918. They provide pretty comprehensive data points for every crisis.
I will spend time reading these and thinking about how various shocks could get transmitted through the current capital structure of a country/market.
Alright, A LOT more will be coming so watch out for it.
Thanks for reading!




I've been slowly getting back through your Substacks. I have a question regarding your microstructure: are these all systems/data you are accounting for and processing yourself? Each seem to be very specific and "niche" style areas. Regardless, how much are you weighting your decision making off of each type of microstructure? Is it a temperature check or more of a compass?
I've never seen anyone provide more realistic, high-quality, and accurate valuable information than you. Thank you for giving people accurate and valuable information; it's a quality and wonderful thing to have you, professor.