Hey everyone,
Quick educational note addressing questions from you guys.
What are the things I watch every day?
How do regime shifts occur?
Things I watch Every Day:
I have systematic models up and running on all assets. Every morning, I get up, check the price action from the overnight session, get my coffee (most important!), and then flip through all the models I have running. At this stage, I am trying to gain a really good understanding of the insights my model generates through various information releases or discretionary things I see. So, I am still keeping a close eye on everything.
What are these models? I mean, here's the deal: I literally don't have the time to go through every single one of these and explain them. I am going to try to write articles on a lot of them over the coming months, but you have to realize it's not an easy task. This is why I have written the educational articles. If you've built models on everything I noted in there, you are probably well on your way.
Tweet with links to all education articles:
https://twitter.com/Globalflows/status/1646154915436265479
What I would say, though, is that you want to start by mapping momentum and standard deviation across all asset classes on multiple time horizons. The WifeyAlpha account has a good example of this (also, if you really want to get this stuff down, just read all the wifey research in his pinned tweet. Literally the answer to most problems like this is to read more! ):
https://twitter.com/WifeyAlpha/status/1654515977105580033
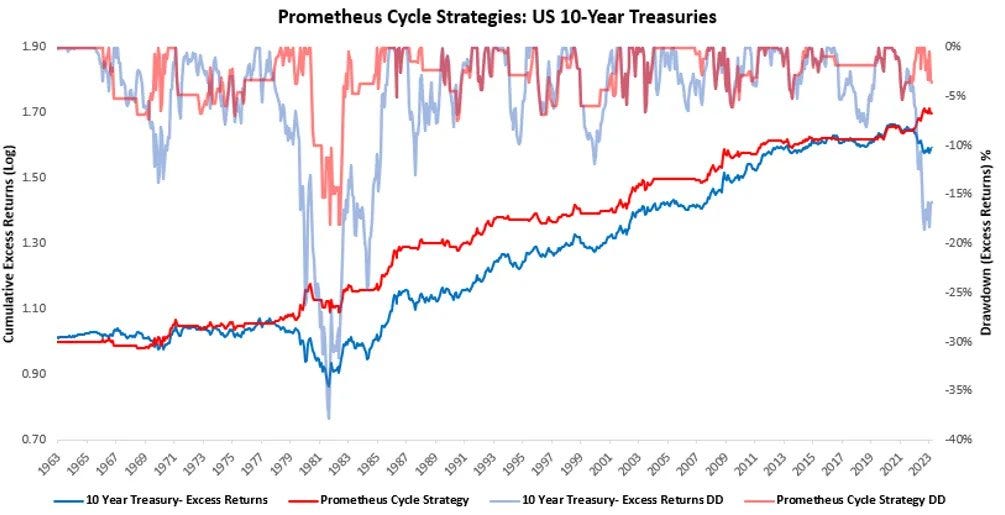
Another example is how Prometheus has an entire bond strategy noted in their most recent macro report:
https://twitter.com/prometheusmacro/status/1654586038361391104
You want a dashboard of the absolute momentum and standard deviation of all assets, and then you also want systematic strategies running on all assets. For example, if my bond strategy is saying to buy bonds based on fundamental and momentum signals I have developed, then that probably tells me I am in a regime where I want to be long bonds.
You also have to realize there is a lot of software and technological infrastructure that people simply can't share. But you should also understand that the majority of these strategies don't have some divine magic in them. You can do a decent job with Bollinger Bands and Moving Averages. However, it's the optimization that allows you to really push the leverage and refine your trading metrics.
I also have a weekly plan showing how markets price in data releases, as well as some option models that monitor the options market on every asset. I usually have a Squawk up when the market is open, but I will say there is a ton of noise on there. However, there are times you can make a lot of money keeping an ear on the squawk simply because you act first.
I also have order imbalance models running on assets that connect to momentum inflection points. Again, these things are noted in the educational articles. :)
How do regime shifts occur?
Regimes can be specified by various factors. Are we in a high-vol or low-vol regime? High growth or low growth regime? Bullish or bearish regime?
The question is, how do you statistically quantify regimes so that you can have some accuracy in identifying inflection points? Most people don't like to bet on inflection points because you can lose a lot of money. However, you need to realize that the greatest returns and nonlinear moves occur at inflection points. I would say my biggest winners are at inflection points. The dollar trade I currently have on is a bet on an inflection point occurring:
Trades: Long the Dollar / Short the Euro
As I write this, the EURUSD pair is at 1.1047. I am opening a long USD / Short Euro Trade. *******Not investment advice Here is roughly how I view the risk/reward of EURUSD. I will spend some time this week explaining this trade a little more but for now, it’s on!
What you need to do is go back through history and study inflection points across all major asset classes.
Here are some good papers on it:
https://www.sciencedirect.com/science/article/pii/S0264999323000494
https://arxiv.org/ftp/arxiv/papers/1812/1812.02527.pdf
High-level note: If you connect the level and rate of change in growth, inflation, and liquidity with a momentum and mean reversion switching model, it can really help a lot in connecting the fundamental data with price action. For example, inflation is elevated but decelerating. This has caused mean reversion in bonds for the past 3-ish months. Once inflation has fallen enough, we will move from mean reversion in bonds to positive momentum.
Pragmatic Note: If all of this is just way over your head, just stick a couple of moving averages and a Bollinger Band on the price. If you don't make stupid decisions and are just trying to do a decent job, you'll be fine. It’s not going to be the best system in the world but it’s better than nothing.
All these tools are free in TradingView.
Here's the thing, I know some traders who understand flows and the market really well. All they use are moving averages and Bollinger Bands. They make decent money. As you probably know, my goal is not to make "decent money."
But again, we all have different goals, and meeting your goals is really what this is all about.
Conclusion:
I mentioned this in a previous article; depending on how some projects on my end play out and my ability to dedicate more time to this Substack, I might run a portfolio for some subscribers. If you are interested, you can pledge here. I appreciate all the people who have been asking and pledging thus far. You guys are legit! :
Thanks for reading!
I will be sharing some more insights this week about CPI and BoE.


