The Research HUB: The Bond Market
The breakdown
Hello everyone,
Many subscribers have been asking for a primer on how the bond market works. In this article, I'm going to provide a breakdown with a TON of resources. My goal is to keep things clear and simple, avoiding any complex math. After reading this article, you'll see that understanding the bond market is essential for understanding macroeconomics. You'll also find that it's incredibly challenging to synthesize all the moving parts in real-time.
I'll start by breaking down all the moving parts and then demonstrating how they connect:
Summary of Contents:
Breakdown of Yields:
Curves:
Resources:
Breakdown Of Yields:
Firstly, let's clarify the terms:
Nominal Rate: This is the face value of the interest rate and does not account for inflation. If a bond has a nominal rate of 5%, the issuer of the bond agrees to pay 5% interest on the principal amount.
Real Rate: This is the interest rate that has been adjusted to remove the effects of inflation. It represents the rate of interest an investor expects to earn after allowing for inflation.
Inflation Expectations or Breakevens: This is the rate of inflation that is anticipated over a certain period.
The relationship between these three can be given by the Fisher Equation, which is:
Nominal Rate = Real Rate + Inflation Expectations
To decompose a nominal rate into the inflation expectations and real rates, you would need to have information on two of the three variables. For example, if you know the nominal rate and the inflation expectations, you could solve for the real rate by rearranging the equation to:
Real Rate = Nominal Rate - Inflation Expectations
Breakeven inflation can be thought of as the market's expectation for inflation. In the context of Treasury Inflation-Protected Securities (TIPS) and nominal bonds in the U.S., the breakeven inflation rate is often computed as the difference between the yield of a nominal bond and an inflation-protected bond (like TIPS) of the same maturity.
What does this practically mean?
Here's the deal: whenever you're analyzing an asset, you need to perform an attribution analysis. This means identifying all the variables that affect the movement of the asset over time.
When I take a view on nominal rates, I'm considering BOTH the inflation component and the real rate component. Here is a chart of these components:
In the chart above, you can see 10-year nominal rates in blue, 10-year breakevens in orange, and 10-year real rates in yellow.
Notice in the chart above that during 2021, the Fed didn't hike rates when inflation was accelerating, which caused real rates to dip into negative territory. However, nominal yields still rose marginally because breakevens were increasing. Conversely, as breakevens fell from their peak into 2023, nominal rates didn't fall significantly because real rates exerted upward pressure on nominal rates.
This is a super-simplified version, but breakevens will generally align with inflation (or at least the market's expectation and pricing of it), and real rates will largely track the Fed's actions.
Inflation represents the amount of money in the system relative to the quantity of goods and services available.
Real rates, in our current world of US central banking, are directly linked with the Fed's actions as they are priced by the forward curve. You can use the CME tool to monitor the forward curve (link). For example, I watch SOFR spreads very closely as they relate to both bond prices and nominal yield curves.
Practically:
If you're trying to monitor these data points on a daily basis, you can track the IEF ETF, which represents the nominal component, the RINF ETF, representing the inflation/breakeven component, and the TIP ETF, which stands for the real rate component.
Any time there is a move in bonds, I am always asking, what component is driving it. The best way to approach this is to conduct a historical study of US interest rate history, taking these components into account. Again, there are a lot of small details and qualifications but these are the big ideas.
Things To Watch (all of these can be found on Tradingview or FRED):
Nominal rates across all durations.
Breakevens across all durations
Real Rates across all durations
Curves:
After gaining a basic understanding of the components for nominal yields across multiple durations, it's crucial to understand the relative relationships of all these components. This introduces the concept of yield curves.
The yield curve can be interpreted through a variety of spreads, which essentially compare the yield of two bonds with different maturities. The difference between the yields of these bonds is known as a "spread". Here are the main ones I monitor:
2s10s Spread
2s30s Spread
5s30s Spread
10s30s Spread
3m2s Spread
3m10s Spread
2s5s Spread
5s10s Spread
1s2s Spread
7s10s Spread
20s30s Spread
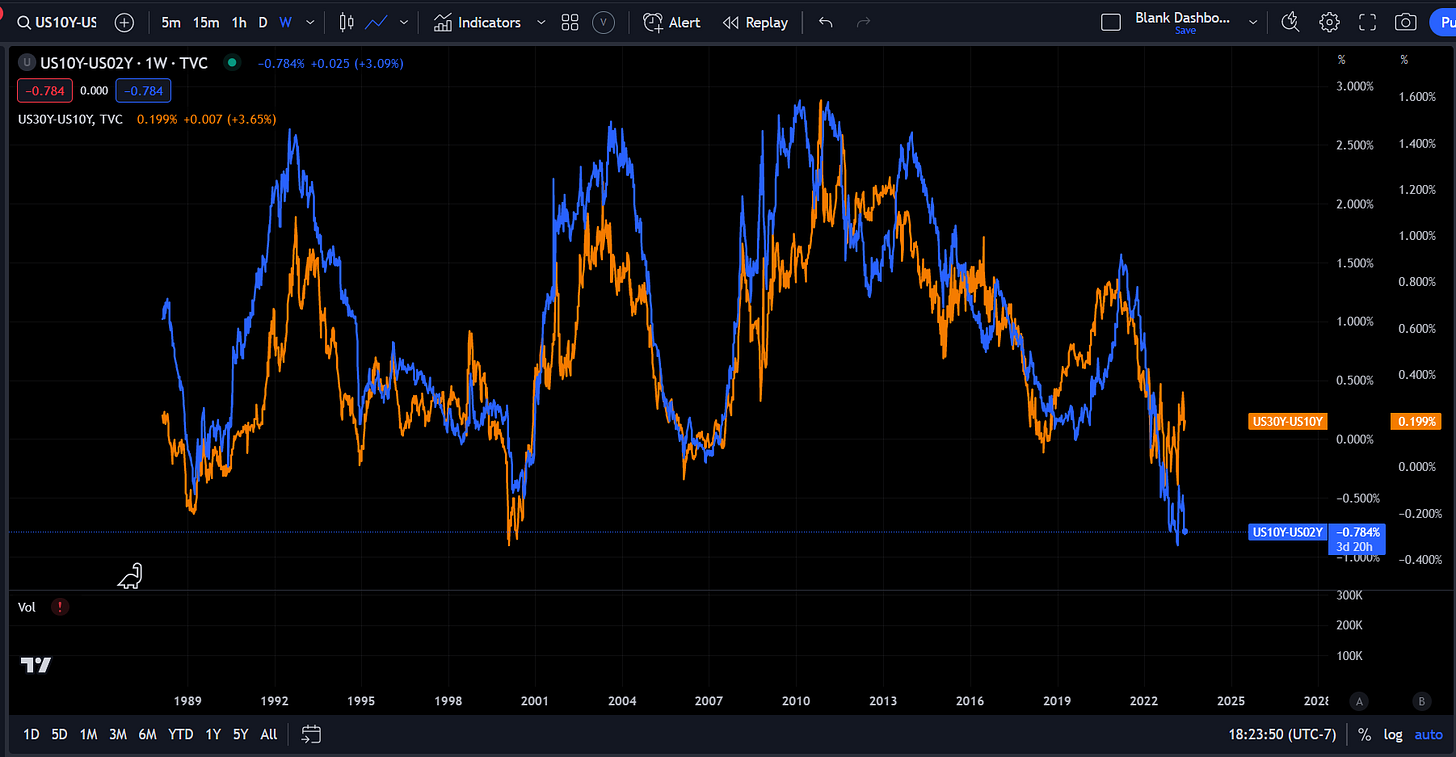
Here's an example: Note that there's sometimes a lead or a lag. This is incredibly important for timing markets and understanding the "why" behind a movement:
Now from here, we need to understand the different TYPES of curves:
Bull/Bear Steepeners
Bull/Bear Flatteners
See these resources: link and link
Fundamentally, if the curve is moving, one of these TYPES of curve moves will be taking place. This can be turned into regimes for comparing the TYPES of the curve moves to other regime delineations and data points.
Additional Thoughts On Curves:
I systematically monitor the curves of nominal rates, breakevens, and real rates. I'll provide two examples to illustrate why this can be helpful:
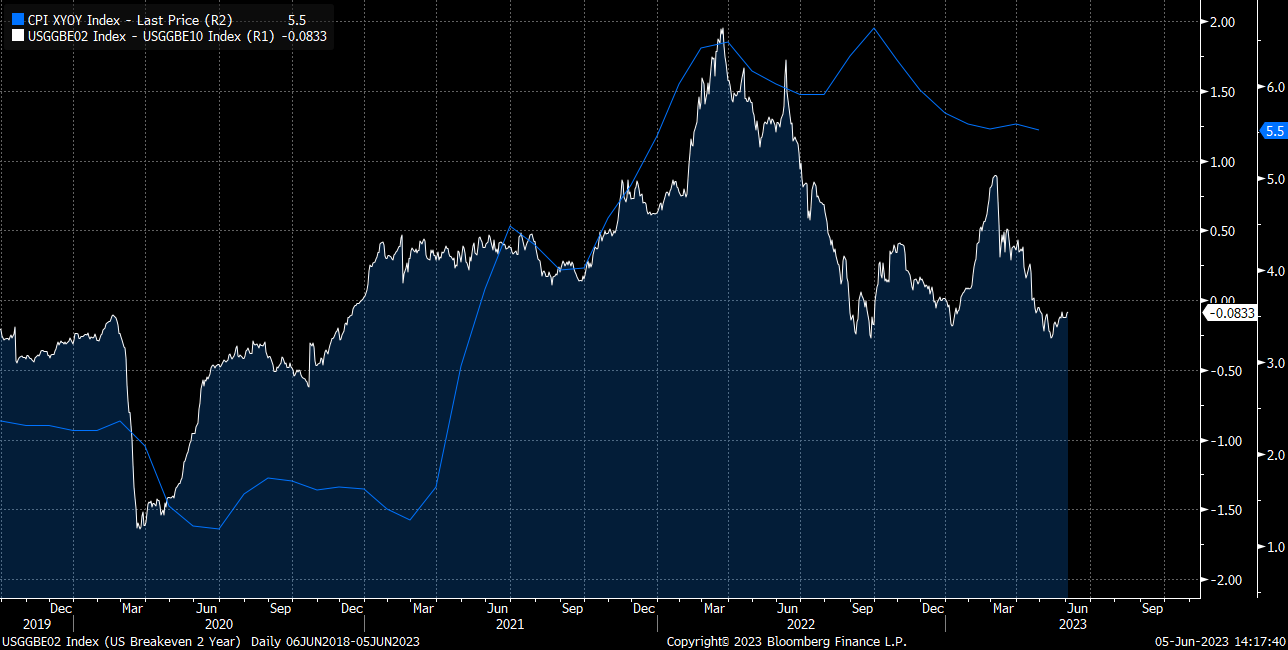
Consider the 2-year breakeven minus the 10-year breakeven, along with the Core CPI: We can see the spread display different characteristics at the first and second peaks of the Core CPI. This was critical in determining the acceleration and deceleration of inflation as it influences nominal yields:
The second example involves real rates. Once the Fed began raising rates in 2022, the question of "How much?" arose. One of the metrics people were watching was whether real rates were negative on the short end of the curve:
Depending on which portions of the real rate curve are negative, there can be a dramatic impact on assets across the risk curve. For instance, if we examine the 10s-2s real rate spread, we can see it moving in conjunction with assets like BTC:
Quick Summary:
Okay, we now have a very basic understanding of yield drivers and curves. What you need to start doing is connecting all of these data points and metrics with your GIP (growth, inflation, and liquidity) models. I would suggest looking at Prometheus Research for the economic data.
You'll also want to gain a thorough understanding of the plumbing, Fed, and forward curve. I recommend Concoda for this.
There's an abundance of papers and literature on all of these ideas. I'm merely providing you with the big picture.
Big Idea: Breakevens align with inflation, real rates align with the Fed (and forward curve pricing), and nominal rates are comprised of the "net causal force" these two variables exert.
Resources:
I Tweeted a thread of books with excellent fixed-income resources (start with this one: link):
https://twitter.com/Globalflows/status/1645819494982651908
I also provided a list of papers to read. These will make a lot more sense once you understand the basic definitions I provided above:
https://twitter.com/Globalflows/status/1664442117454979073
The final resource is this tweet on price action:
https://twitter.com/Globalflows/status/1648152378129158144
I closely monitor bonds (and all data points/curves mentioned above) throughout all trading sessions and data releases. This helps me get a sense of positioning. I know people often refer to COT (Commitments of Traders) positioning, and while that's certainly useful, the real signal lies in the price. Ultimately, our P&L is denominated in price, not COT numbers.
Deeper Dive:
Some papers additional papers:
https://papers.ssrn.com/sol3/papers.cfm?abstract_id=3232721
https://papers.ssrn.com/sol3/papers.cfm?abstract_id=1709636
https://papers.ssrn.com/sol3/papers.cfm?abstract_id=2136820
https://papers.ssrn.com/sol3/papers.cfm?abstract_id=637481
https://papers.ssrn.com/sol3/papers.cfm?abstract_id=1458006
https://papers.ssrn.com/sol3/papers.cfm?abstract_id=292979
https://papers.ssrn.com/sol3/papers.cfm?abstract_id=966227
https://papers.ssrn.com/sol3/papers.cfm?abstract_id=92568
https://papers.ssrn.com/sol3/papers.cfm?abstract_id=809346
https://papers.ssrn.com/sol3/papers.cfm?abstract_id=3385579
https://papers.ssrn.com/sol3/papers.cfm?abstract_id=2055346
https://papers.ssrn.com/sol3/papers.cfm?abstract_id=1851854
https://papers.ssrn.com/sol3/papers.cfm?abstract_id=1738401
https://papers.ssrn.com/sol3/papers.cfm?abstract_id=2242280
https://papers.ssrn.com/sol3/papers.cfm?abstract_id=2281808
https://papers.ssrn.com/sol3/papers.cfm?abstract_id=2838667
https://papers.ssrn.com/sol3/papers.cfm?abstract_id=2005178
https://papers.ssrn.com/sol3/papers.cfm?abstract_id=38460
https://papers.ssrn.com/sol3/papers.cfm?abstract_id=1340854
https://papers.ssrn.com/sol3/papers.cfm?abstract_id=982
https://www.newyorkfed.org/research/capital_markets/ycfaq#/
https://www.newyorkfed.org/research/current_issues/ci12-5.html
This is a great resource for inflation: https://www.atlantichousegroup.com/post/seminar-series-what-the-derivatives-market-is-telling-us-about-inflation
I still think this is a great intro for very new people: https://www.aqr.com/Research-Archive/Research/White-Papers/What-Drives-Bond-Yields
Jose at Thriddio Asset Management has some exceptional analysis on rates as well. Be sure to go Subscribe to him!
Pulling It Together:
What you need to do is get models up and running for all these moving parts, and then synthesize them in real-time to execute trades. Once you begin to understand how these components connect to the GIP picture, the performance of equity sectors and equity factors will start making much more sense.
Technically, there's a helpful learning structure for exploring each aspect of the market. It's beneficial to start with short-term interest rate instruments, then move out along the duration curve, and THEN move out along the risk curve. The issue I often see is that people who are at the farthest part of the risk curve (VC, equities, crypto) know the least about the short end of the curve.
Interest rates fundamentally connect to everything because they represent the price of money, and all things are denominated in some form of money. For instance, DE Shaw has an excellent paper on stock market sensitivity to bonds. You begin to see how connected interest rates are to every other asset:
Conclusion:
I have models for the attribution analysis and regimes of all the data points mentioned above. I monitor how every data point is changing in real time through Globex sessions and data prints. Once you do this across multiple countries, FX starts to make much more sense. Many of these concepts trace back to the educational articles I've written (see links in this article).
This is also why I'm dedicating more time to sharing real-time analyses and trades concerning all the topics I've mentioned above. You can review the work and trades I'm sharing with subscribers in the following articles:
Final Thought (What do I do?):
If you can work through many of the books and papers mentioned above, they will equip you with most of what you need to build any models. Once you've built the models, the entire process will become much clearer.
If you're short on time, monitor the ETFs I've noted above and learn how to use the CME Tool. If you understand how to use these basic tools, then you'll be able to interpret Tweets and research in a more informed manner.
We can never predict the future with certainty, but if we understand the present exceptionally well, then we can use this as a launching point for future action.
Thanks for reading!


Thank you for your hard work in making this, its much appreciated.
love this