

The Yield Curve, Inflation Risk, and Why the Curve Determines Risk Assets Through Earnings
Why 5s30s above 2s10s is the cleanest growth resilience signal, how the Z7 SOFR contract anchored the ES bottom in real time, and what the PCE print actually means for long-end rates

Today, I walked through the full yield curve framework with Jaymes Rosenthal and how each regime maps to the Fed’s policy error against growth and inflation. The PCE print came in with headline up 70bps MoM while core stayed contained, and that single distinction is the entire question right now. Z7 held the level we mapped yesterday, ES bottomed at that exact level intraday, and the cross-asset linkages are doing exactly what the framework predicted heading into the heaviest two weeks of mega-cap earnings of the year.
LIVESTREAM RECORDING FROM TODAY:
Today’s Livestream: Main Talking Points
1. Every macro story collapses into the curve. Growth, inflation, policy stance, dollar direction, credit appetite, equity rotation. All of it shows up in where the front end and back end sit. The yield curve in itself is not a directional rate signal. The four regimes are bull steepening, bear steepening, bull flattening, and bear flattening, and each represents a specific combination of where the Fed is making a policy error against where growth and inflation are heading. Read the regime, and the macro stops being disconnected data points and becomes a single coherent signal.
2. 5s30s sitting above 2s10s right now is the cleanest growth resilience signal in the market. When the longer duration curve is steeper than the shorter duration curve, you are seeing more sensitivity to long-term nominal growth than to Fed policy. If growth were actually breaking, 5s30s would compress against 2s10s as the long end signaled real economy weakness. We are not seeing that. The curve shape is consistent with the credit cycle melt-up extending, not breaking.
3. PCE headline ticked up 70bps month over month. Core stayed contained. That distinction is the single most important macro question heading into the next month. If crude pass-through stays at the headline level and does not transmit into core, long-end rates have a ceiling and equity multiples hold. If core reaccelerates, the long end has to price more inflation premium, which forces the bear steepener and crushes equity multiples through the discount rate channel. The market is pricing the contained outcome right now.
4. Long-end rates kill equity multiples through the risk curve, not through the Fed. If you can buy the 30-year Treasury at 5 percent yield, that is much less risky than buying the S&P at a 2 percent yield. As long-end rates rise, capital reallocates away from risk assets toward the risk-free rate. The Fed only controls the short end. Growth and inflation control the long end. The long end is what determines whether equity multiples expand or compress, not the Fed funds rate.
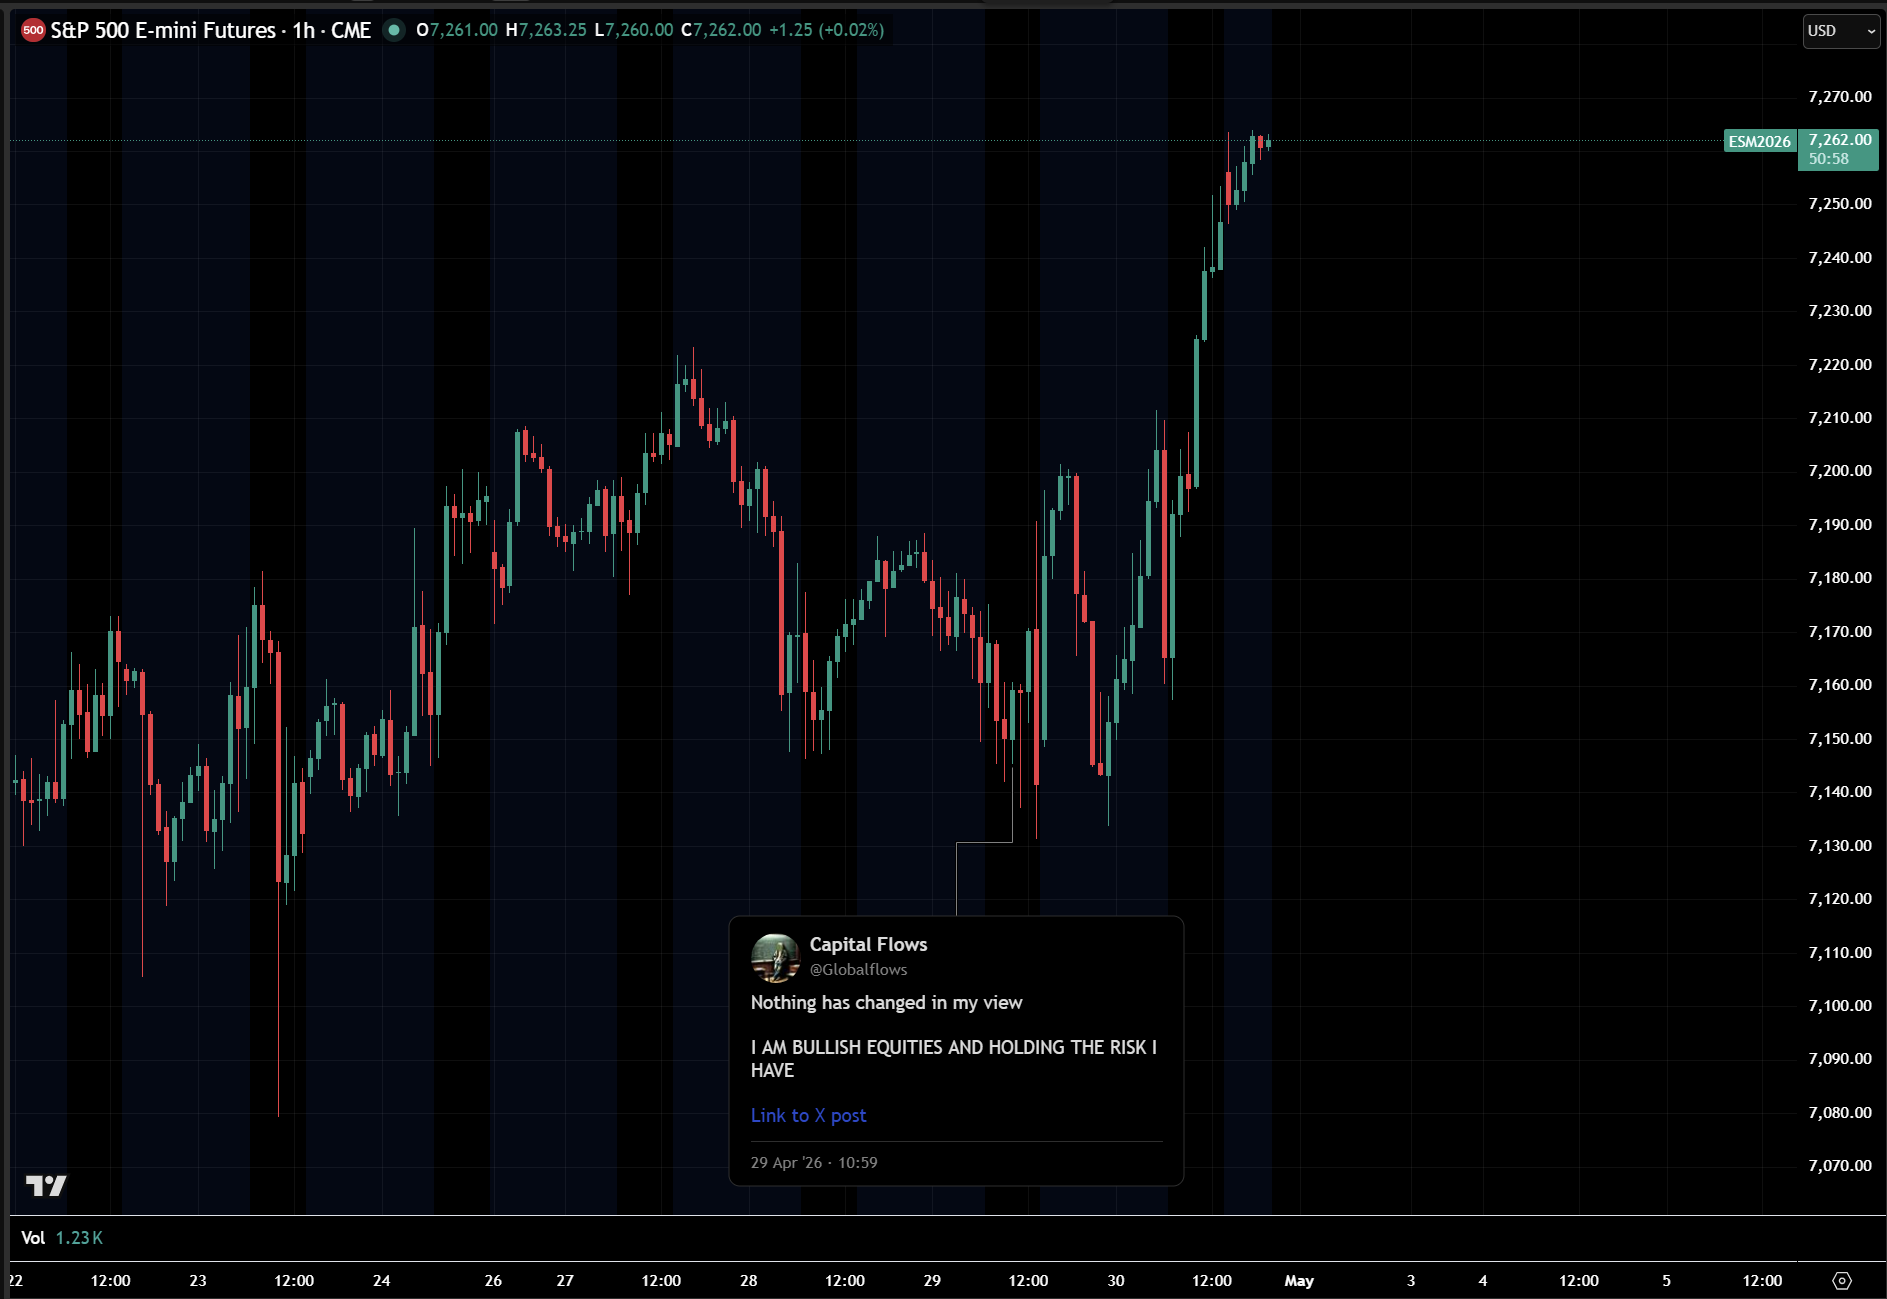
5. Z7 held the level we mapped yesterday and ES bottomed intraday at the same level. Yesterday I called out 96.340 on Z7 as the level capping the downside in bonds, gold, silver, and EURUSD. Today ES made its intraday low at the exact same level mechanically because the equity discount rate is anchored to the same Fed reaction function pricing through Z7. EURUSD, gold, silver, and ES are all in the same correlation cluster because they all price off short-end rates. Trading one asset means understanding all of them.
6. Z7 has limited downside but limited upside from here. That makes it a fade trade, not a directional trade. Going much lower requires the Fed to actually hike, which the data does not support. Going much higher requires aggressive cuts, which Warsh’s framework does not justify in the immediate term. The trade is not Z7 itself. The trade is the second and third order effects in EURUSD, gold, silver, and equity multiples that move when the cluster reprices around Z7.
7. The Qualcomm catch-up trade is up 44 percent from the $135 entry on leaps. That is the framework working in real time. James called Qualcomm at $135 a few weeks back. Capitulation wick below the range, every other semiconductor competitor bidding, and the company forgotten by FinTwit. Downside limited, upside asymmetric. Now we are up 44% on the equity. This is what happens when you align a cross-asset macro framework with single-name idiosyncratic setups. The melt-up creates these catch-up trades constantly.
Slide Deck and Playbooks
In the slide deck from the livestream, you can find the full breakdown of all the ideas and moving parts I covered.

Yield Curve Model From Tradingview: LINK
Tomorrow’s Livestream: Capital Flows | End of Week Wrap: How Interest Rates Cause the Rise and Fall of Nations
Tomorrow is the end of week wrap. We pull together everything that happened this week from FOMC through PCE, but we widen the lens significantly. Interest rates are the price of time and the price of money, and across history, they are the single most important variable that determines which nations rise and which nations fall. In a globalized world with excessive government spending across every major economy, tracking capital flows is the entire game. We map why the dollar, the curve, and cross-border flows are doing what they are doing, what that means for the next leg of the credit cycle, and why this framework is the only way to navigate a world where every government is running deficits and every central bank is repricing its framework at the same time.
TOMORROW’S LIVESTREAM: LINK
The information on this website/Substack is for information purposes only. It is believed to be reliable, but Capital Flows does not warrant its completeness or accuracy. The information on the website/Substack is not intended as an offer or solicitation for the purchase of stock or any financial instrument. The information and materials contained in these pages and the terms, conditions and descriptions that appear, are subject to change without notice. Unauthorized use of Capital Flows websites and systems including but not limited to data scraping, unauthorized entry into Capital Flows systems, misuse of passwords, or misuse of any information posted on a site is strictly prohibited. Your eligibility for particular services is subject to final determination by Capital Flows and/or its affiliates. Investment services are not bank deposits or insured by the FDIC or other entity and are subject to investment risks, including possible loss of principal amount invested. Your use of any information which is proprietary to Capital Flows or a third-party information provider shall only be used on individual devices without any right to redistribute, upload, export, copy, or otherwise transfer the information to any centralized interdepartmental or shared device, directory, database or other repository nor to otherwise make it available to any other entity/person/third party, without the prior written consent of Capital Flows.
May I pick your brains… why Z7 is chosen to be the discount rate for the cross assets you mentioned please?
Great presentation. I’d welcome your thoughts on the thesis in this paper, and how it might affect interest rates and the bond market.
https://www.btcpolicy.org/articles/stablecoins-as-statecraft-reclaiming-us-financial-sovereignty-in-the-eurodollar-market