

Alpha Report: Interest Rates In The Global System
How interest rates interact with the changes in central bank policy

Interest Rates In Global Macro:
Interest rates are the price of time. They translate today’s savings into tomorrow’s capital and discount tomorrow’s cash‐flows back into today’s valuations. In a global system where capital is free to migrate toward the highest risk-adjusted return, any serious analysis must decompose the headline—or nominal—rate into two moving parts:
Inflation expectations (π e) – the market’s pricing of future purchasing-power erosion.
The real rate (r) – the pure time value of money, driven by productivity growth, demographic savings preferences, risk premia, and the global supply-and-demand for safe collateral.
Nominal = r + π e. Every basis-point move in the nominal yield curve therefore tells a story about which side of that identity is doing the heavy lifting.
The interest rate primer covers these factors in depth with extensive book recommendations and academic papers explaining each aspect.

So what does this tangibly look like? The panel beneath plots the three moving parts of the 10-year US yield since 2020— nominal (white), real TIPs yield (blue) and the 10-yr inflation-swap breakeven (red). Tracking them side-by-side makes the mechanics of rate decomposition impossible to miss:
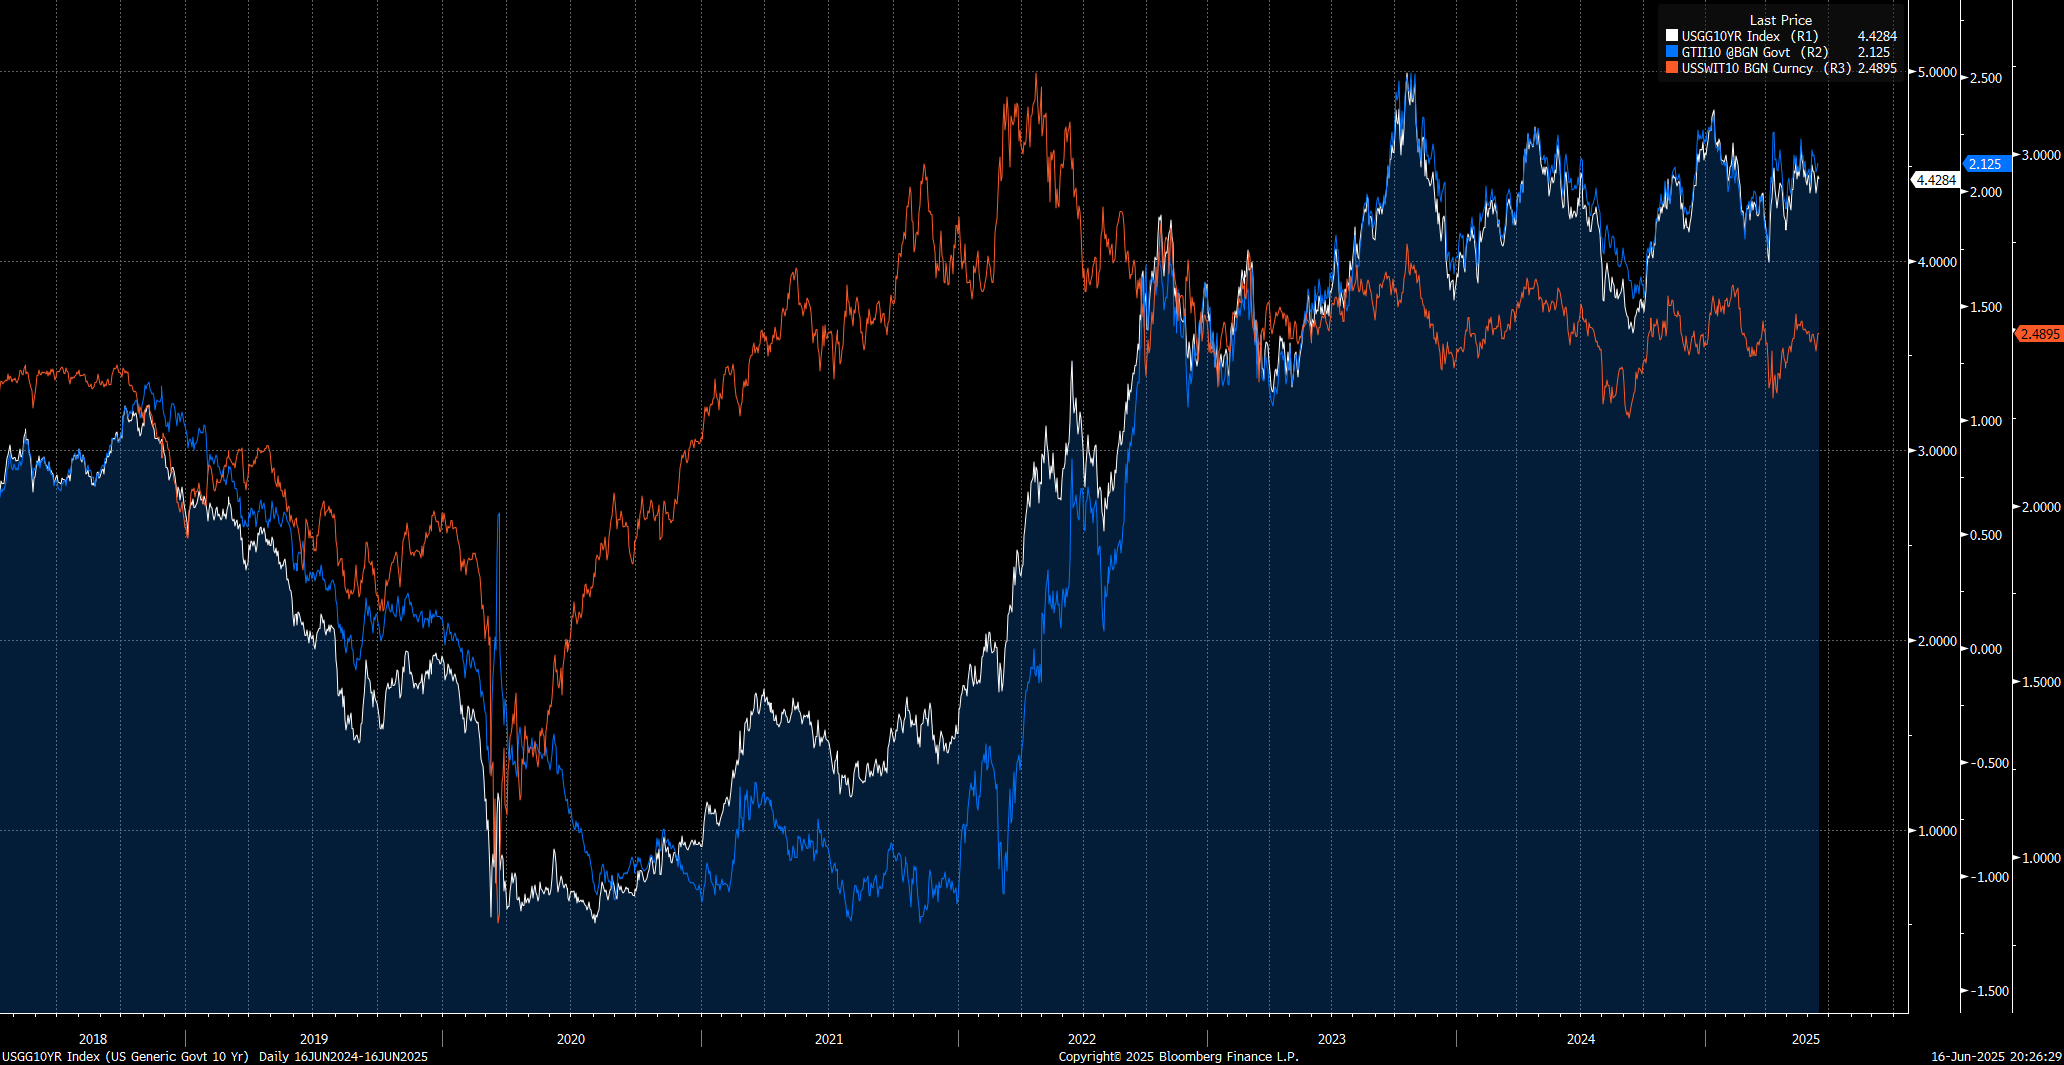
Here is the progression of events in the chart above:
Q1 2020 crash
Nominal 10-year: collapses below 1 %
Real 10-year: dives to record –1 %
Breakeven inflation (π e): deflates with growth fears
Macro regime: COVID shock, flight-to-quality, Fed QE
H2 2020 – 2021 reflation
Nominal 10-year: grinds back toward 2 %
Real 10-year: remains deeply negative
Breakeven inflation: jumps from <0.5 % to >2.5 %
Macro regime: fiscal surge, vaccine rollout
2022 policy pivot
Nominal 10-year: spikes above 4 %
Real 10-year: climbs from –1 % to ≈ +1.5 %
Breakeven inflation: peaks near 3 %, then stalls
Macro regime: fastest Fed hikes in 40 yrs, QT, energy shock
2023 – 2024 restrictive plateau
Nominal 10-year: oscillates 3.5 – 4.5 %
Real 10-year: holds around 2 %
Breakeven inflation: cools to 2.3 – 2.6 %
Macro regime: slower CPI prints, re-anchored expectations
Today (16 Jun 2025)
Nominal 10-year: ≈ 4.43 %
Real 10-year: ≈ 2.13 %
Breakeven inflation: ≈ 2.49 %
Macro regime: higher perceived neutral real rate, anchored inflation prospects
Macro Liquidity:
Interest rates are how we quantify WHAT is taking place in the macro regime on a nominal and real basis. Here is a chart of 1 year inflation swaps and then the 1 year interest rate. The goal of this chart is to see if the Fed is holding rates ABOVE or BELOW short-term inflation expectations. The stronger that growth is in the economy, the wider the spread the Fed can hold between short-end rates and inflation expectations.
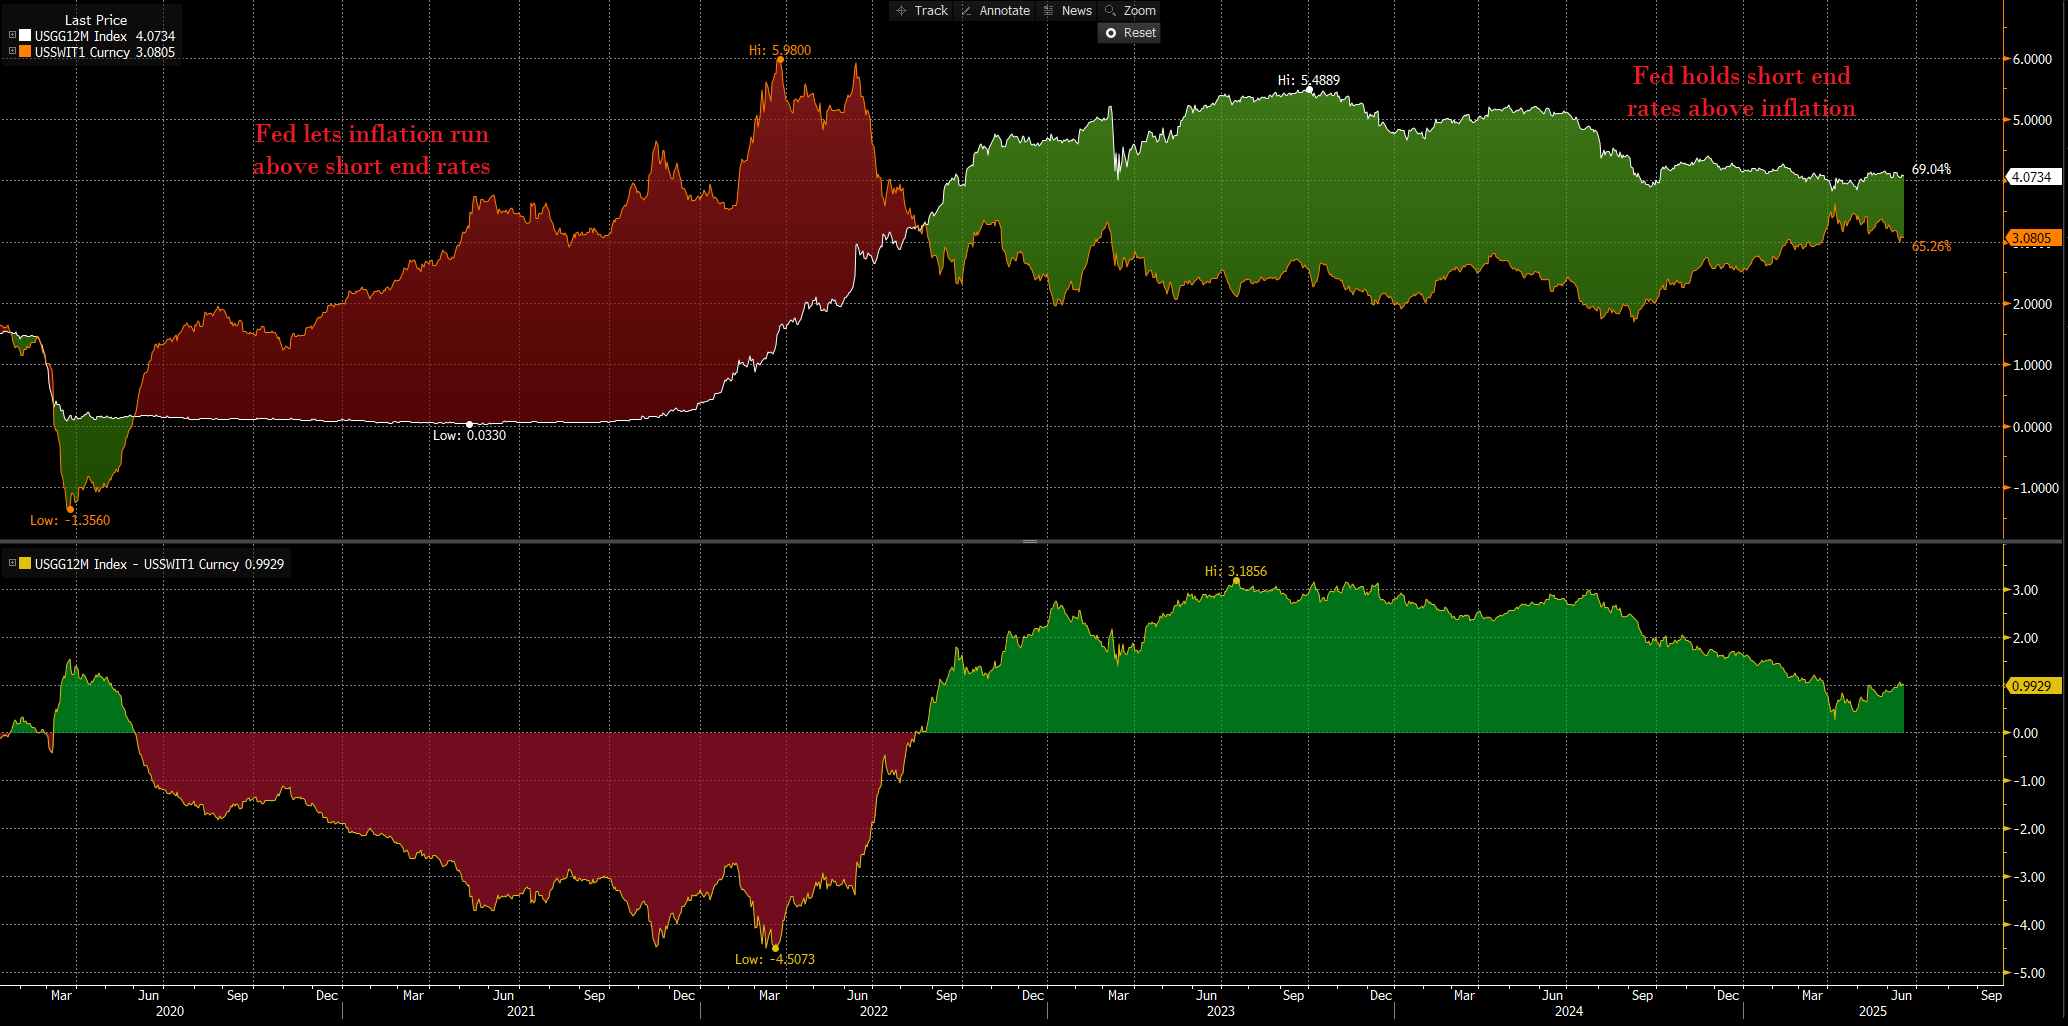
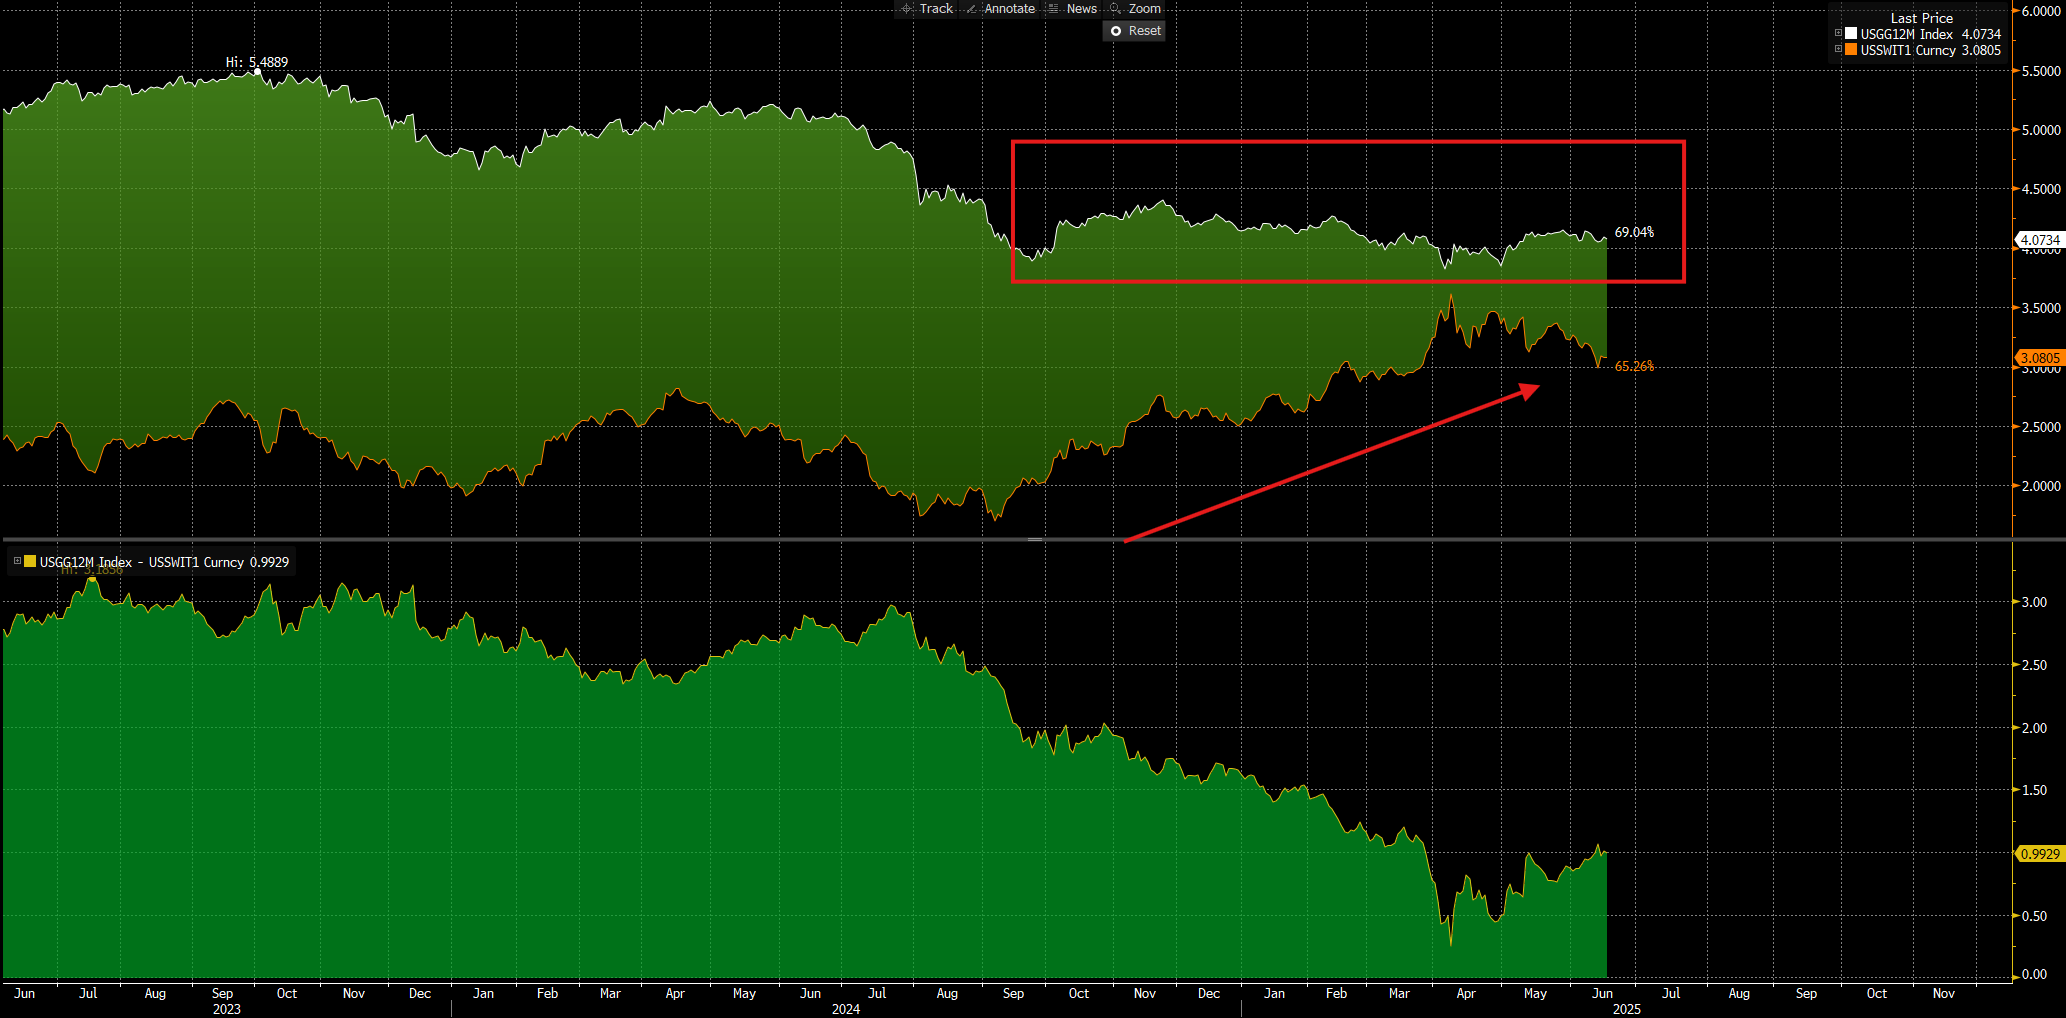
Now you will notice that the Fed has functionally been neutral in its stance toward inflation, even as inflation swaps have been trending up for almost a year now.
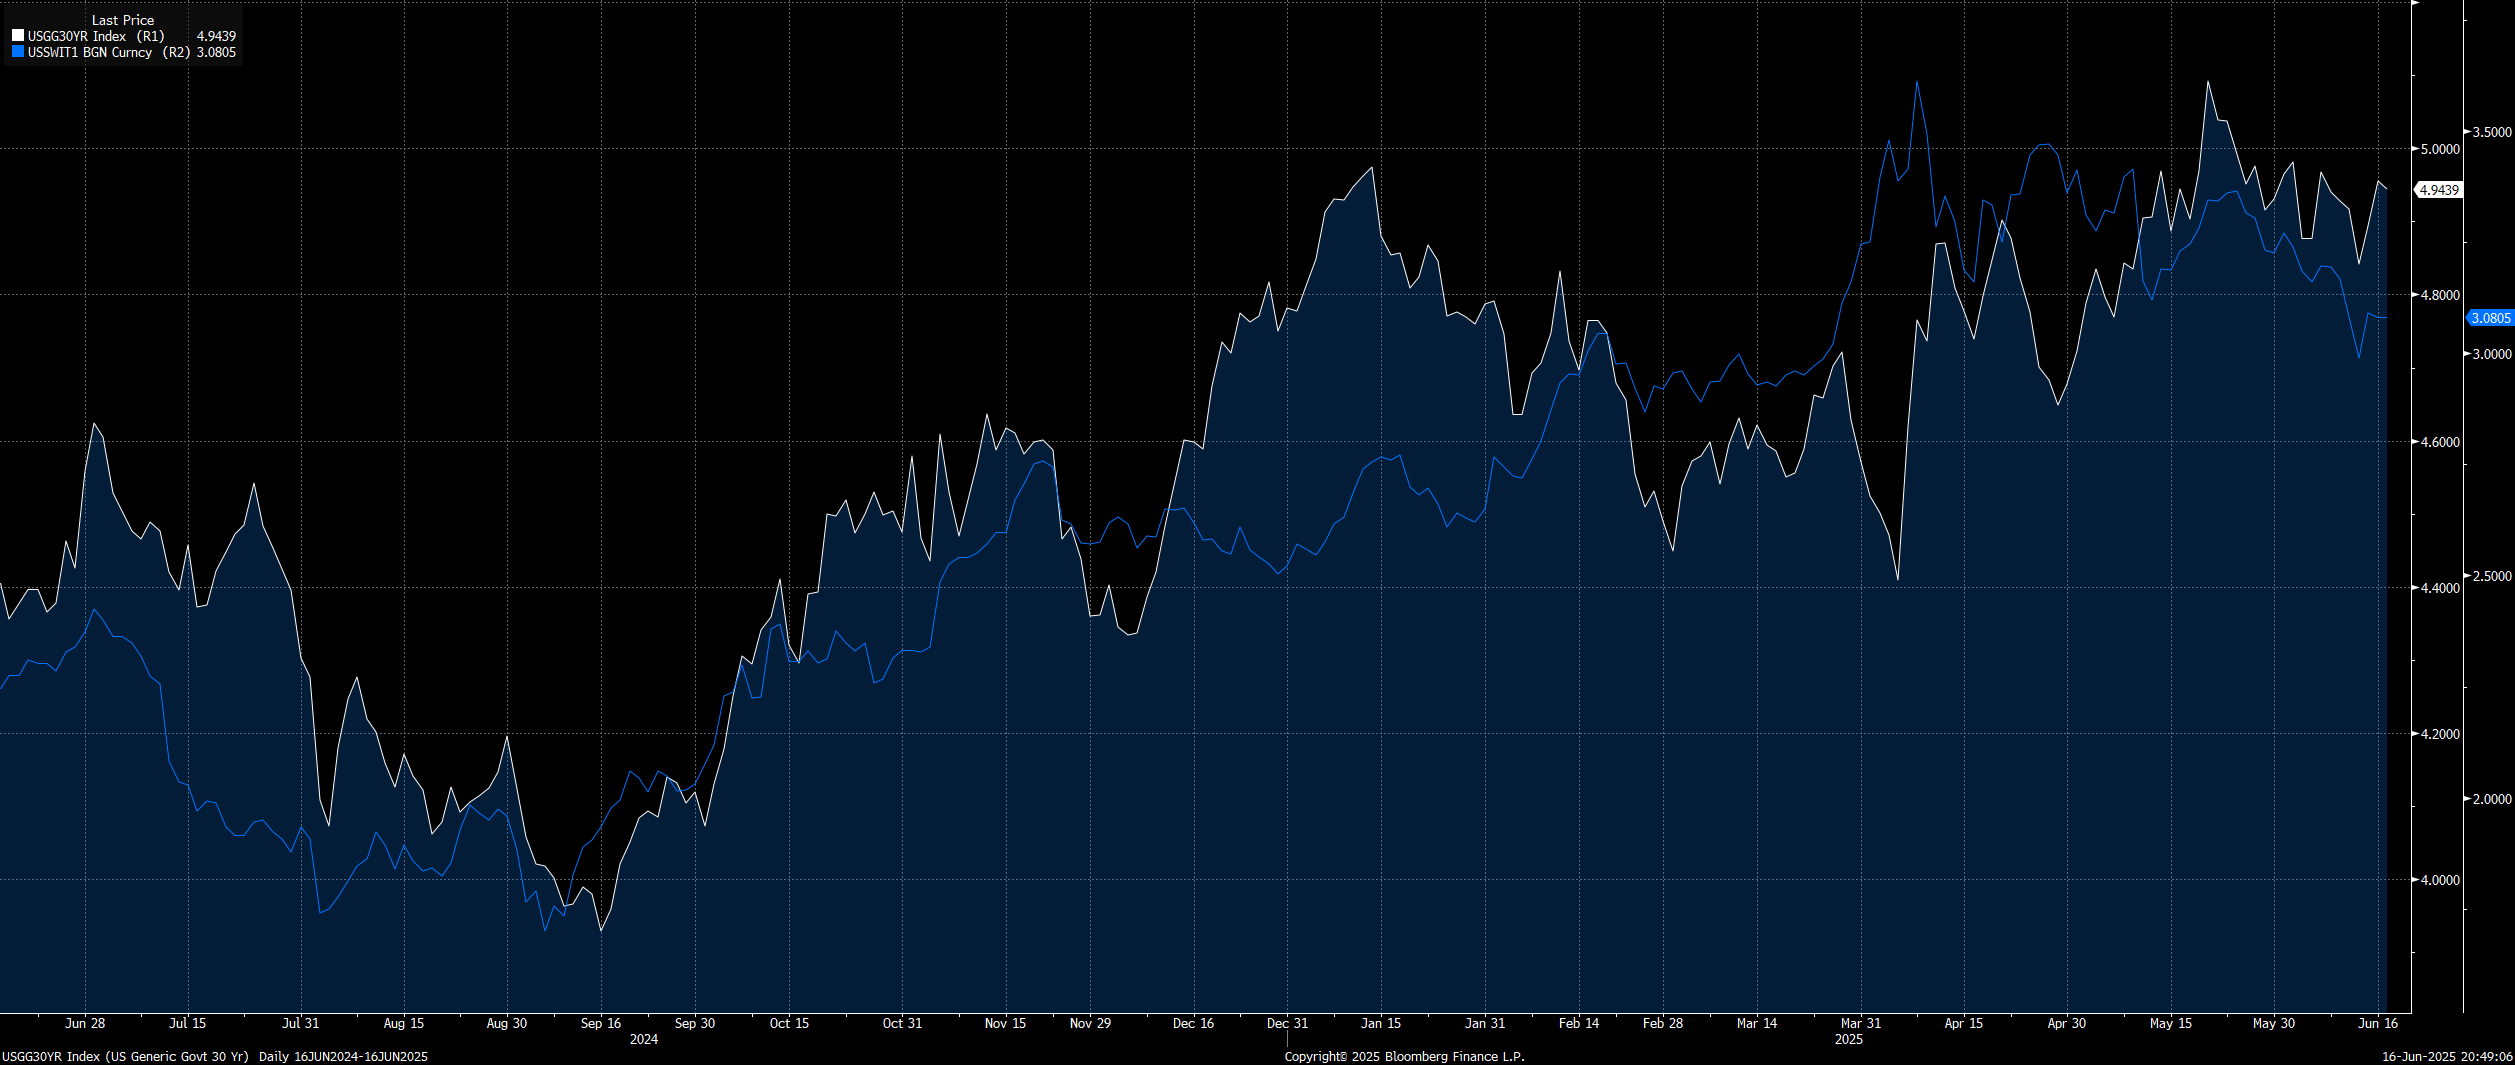
When the Fed turns neutral as growth and inflation accelerate, the long end of the curve reflects the inaction of the Fed by moving higher. This is exactly what we have seen as 1 year inflation swaps (blue) rise and 30 year interest rates are higher since July of last year.
Now, how does this connect to equities, the credit cycle, and the risk curve of assets?
Macro Liquidity and The Credit Cycle:
Keep reading with a 7-day free trial
Subscribe to Capital Flows to keep reading this post and get 7 days of free access to the full post archives.