

Interest Rates Primer
The complete guide for thinking about rates and complex systems

The Big Picture:
I remember when I first started studying why interest rates were important. It was one of the most eye-opening experiences of my life. I originally thought interest rates were irrelevant yields that the boring parts of portfolios were made of. Stocks were always where the cool kids were making money. After conducting a historical study of interest rates, I realized that nations can (and do!) rise and fall because of interest rates.
When I began to understand interest rates in their larger context, I recognized they are the asymmetrical linchpin on which the entire financial system turns. I also began to realize that the traders who understood the most about the economy and financial markets were specialists in rates and FX. Global macro in its purest form is interest rates and FX.
After the significance of rates clicked for me, I decided to start the journey of specializing in rates and the FX market. As you will see, the rates and FX market are intricately linked. These markets are incredibly attractive for individuals with high intellectual curiosity because there is so much to learn. To this day, I learn something new or refine my current understanding of these markets every month. I literally have a spreadsheet with notes where I categorize everything I learn and sometimes even unlearn.
In my view, the goal of learning isn’t to know everything and “arrive.” Instead, one’s goal should be to set a correct foundation from which you can build and refine. The biggest setbacks in markets typically come from realizing you had a wrong idea about how something worked as opposed to being stopped out of a trade for the right reason.
This article is meant to be a breakdown of resources, identification of all variables, interpretive logic for said variables, and strategy development for extracting returns in the rates market.
The beautiful thing about interest rates is that they are a reflection of and direct input into the unique macro environment. The informational edges you can develop in today’s environment require greater degrees of sophistication than in the past. This is clearly evidenced by the fact that many alphas from before 2000 have become betas in today’s environment.
If you are completely new to the interest rate market then this will provide you with a clear path forward. If you have more experience trading in the rates and FX market then hopefully the insights and resources will spark creativity in your learning journey.
Structure:
Intro For Fundamental Ideas:
Resources:
Variables:
Interpretive Logic for Varaibles:
Strategy For Extracting Returns: Alpha
Intro For Fundamental Ideas:
When we approach any domain to conduct analysis for the purpose of action (the opposite of what the media does), source research is critical! I did an entire podcast on how to think about this here:
Reading, Research and Being Exceptional

Hello everyone, I recently shared a tweet of my workspace/library: https://twitter.com/Globalflows/status/1762198934469153012 At your request, here is the breakdown of how I think about reading and research:
As I stated in the podcast, you want to start by aggregating all of the moving parts and all relevant literature on the topic.
Given the degree of liquidity in financial markets and the amount of derivatives, starting this process correctly is the most important thing we can do.
In the information age, you simply need to be at the right place, at the right time, with the right information to succeed
In markets (and life), there is a high degree of noise that distracts most people. There will always be a piece of information that one of your preconceived biases will want to latch onto as if it is reality. The goal is to critically think through these resources and variables in order to come to conclusions that contain a specific TYPE of quality.
“Clear thinker” is a better compliment than smart
-Naval
Resources:
The resources for rates will contextualize the variables I list and categorize below. Remember, once you begin to see the same ideas and references over and over in the materials you are reading, you will then begin to have a reasonable understanding of the relevant literature that exists in a domain.
Books:
Intro books to macro as they relate to rates:
Fixed Income Focused Books:
Fixed Income Strategy: A Practitioner's Guide to Riding the Curve
Trading the Fixed Income, Inflation and Credit Markets: A Relative Value Guide
Fixed Income Trading and Risk Management: The Complete Guide (Wiley Finance)
Fixed Income Markets and Their Derivatives (Academic Press Advanced Finance)
Trading Fixed Income and FX in Emerging Markets: A Practitioner's Guide (Wiley Finance)
The Advanced Fixed Income and Derivatives Management Guide (The Wiley Finance Series)
Systematic Fixed Income: An Investor's Guide (Wiley Finance)
Fixed Income Securities: Tools for Today's Markets (Wiley Finance)
Investing in Fixed Income Securities: Understanding the Bond Market
FX and Banking Focus:
Foreign Exchange: Practical Asset Pricing and Macroeconomic Theory
Inside the Currency Market: Mechanics, Valuation and Strategies
Currency Strategy: The Practitioner's Guide to Currency Investing, Hedging and Forecasting
Eurozone Focused:
The Handbook of European Fixed Income Securities (Frank J. Fabozzi Series)
Euro area interest rate swaps market and risk-sharing across sectors
Bonus Book:

Academic Papers:
Interest Rate Papers:
https://papers.ssrn.com/sol3/papers.cfm?abstract_id=3232721
https://papers.ssrn.com/sol3/papers.cfm?abstract_id=1709636
https://papers.ssrn.com/sol3/papers.cfm?abstract_id=2136820
https://papers.ssrn.com/sol3/papers.cfm?abstract_id=637481
https://papers.ssrn.com/sol3/papers.cfm?abstract_id=1458006
https://papers.ssrn.com/sol3/papers.cfm?abstract_id=292979
https://papers.ssrn.com/sol3/papers.cfm?abstract_id=966227
https://papers.ssrn.com/sol3/papers.cfm?abstract_id=92568
https://papers.ssrn.com/sol3/papers.cfm?abstract_id=809346
https://papers.ssrn.com/sol3/papers.cfm?abstract_id=3385579
https://papers.ssrn.com/sol3/papers.cfm?abstract_id=2055346
https://papers.ssrn.com/sol3/papers.cfm?abstract_id=1851854
https://papers.ssrn.com/sol3/papers.cfm?abstract_id=1738401
https://papers.ssrn.com/sol3/papers.cfm?abstract_id=2242280
https://papers.ssrn.com/sol3/papers.cfm?abstract_id=2281808
https://papers.ssrn.com/sol3/papers.cfm?abstract_id=2838667
https://papers.ssrn.com/sol3/papers.cfm?abstract_id=2005178
https://papers.ssrn.com/sol3/papers.cfm?abstract_id=38460
https://papers.ssrn.com/sol3/papers.cfm?abstract_id=1340854
https://papers.ssrn.com/sol3/papers.cfm?abstract_id=982
https://www.newyorkfed.org/research/capital_markets/ycfaq#/
https://www.newyorkfed.org/research/current_issues/ci12-5.html
https://www.aqr.com/Research-Archive/Research/White-Papers/What-Drives-Bond-Yields
http://csinvesting.org/wp-content/uploads/2015/03/A-Guide-to-the-Swap-Market.pdf
Inflation Papers:
https://academic.oup.com/ooec/article/doi/10.1093/ooec/odac008/6698713
https://www.imf.org/en/Publications/WP/Issues/2017/11/13/Global-Trade-and-the-Dollar-45336
https://www.imf.org/en/Publications/WP/Issues/2016/12/30/Fiscal-Deficits-and-Inflation-16352
https://www.imf.org/en/Publications/WP/Issues/2016/12/30/Exports-Inflation-and-Growth-2337
https://www.imf.org/en/Publications/WP/Issues/2016/12/30/On-Credible-Disinflation-1066
https://www.imf.org/en/Publications/WP/Issues/2016/12/30/Are-Prices-Countercyclical-839
https://www.imf.org/en/Publications/WP/Issues/2016/12/30/Asymmetry-in-the-U-S-1872
https://www.imf.org/en/Publications/WP/Issues/2016/12/30/Inflation-Targeting-Regimes-16239
https://www.imf.org/en/Publications/WP/Issues/2016/12/31/U-K-20945
https://www.imf.org/en/Publications/WP/Issues/2016/12/31/U-S-19378
https://www.imf.org/en/Publications/WP/Issues/2016/12/31/What-is-Keeping-U-S-44047
https://www.imf.org/en/Publications/WP/Issues/2016/12/31/Does-Money-Matter-for-U-S-21744
https://www.imf.org/en/Publications/WP/Issues/2016/12/31/Recent-Dynamics-of-Crude-Oil-Prices-20195
https://www.imf.org/en/Publications/WP/Issues/2020/11/13/Inflation-Expectations-in-the-U-S-49815
https://www.imf.org/en/Publications/WP/Issues/2019/12/27/U-S-48770
https://www.imf.org/en/Publications/WP/Issues/2019/08/23/The-Negative-Mean-Output-Gap-48605
https://www.imf.org/en/Publications/WP/Issues/2022/04/29/Shocks-to-Inflation-Expectations-517437
https://www.bis.org/publ/work647.htm
https://www.bis.org/publ/econ24.htm
https://www.bis.org/publ/work1152.htm
https://www.bis.org/publ/bisbull55.htm
https://www.bis.org/publ/work1082.htm
https://www.bis.org/publ/work1054.htm
https://www.bis.org/publ/work883.htm
https://www.bis.org/publ/work759.htm
https://www.bis.org/publ/work776.htm
https://www.bis.org/publ/work485.htm
https://www.bis.org/publ/work1056.htm
https://www.bis.org/publ/othp30.htm
https://www.bis.org/publ/work1141.htm
https://www.bis.org/publ/bppdf/bispap49.htm
https://www.bis.org/publ/bisbull67.htm
https://www.bis.org/publ/work809.htm
https://www.bis.org/publ/econ11.htm
https://www.bis.org/publ/work980.htm
https://www.bis.org/publ/work713.htm
https://www.bis.org/publ/work623.htm
https://www.bis.org/publ/work895.htm
https://www.bis.org/publ/work1077.htm
https://www.bis.org/publ/arpdf/ar2014e3.htm
https://www.bis.org/publ/work896.htm
https://www.bis.org/publ/work185.htm
https://www.bis.org/publ/bppdf/bispap89.htm
https://www.bis.org/publ/bppdf/bispap03.htm
https://www.bis.org/publ/bisbull47.htm
https://www.bis.org/publ/bppdf/bispap89b_rh.pdf
https://www.bis.org/publ/work1028.htm
https://www.bis.org/publ/qtrpdf/r_qt2103x.htm
https://www.bis.org/publ/bisbull28.htm
https://www.bis.org/publ/bppdf/bispap142_a_rh.pdf
https://www.bis.org/publ/bppdf/bispap89n.pdf
https://www.bis.org/publ/work196.htm
https://bis.org/publ/bisbull48.htm
https://www.bis.org/publ/work1077.pdf
https://www.bis.org/publ/bppdf/bispap77.htm
https://www.bis.org/publ/work1047.htm
https://www.bis.org/publ/confp04.htm
https://www.bis.org/publ/bppdf/bispap133.htm
https://www.bis.org/publ/arpdf/ar2022e2.htm
https://www.bis.org/publ/bisbull60.htm
https://www.bis.org/publ/bisp05.htm
https://www.bis.org/publ/bisbull82.htm
https://www.bis.org/publ/work602.htm
https://www.bis.org/publ/work1114.htm
https://www.bis.org/publ/work582.htm
https://www.bis.org/publ/work427.htm
https://www.bis.org/publ/othp78.htm
https://www.bis.org/publ/work789.htm
https://www.bis.org/publ/work464.htm
https://www.bis.org/publ/work688.htm
https://www.bis.org/publ/work791.htm
https://www.bis.org/publ/econ24.htm
https://www.bis.org/publ/econ11.htm
https://www.bis.org/publ/econ3.htm
https://papers.ssrn.com/sol3/papers.cfm?abstract_id=3813202
This is a great video on inflation: https://www.atlantichousegroup.com/post/seminar-series-what-the-derivatives-market-is-telling-us-about-inflation
Papers on Carry:
https://papers.ssrn.com/sol3/papers.cfm?abstract_id=3325720
https://papers.ssrn.com/sol3/papers.cfm?abstract_id=2695101
https://papers.ssrn.com/sol3/papers.cfm?abstract_id=2357894
https://papers.ssrn.com/sol3/papers.cfm?abstract_id=2766850
https://papers.ssrn.com/sol3/papers.cfm?abstract_id=2968677
https://papers.ssrn.com/sol3/papers.cfm?abstract_id=2968677
https://papers.ssrn.com/sol3/papers.cfm?abstract_id=3803954
https://papers.ssrn.com/sol3/papers.cfm?abstract_id=2856435
https://papers.ssrn.com/sol3/papers.cfm?abstract_id=2265901
https://papers.ssrn.com/sol3/papers.cfm?abstract_id=2227387
https://papers.ssrn.com/sol3/papers.cfm?abstract_id=2632697
https://papers.ssrn.com/sol3/papers.cfm?abstract_id=2623794
https://papers.ssrn.com/sol3/papers.cfm?abstract_id=3035453
https://papers.ssrn.com/sol3/papers.cfm?abstract_id=2399282
https://papers.ssrn.com/sol3/papers.cfm?abstract_id=2311574
https://papers.ssrn.com/sol3/papers.cfm?abstract_id=2298565
Additional Resources:
The best breakdown on term premium and how to quantify the attribution analysis for rates by Prometheus Research
Macro Alpha Webinar With Prometheus Research

We have a special treat today! I had a conversation with Aahan from Prometheus Research on how the mechanics of interest rates function. We discussed HOW to correctly conduct attribution analysis on interest rates and WHY the steepener trade has positive optionality from here. These types of conversations give you a peak behind the curtain of the multifaceted macro models Prometheus builds.
This is an exceptional guide by 𝐄𝐟𝐟𝐢𝐜𝐢𝐞𝐧𝐭 𝐌𝐚𝐫𝐤𝐞𝐭 𝐇𝐲𝐩𝐞: https://www.docdroid.net/7i5KzXl/the-ultimate-tourist-guide-to-bondistan-pdf#page=3


Citrini’s educational articles on this topic are also a great resource:
Concoda’s educational primers are critical for understanding the plumping of the system and short end: link
Thriddio Asset Management has been a great resource to me personally through our conversations about their articles. I would encourage everyone to read their work.
Paper Alfa’s educational section continues to be a great resource for market practitioners: link
All of the macro primers I have written are here:
Research Synthesis / Direction Of Capital Flows Substack

Hello everyone, There has never been a time in history when understanding the world from a global perspective and interpreting it accurately paid such a high premium. Since the very beginning of this Substack, I have talked about the nature of the time we live in and how to act intentionally in it.
Summary: If all of these resources are studied and understood, you will have a reasonable introduction to interest rates. While it is incredibly helpful to have access to a Bloomberg during this process, there is such a large amount of ground you can cover without one. As I mentioned in the podcast (link), start with a Word doc and begin making lists of all the models you need to build in order to track all of the insights that these resources provide. Fundamentally, you want to breakdown every single part of the interest rate market and conduct a detailed study on each element. Once each part is understood clearly and correctly, you will have greater success in knowing how all the parts interact to make up the whole. In dynamic complex systems, the whole is always greater than the sum of its parts which is why understanding BOTH the parts and their interactions (linear and nonlinear) is the foundation on which you can make 2nd and 3rd order conclusions.
Variables:
Now that we have an introduction to the context and relevant resources for rates, we need to identify all of the major variables and data points. The goal of this section is to show you all of the data points to use when quantifying the interest rate market. To be clear, we have not even gotten to the interpretation of these variables or monetizable alpha. This begins to show you how much prerequisite knowledge is needed for a correct understanding of the interest rate space.
Fundamentally, there are several major data points to analyze in both the outright rates and curves:
Nominal Rates: All nominal rates and all possible combinations of nominal rate yield curves
Real Rates: All real rates and all possible combinations of real rate yield curves
Breakevens/Inflation Swaps: All breakevens/inflation swaps and all possible combinations of breakeven/inflation swap curves
Forward rates/curve (via SOFR for the United States for our purposes): All SOFR Swaps/future contracts and all possible combinations of curves. (while SOFR rates are obviously intricately linked to nominal yields, it is helpful to set clear distinctions for the purposes of this article. For more on SOFR, see this book: Link).
Nominal Rates:
3m, 2y, 5y, 10y, and 30y nominal rates are to be monitored in both their outright movements and attribution analysis (we won’t cover 20y in this article). Nominal rate attribution analysis matches the nominal rate with the respective real rate and breakeven (see my notes here: Link).
Monitor all possible curve combinations between these nominal rates.
3m2s Spread
3m5s Spread
3m10s Spread
3m30s Spread
2s5s Spread
2s10s Spread
2s30s Spread
5s10s Spread
5s30s Spread
10s30s Spread
These curve combinations are to be delineated into 4 regimes: bull steepening, bear steepening, bull flattening, and bear flattening. Begin to connect how the outright nominal rate attribution and the macro regime are intricately linked with the yield curve regimes.
This same process of outright rate attribution, curve combinations, and curve regimes is to be applied to real rates, breakevens/inflation swaps, and the forward curve.
What you will begin to notice is how different curve regimes occur on different duration curves. This is key!
Breakevens/Inflation Swaps:
When analyzing expectations of inflation, you need to connect the market’s implied expectations with the underlying inflation data. You accomplish this by analyzing inflation and all its line items as they are impacting both the short end and long end of the inflation swaps curve.
For example, here is the forward curve of the market-implied inflation path to April 2025 via inflation swaps. After analyzing CPI, we can begin to ask if the market’s pricing of the direction, level, and/or speed is reasonable.

The inflation expectation component is directly connected with inflation data. Here is a chart of inflation swaps and CPI (core and headline):

The main idea here is that you want to connect the outright inflation swap contracts with inflation data. Additionally, you want to connect inflation swap curves with inflation data:
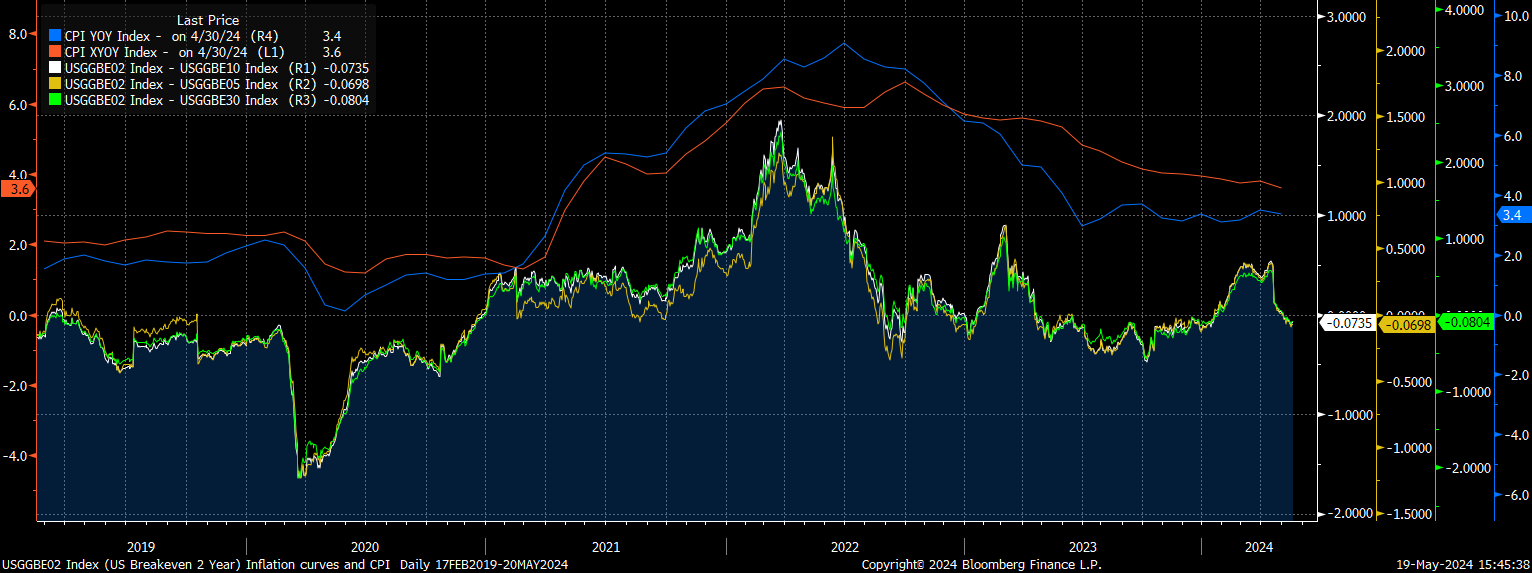
When analyzing the direction, level, and speed of inflation, you want to connect it with the outright and inflation swap curves.
To recap, inflation expectations are a critical input into nominal rates. Inflation expectations are reflected in inflation swaps or breakevens. These instruments directly connect with underlying inflation data. From here, we are going to breakdown the inflation line items and datasets. There are three major datasets for inflation: CPI, PCE, and PPI. We know these are the major datasets for four reasons: First, the Fed consistently draws attention to them for their decisions. Second, the market pays incredibly close attention to them as evidenced by price action during these releases. Third, market instruments settle based on CPI. Fourth, these datasets are all used to nowcast each other since their releases are at different times throughout the month. (there is additional evidence into why these are good metrics for tracking actual inflation in the economy but this is outside the scope of this article).
When analyzing these datasets, we typically break them into core components and headline components.


Most rate traders conduct the following in order to develop a reasonable view of inflation data:
Run basic quantitive metrics on the headline data, core data, and major line items: This could be as simple as moving averages, rate of changes, and median lines. In today’s world, most hedge funds are running a bit more sophisticated models to take into account views on each line item and the base effects that are likely to occur depending on where we are in the trend and where MoM data is running. Additionally, the speed at which the data is moving can create expectations of how long it will take inflation to reach a specific level. For example, if core inflation is decelerating at 20bps a month, it will reach 2% much faster than if it was only decelerating at 10bps a month. You can run these types of linear extrapolations in ChatGPT (link).

Develop an informational edge on the line items causing the largest attribution of the move. For example, when a large stdv move in inflation is occurring, there will typically be supply and demand imbalances in specific line items. Conducting research on these sectors and determining how the imbalances will impact prices can help provide insight that a quantitive model can’t. The key to this is ensuring that your view of the imbalances in the line item are actually transmitted through to the data. If it doesn’t transmit through to the actual CPI data, the view doesn’t matter. Some people will say the view still matters and the data is wrong. First, this in itself is a view. Second, it will only have validity if the points I noted above about why these datasets matter begin to break down.
Here are two articles I wrote where I shared basic CPI and economic data models:
The Research HUB: CPI Excel Model

One thing I promised you was that I would be sharing some economic data models. Economic data is the key to obtaining a granular view of the economy and having clear visibility of what is happening. Here is a CPI model breaking down the components of the consumer price index:
THE Model for taking bets in markets (and life)

If you are new to the Substack welcome to the journey. We are moving fast but I promise no one will be left behind. You are going to want to read this article to the end because I will be sharing THE Model for taking bets in markets and life. Social media will throw heuristics at you but never actually break down the principle for taking bets. Rarely d…
Finally, traders are always trying to nowcast these datasets with other datasets.
What is a nowcast? Nowcasting economic or inflation data involves predicting the current state of the economy using real-time data. It utilizes statistical models to analyze current information, such as financial markets, surveys, and high-frequency indicators. Unlike traditional forecasting, which relies on historical data to predict future conditions, nowcasting provides an up-to-date snapshot of the present economic situation. This approach aims to show the immediate state of the economy rather than forecasting long-term trends.
Here is a chart of the Bloomberg nowcast of CPI (white), actual CPI data (blue), Clevland Fed nowcast of CPI (pink), rolling 1m inflation swaps (orange), and 1 year inflation swaps (purple).

The main idea here is that traders are trying to utilize other datasets that have visibility into the movement of prices AND a high correlation to CPI, PCE, or PPI. For example, the Michigan Inflation expectations or ISM prices are likely to be used in order to gain visibility into inflation data. However, these types of secondary data have less of an impact on bonds during the releases for a reason. Traders hedge into CPI during higher inflation regimes but are unlikely to put on hedges into an ISM print. Releases like the ISM price data do have lower quality and more noise than CPI data as well.
We have identified that all nominal rates, real rates, breakevens/inflation swaps, and forward rates should be analyzed and monitored in both their outright and all combinations of the curves. All of these outrights and curves (when correctly delineated into respective curve regimes) should be compared against underlying inflation data analysis. Additionally, the spread between real rates and inflation data as well as Fed funds and inflation data should be mapped against growth.
From here, we have a connection between the market variables and inflation data. What about growth though? Defining the relationship between growth and inflation goes beyond the scope of this article. However, they are intricately linked and the spread between Fed funds and inflation should be monitored in connection with growth and credit risk.
Below is Fed Funds minus CPI and PCE with the GDP-nowcast and economic surprise indices in the lower panels.

The primary idea behind comparing outright rates with inflation and then comparing them with growth metrics is that all growth, inflation, and liquidity dynamics in the system will always be reflected somewhere. Any action or inaction by the Fed as it relates to the macro environment will always be reflected in one of the outright rates or curves noted above. Every part of the rate complex exists to function as a “risk release valve” of sorts where risk and macro flows are expressed with specificity.
Main idea to remember for the relationship between growth and inflation is that typically growth sets the preconditions for inflation. For example, if a recession is occurring (real demand and output in a negative feedback loop) then this is likely to put downward pressures on prices. Fundamentally though, inflation is the release valve between nominal demand and real output. Quantifying each of these components in their moving parts is how you begin to obtain visibility into the relationship between growth and inflation.
Catalysts:
Any system typically has embedded catalysts that function as points in time where specific information moves across the spectrum of uncertainty to certainty. Traders in markets use these catalysts to readjust their expectations and exposures. For the US rate complex, there will be the typical flow of economic data where CPI, PPI, PCE, and NFP hold higher significance. While we will go over how to use these variables later on, the following catalysts need to be monitored:
All economic data: See CME Tool or Tradingview for the full calendar.
All FOMC meetings, announcements, and releases: https://www.federalreserve.gov/default.htm
All Treasury news regarding the issuance and composition of issuance: Link
All government auctions: Again found on the CME Tool
After you have identified all of the catalysts for rates and categorized them by their relevance, you can begin to delineate these releases into the following regimes:
Data release above, below, or in line with expectations?
Price action initial response: bullish, bearish, or neutral? What degree of stdv?
Does price action exhibit mean reversion after data release into the next period of high volume (such as another catalyst several hours later, a settlement of future contracts the same day, or simply a globex session)?
These catalysts function as points in time where there is the potential for a higher degree of signal to be extracted. These catalysts can begin to show you the response of positioning to information. The main goal in analyzing catalysts in this manner is to correctly interpret what information is priced in or implied in traders’ positioning. Contextualizing catalysts and timeseries with scenario analysis is the foundation by which you can extract returns with proper risk management.
Volatility:
The final variable to monitor is how the options market is pricing implied vol, skew, and the term structure.


Additional variables to take note of:
Running quantitative signals on rates is an important process as well and noted in the papers above. See this article I wrote on regime identification: Link
Monitoring the rate complexes of other countries is important as well but outside the initial scope of this article.
ETF flows (for example leverage ETF flows vs non-leverage or futures open interest) and open interest on ETFs can provide value during specific periods of time. However, it is difficult to model the signals around these correctly because they always need to be interpreted in the context of how the financial product landscape is changing.
Summary of variables: These are the tangible variables that are used when analyzing and trading in the fixed-income space. While there is more depth to each of these as the handbook by Efficient Market Hype notes (𝐄𝐟𝐟𝐢𝐜𝐢𝐞𝐧𝐭 𝐌𝐚𝐫𝐤𝐞𝐭 𝐇𝐲𝐩𝐞: https://www.docdroid.net/7i5KzXl/the-ultimate-tourist-guide-to-bondistan-pdf#page=3), this contextualizes the space.
Thus far we have covered the introduction, a comprehensive breakdown of relevant literature, and all the major variables for the rate space. Understanding each of these will be critical for interpreting how these variables fit together. It is only when we have the proper foundation of knowledge that experience in the market has an exponential payout.
Interpretive Logic for Varaibles:
All of us have the same data and markets to trade. Many people watch the variables I noted above daily and still do not understand how to interpret them correctly. Just because you can tell the time on a watch, doesn’t mean you know how a clock works, much less how to make a clock.
The nature of markets is that it’s not just about how hard you work but also the quality and clarity of your thinking.
“Clear thinker” is a better compliment than smart
-Naval
When thinking about the interpretive principles you employ to analyze variables, they must be based on the nature and characteristics of the system. There are several resources and principles to go over:
Resources:
The Origin Of Wealth: This is a very simple and basic intro to complexity economics and adaptive systems.
Santa Fe Institue: Great intro courses
If the math is intimidating to you, read this article I wrote: link
Complexity Principles:
Analyze Reflexivity:
Focus on positive and negative reflexivity, which refers to the degree of reflexivity rather than simply market direction (up or down). Observe whether reflexivity is increasing or decreasing and how it changes across different market regimes, reflected by correlations and strength of impulses.
Nonlinear Moves in Complex Systems:
Expect nonlinear movements in complex systems.
Evolutionary Process of Variables:
Variables undergo an evolutionary process: differentiation, selection, and amplification, leading to S-curve adoption. Complex systems tend to have skewed distributions. Early in the adoption cycle, there is more asymmetry, which magnifies the differences between agents.
Constant Change in Energy Flows and Terrain:
Both energy flows and the terrain are constantly changing.
Feedback Loops:
A feedback loop occurs when the output of one part of a system becomes the input for another.
Positive Feedback Loop: Reinforces, accelerates, or amplifies changes, leading to exponential growth, collapse, or oscillations with increasing amplitude.
Negative Feedback Loop: Dampens changes, controlling and bringing the system back into line. It pushes in the opposite direction, leading to equilibrium or oscillations with decreasing amplitude.
Time Delays in Dynamic Systems:
Time delays in dynamic systems cause overshooting and oscillations around a desired goal. Over time, oscillations decrease until the goal is met. Longer time delays make it harder to control the system, leading to more oscillations.
Complexity in Dynamic Systems:
Dynamic systems become complex when multiple stocks and flows interact through both positive and negative feedback loops. Positive feedback loops drive the system, while negative feedback loops dampen and control it. Time delays can cause the driving and dampening forces to become unbalanced, leading to intricate oscillations.
Sensitivity to Initial Conditions:
Nonlinear dynamic systems are sensitive to initial conditions. Small differences in starting points can be magnified over time, making these systems path-dependent. Any changes in the chain of events can lead to very different outcomes. Sensitivity to initial conditions and path dependence make nonlinear dynamic systems difficult to manage and often unpredictable.
In my experience, “business cycles” can be retrospectively descriptive but path dependency is the rule for operating under uncertainty and with foresight. This means that you are never taking a deterministic view of cycles but always orienting yourself toward being in confluence with the path dependency.
Principles on opportunity and operation in a complex system:
The primary goal you are trying to accomplish is to correctly define asymmetry and actually recognize it when it occurs. Just because you think a specific variable in a system has asymmetry in what is likely to take place doesn’t mean it actually does. We don’t have time to go over the importance of taking bets (see my work here: Link) but fundamentally you need asymmetry in your bets in order to make your success inevitable.
The primary way to identify opportunity (in this context asymmetry) is to find where agents are incorrectly interpreting the temporal probabilities of a variable. This occurs when agents’ perception of what is unseen deviates from the temporal probabilities due to overestimation or focus on what is seen. Fundamentally, the market is a mechanism by which agents can offload or inventory risk. Risk implies some type of future uncertainty (depending on how we define risk of which there are too many definitions in academic literature). The market is always implying some type of future with the information it is pricing. However, many times market participants are overexposed to volatility, uncertainty, randomness, chaos, and dispersions of outcomes. It is this exposure linked to the misperception that creates opportunity for a trader.
Agents in systems will always overestimate and overweight what is seen, known, and certain. This provides an opportunity for traders who have a clearer view of the system and are willing to constantly orient themselves toward taking on uncertainty and the unseen.
The final thing I will note is that a complex system is always operating with dynamic spatial and temporal changes. This means variables are moving in different directions and dispersions with varying speeds. This is why we have the option market to price each facet of these moves and their timing. As a result, action in this system needs to constantly be sequential and simaltanious which is incredibly difficult. This is part of the reason portfolio managers talk about the different levels of diversification: Asset, strategy, and timeframe.
Summary: The main takeaway you should have from this section is that your goal is to correctly interpret asymmetry. To accomplish this you need to correctly interpret and think about the variables noted above. Knowing the variables exist and watching them isn’t enough, you must correctly combine them. A complex system is always a whole that is greater than the sum of its parts. There will always be opportunities for an individual who can correctly orient their actions across the causality of variables as they are expressed in a timeseries and option Greeks.
Strategy For Extracting Returns: Alpha
Alright, now to the FUN! Let’s bring all of these parts together and synthesize them!
If you have made it this far then you’re probably incredibly motivated or a little insane. Congrats!
Two quick points:
There is obviously a high degree of complexity to the parts I have noted above. On top of this, it takes a lot of work to consistently analyze, monitor, and trade the rates market properly. This is part of the reason I write macro reports and interest rate reports for paid subscribers on here. Interest rates impact everything because it is the hinge on which the entire system turns.
The specific way you generate returns is highly dependent on what you are trying to accomplish. I know some people who just trade SOFR and they put up huge returns every month. I also know people who are just trying to manage their duration risk and credit risk to target reasonable returns. While understanding the ideas above is a prerequisite for both, the extraction of returns will always look different.
Let’s go through several steps to generate a very simple view of rates:
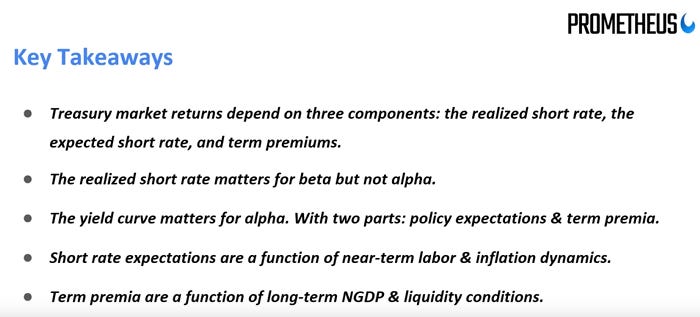
As Prometheus Research noted in our webinar (link): returns are composed of the realized short rate, the expected short rate, and term premiums.
When we analyze the short end, we can look at the 3m2y curve against the direction, level, and rate of change in inflation. The main idea is that depending on where you are with inflation and the Fed’s stance toward it, the market can misprice these tensions. For example, you can see the 2 year aggressively move down in March of 2023 during the SVB crisis and during the end of 2023. This is the market pricing cuts by the Fed and functionally betting that Fed Funds (represented by the 3m rate) will be lower.

The question you need to ask is if the direction, level, and rate of change in inflation justify this pricing by the market. For example, we are unlikely to get further hikes which is a clear discontinuity from 2022 when the 2 year was ABOVE the 3m. However, you need to further refine your view on the actual SPEED and aggressiveness of actions. If the market is pricing an aggressive series of cuts then bonds can still sell off if the Fed does cuts as long as it is less than the market was pricing. (The long end of the curve is going to be a derivative of the short end minus the term premium. This is why watching all outrights and curves is critical. See Prometheus interview for connecting these two parts of the curve).
When you approach rates, it is helpful to align your actions on multiple timeframes: the level and rate of change in inflation determines if bonds are in a momentum or mean reversion regime.
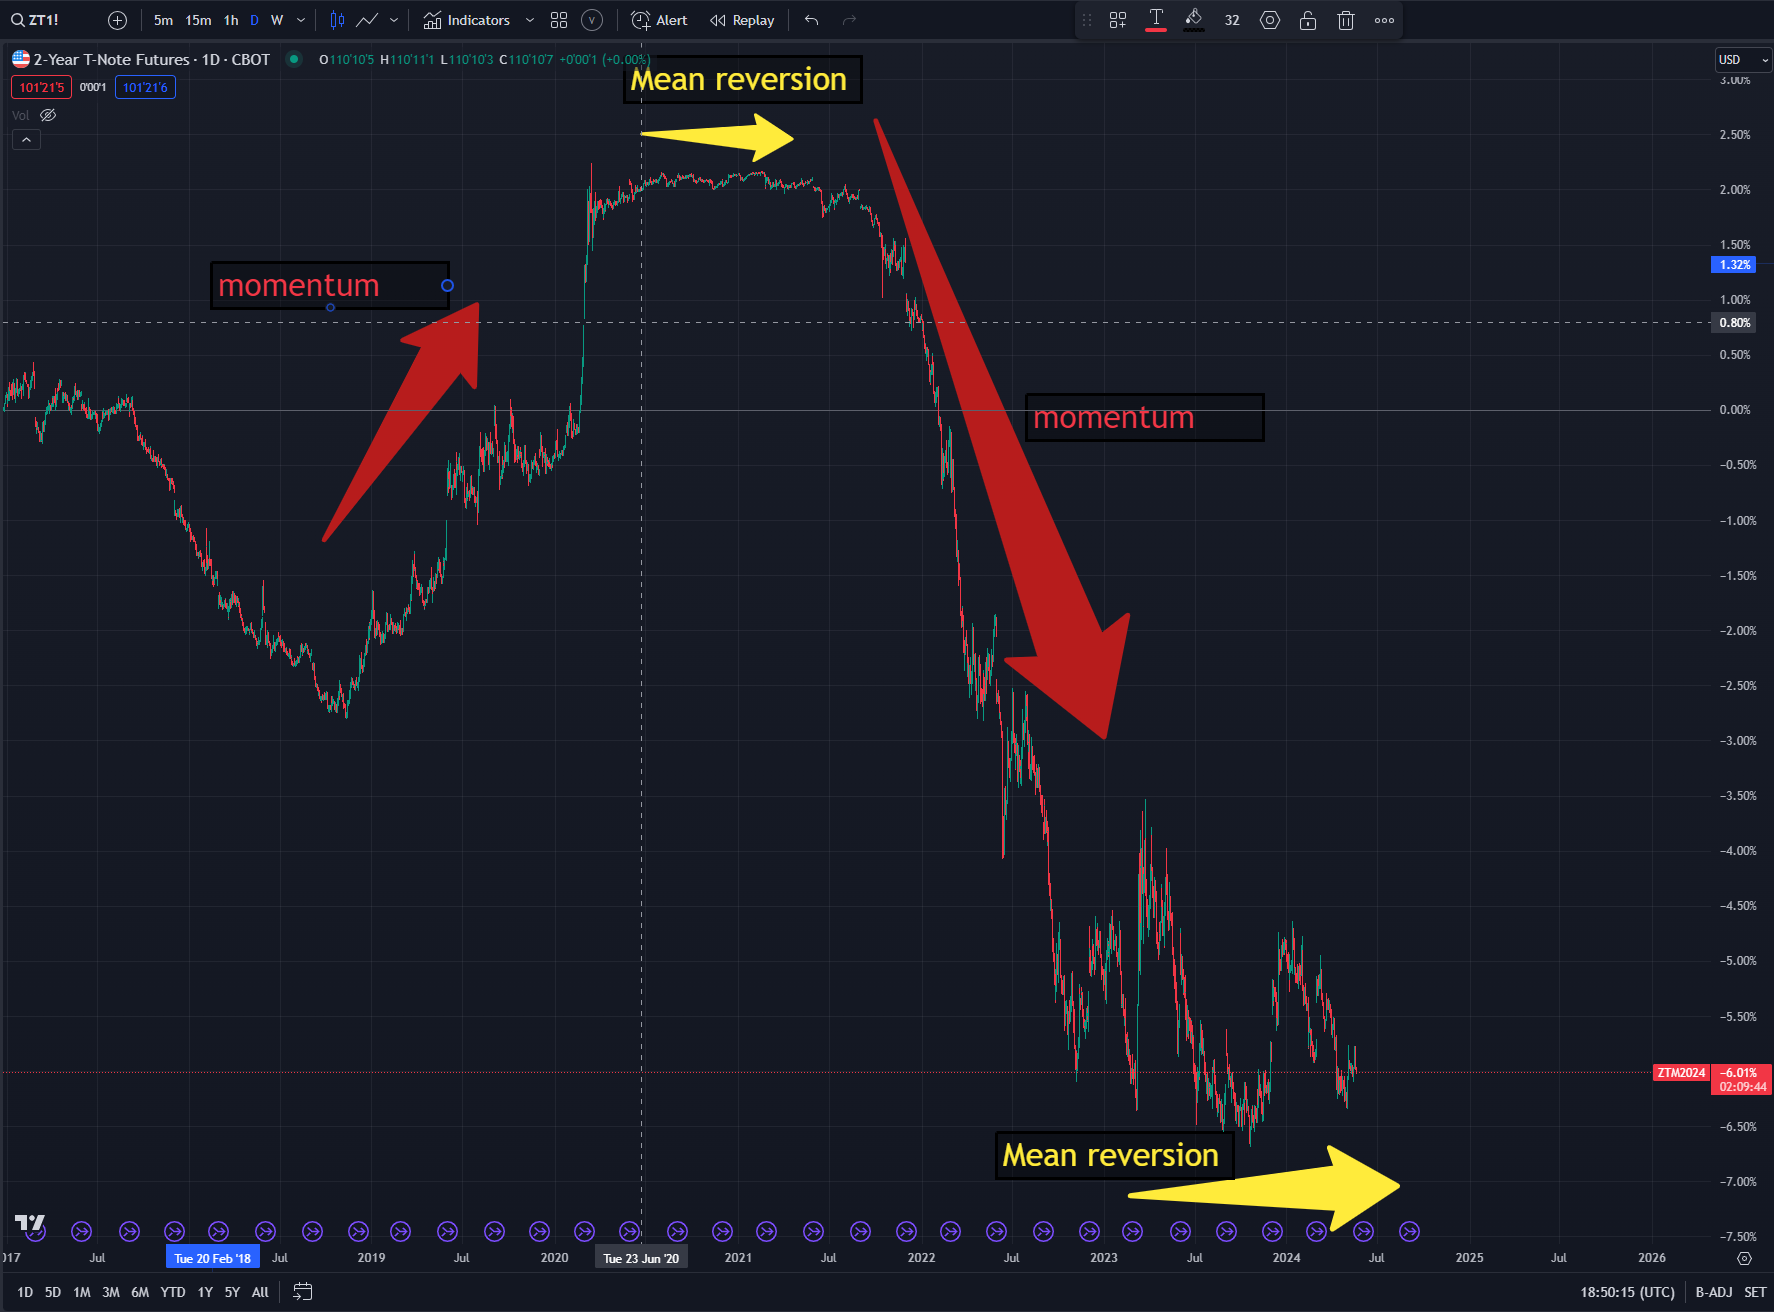
The higher timeframe regimes frame how you take shorter-term views. For example, running longs or shorts in ZT during a mean reversion regime has a higher probability of working than looking for longs when it’s in a bearish momentum regime.
If your perspective aligns with the higher timeframe regime and you identify an opportunity where you believe participants are mispricing something, you can then integrate this view with your scenario analysis and potential catalysts. You need to clearly identify WHY you are being paid to take the risk. If your view is based on information that is already known, your misdiagnosing the situation. There should be something you don’t know but that you still think the market is mispricing. For example, I might have a view like, “I think it’s highly unlikely for inflation to reach x by y period of time and the market is pricing a high probability of it. Theoretically and maybe x could reach y but the risk is mispriced to the extent that it provides reasonable asymmetry for taking the trade.” The clearest trades are when the market is pricing an almost absolute certainty in something because no matter what the outcome, it is unlikely to be whatever is currently priced in.
From here, you want to take the catalysts noted above and determine which ones are likely to confirm or falsify the view you have. As you move forward in time and information incrementally moves across the spectrum of uncertainty to certainty, you will begin to see your view confirmed or falsified. The key is seeing how the market is pricing information and how it changes when it’s either shocked with new information or forced to change its view of information.
It’s important to remember that you are trying to triangulate how the market perceives information. Just because you think something should be priced a certain way doesn’t mean it will. You need to identify where traders are going to be constrained to change their view of the information. This is very explicit in the rate space since there are contracts pricing the actions of the Fed and inflation on clear settlement dates in the future.
Notes on catalysts and execution:
Typically, you don’t want to take explicit views on any single catalyst because it’s a coin toss. Most catalysts and the response in price action are difficult to predict and even more difficult to monetize returns from. However, if the markets’ view of the information is significantly offside (for example during the most recent FOMC meeting with the expectation of a “hawkish pivot”) and the catalysts will explicitly falsify the market’s view then there are scenarios where its reasonable. There must be asymmetry due to an incorrect perception by the market in a larger context that isn’t sole based on the catalyst though.
Isolating the causality of your view is critical in expressing your trade. If you have a view about a specific move or the absence thereof, then expressing it correctly is important. The options market is explicitly pricing the delta, gamma, vega, and theta in connecting with the underlying instrument. The greater precision on the direction (delta), speed (gamma), stdv (vega), and timing (theta), the greater the asymmetry of your view.
This is a little bit of a generalization but typically flows for rates find their major clearing events in CPI, NFP, and FOMC. A lot of the catalysts in between these are just trying to get a view of these actual catalysts. For example, all of the speeches by Fed governors matter very little in today’s market but they still occur and sometimes move the price a little.
You can conduct studies on all of these data points and catalysts to develop greater clarity. I have personally backtested the majority of data points for rates. However, you have to recognize that regimes change and the insight you found from 2015 doesn’t necessarily work in 2024.
Words of advice: Starting off understanding and trading the short end sets a clearer foundation for the long end. Many times people are attracted to the long end due to its higher variance and it appears as if there is more opportunity or implicit leverage due to the duration. It is better to learn the short end first and then move out across the duration risk curve. This is actually similar to how trading and learning all assets should take place but that is a conversation for another time.
Final Notes:
Trading any asset requires a high degree of creativity because there are always elements of continuity and discontinuity to the past. While the attribution analysis framework I provided above quantifies the variables in the rate complex, it is developing an informational edge in the underlying drivers that require creativity and critical thinking. For example, it is incredibly easy to find continuity to the past in how the 2s10s curve moves on a monthly time horizon. However, when you begin to break down the curve regimes and the underlying drivers in both the line items of growth/inflation AND the timing/aggressiveness (or even inaction) by the Fed, it’s not as straightforward.
Conclusion:
We have covered a lot in this article. All of the resources and information are there for you. It’s up to you to set a foundation with the resources above and then refine your action through constant practice.
In the information age, you simply need to be at the right place, at the right time, with the right information to succeed
Many self-proclaimed rate strategists who have been in markets for 30+ years can do nothing more than tell you a recession is coming because the yield curve is inverted. This creates an opportunity for individuals who are rigorous in their research, disciplined in their execution, and creative in their thinking. We will continue moving forward with in-depth interest rate research on this Substack and I will continue refining my informational edge and abilities. I don’t care how long you have been in markets, it always feels like it’s day 1 which is why I show up every day!
As always, continue to keep the proper perspective about education and never settle for being average!
“You wasted $150,000 on an education you coulda got for $1.50 in late fees at the public library.”

Wonderful article. Took a while to read, Im slowly studying the sources. Knowledge and alpha, incredible value
Holy Motherload of info!!
Much appreciation for saving me thousands of hours in searches!
Thank you!!