Alpha Report: Macro Liquidity and It's Impact On EVERYTHING
Macro liquidity is the asymmetrical linchpin on which the entire financial system turns and its turning
If you are here, it is because you recognize the importance of how macro drives every aspect of financial markets and our lives. When you realize how instrumental changes in the macro regime are, you can never unsee them. This sets the stage for you to know HOW you should adapt.
In the information age, you simply need to be at the right place, at the right time, with the right information to succeed
The problem isn’t getting access to information and data in today’s world. Its understanding it, interpreting it, and connecting it correctly. We are at a point in the macro regime where understanding macro liquidity and its implications for asset markets (equities, Bitcoin, bonds, metals) is critical for the next 30 days in markets. What happens in the next 30 days will set the stage for WHERE we are going in 2025.
Where Everyone Goes Wrong With Macro Liquidity:
You have almost certainly seen M2 charts as a metric for “money supply” or “government printing.” The problem with using these types of data points for determining macro liquidity is they 1) only provide a narrow view of one aspect of money in the system and 2) commentators never properly connect them to financial markets.
This is why M2 fails to provide consistent insight into WHY assets are moving and WHERE they are likely to go.
There is a reason why the YoY change in M2 (white line in top panel) doesn’t perfectly correlate (green and red in bottom panel) with the returns of Bitcoin (green and red bars in top panel):
How Do We Understand Macro Then?
There are three things in macro that if you correctly understand, you will understand WHY asset prices are moving and WHERE they are likely to go. These three things are:
Growth
Inflation
Liquidity
Educational Primers across this Substack, Prometheus Research and Conks have systematically explained each of these three things.
Capital Flows Educational Primers on every aspect of macro including growth, inflation, and liquidity: Link
Prometheus articles on macro mechanics: Link
Conks Primers on macro liquidity and the plumbing of the system: Link
The question that faces us is WHERE are we right now? This is what will be covered in this report.
Where Are We?
On a structural basis, there are 3 things characterizing the macro regime:
#1: Low delinquencies
Credit spreads representing credit risk/recession risk remain incredibly low:
The same is true for mortgage defaults:
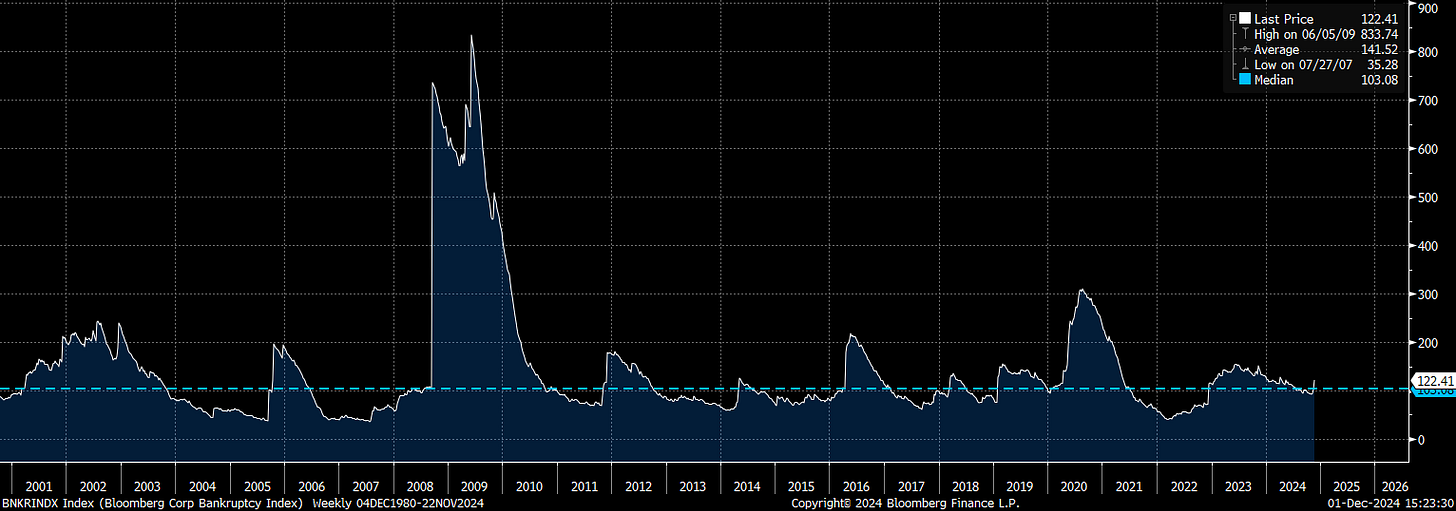
And corporate bankruptcies remain suppressed (but are ticking up marginally! This dynamic and its connection to the macro regime was explained here: Link)
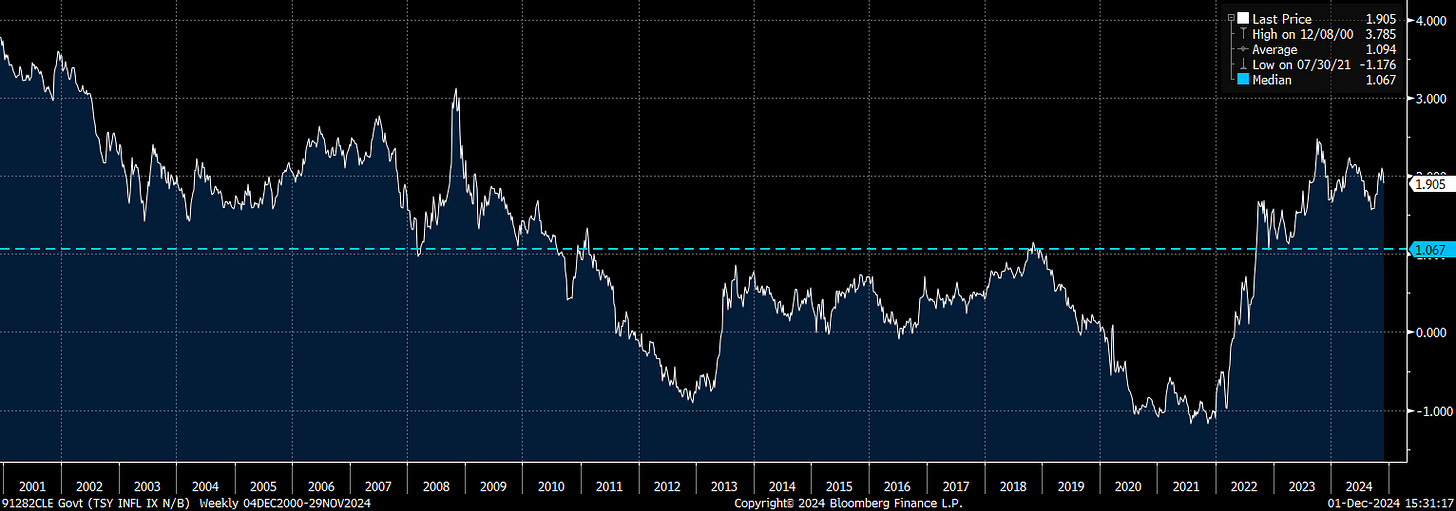
#2: Inflation is Trending DOWN
Headline CPI, CPE, and PPI continue to trend DOWN and remain skewed to the downside on a cyclical basis:
#3: Liquidity Decoupling
Real rates are incredibly elevated which is putting DOWNWARD pressure on growth and inflation.
However, we have seen the quantity of money in the system rise considerably. Cross-currency basis swaps reflect the change in the QUANTITY of money in the system. These instruments show what real rates don’t show.
This is WHY we are seeing Bitcoin rally. (This relationship was laid out in the Bitcoin Strategy Primer: Link)
It is these three dynamics that contextualize the next move in growth, inflation, and liquidity over the next 30 days. If you can correctly understand the macro context and HOW positioning is set up into this, then you can understand HOW to prepare and thereby adapt accordingly.
Preparation BEFORE prediction is the key here:
Inflection Point In Macro Liquidity:
In this context, we are going to dig into the exact skew and risk-reward dynamics of assets moving into the end of the year.
The initial setup for interest rates has been laid out here. Expanding on how interest rates interact with the quantity of money and growth will be THE KEY to determining the skew in equities and Bitcoin.
(This week would be an excellent time to do a free trial on the Substack. Over the next 5 days, comprehensive reports will be published on the distribution of equity sectors/factors, the SOFR curve, metals, and Bitcoin. Each of these reports will provide comprehensive analysis as well as any trades that are triggered by the proprietary strategies being run).
Keep reading with a 7-day free trial
Subscribe to Capital Flows to keep reading this post and get 7 days of free access to the full post archives.


