

Alpha Report: Why did bonds and risk assets sell off today?
The mistake by the Federal Reserve

Big Picture:
We saw significant volatility across all major markets today and this falsified some of the views laid out on the Substack, specifically the long bond view. However, it also confirmed many of the risks noted in equities for over a month now. In this article, I am going to explain WHY equities and bonds sold off today and HOW this connects to the actions of the Fed. It is likely that the Fed has made a considerable mistake in its stance and forward guidance today. This was reflected in how the pricing across the curve responded to the FOMC meeting.
The Curve:
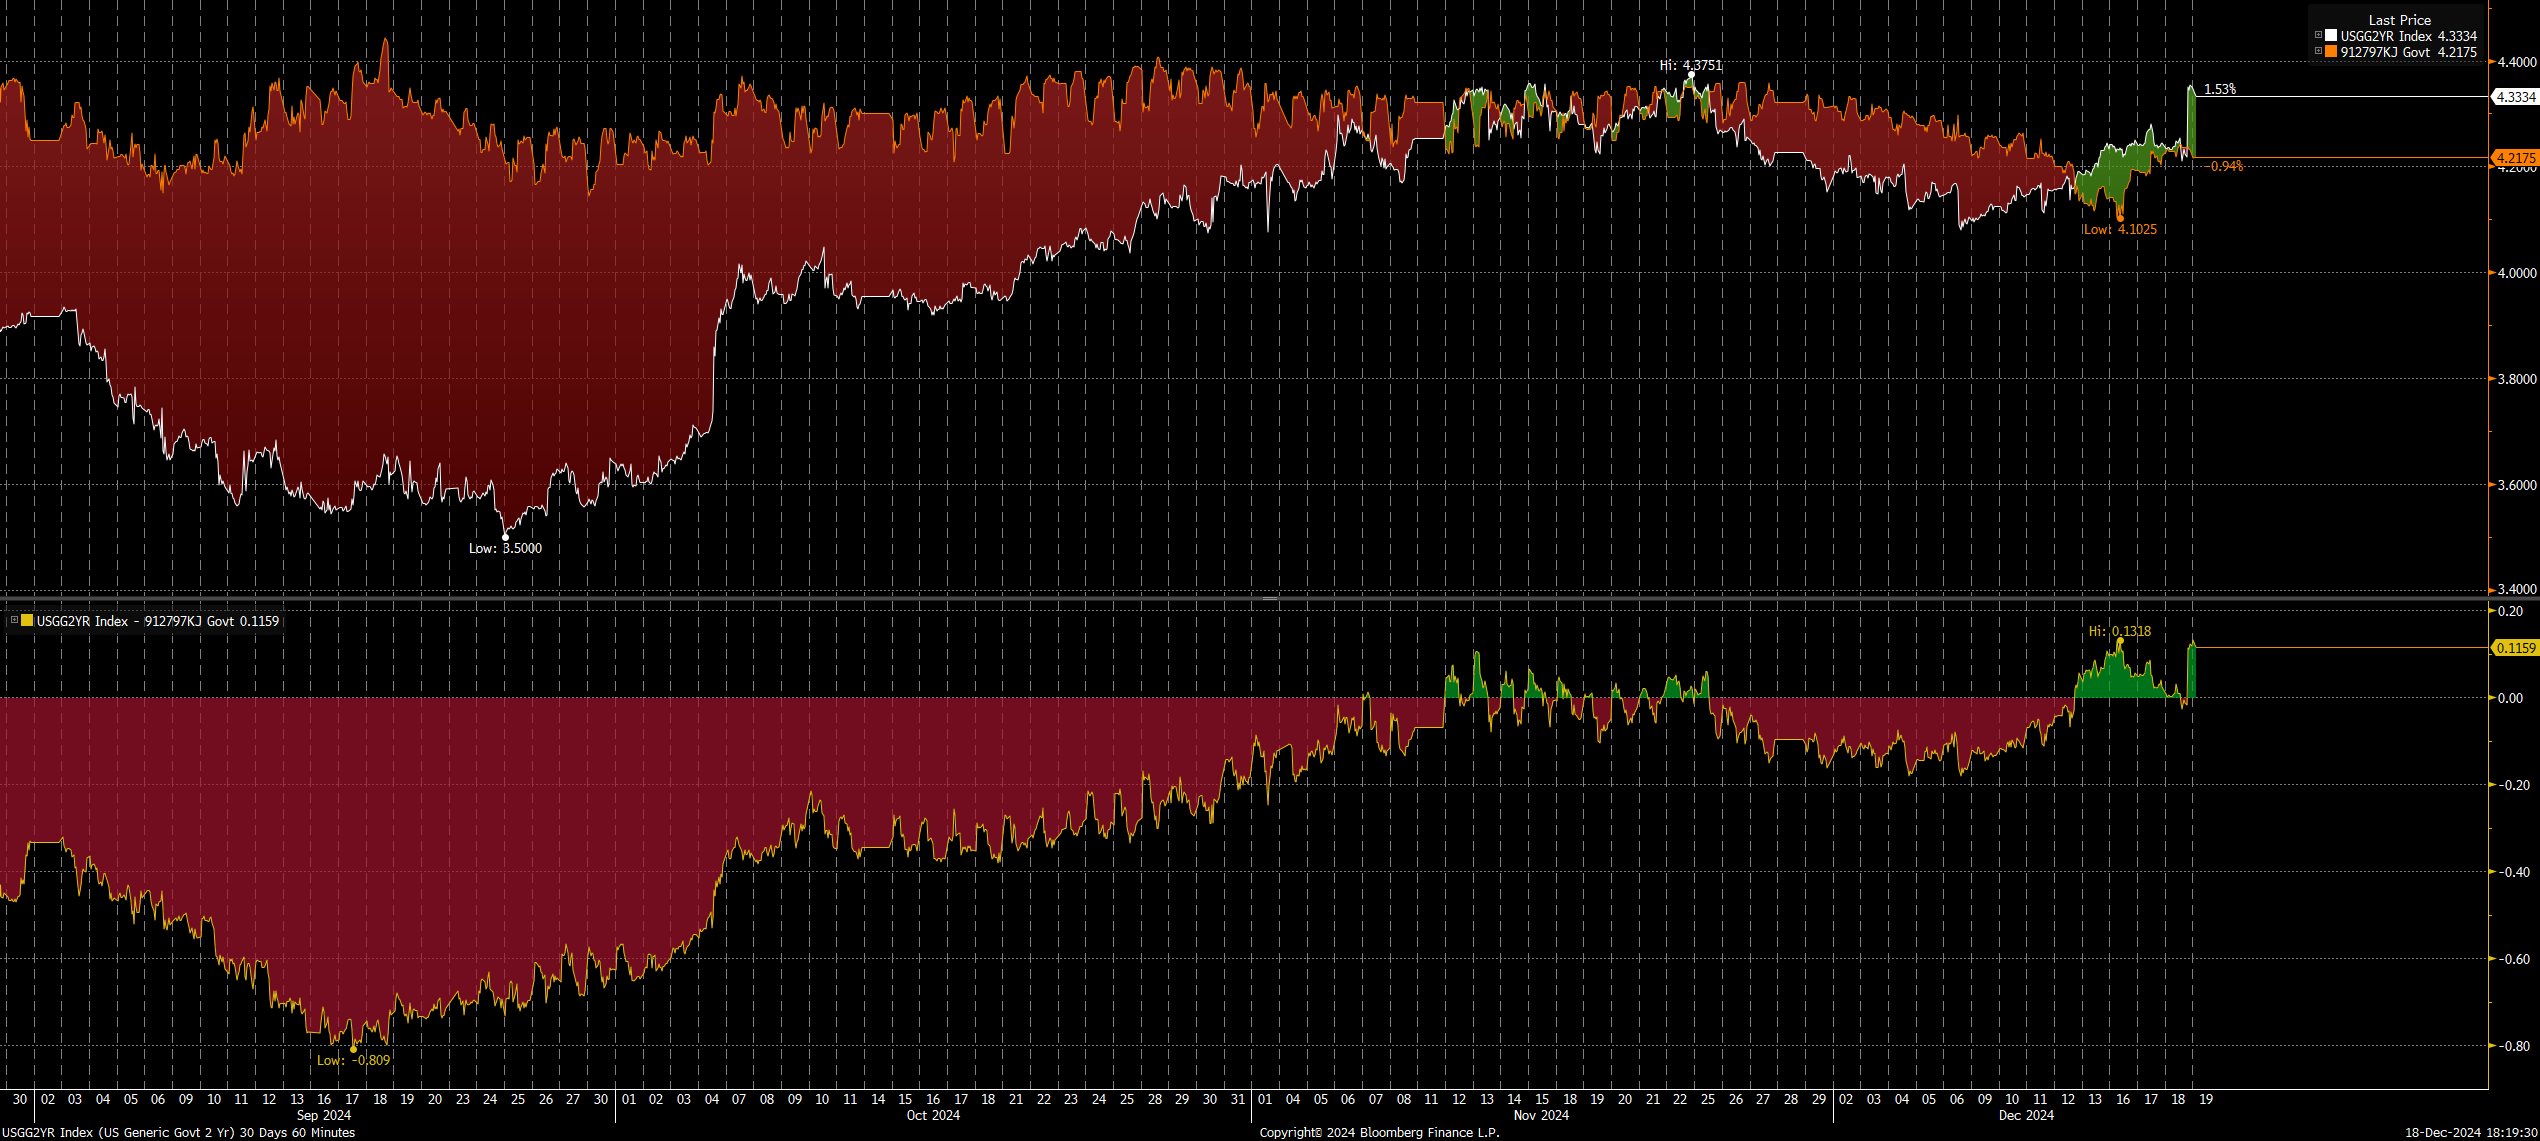
When we think about interest rates, there are multiple curves to analyze and each has a different connection to the actions of the Fed and conditions in the economy. The spread between the 2 year interest rate and 3 month T-Bill is primarily showing the pricing of expected Fed Funds over the next 2 years. The spread between the 3 month T-Bill is pricing HOW FAST the Fed is going to cut or hike. You will notice that since SVB in 2023, this curve has been inverted with the 2 year interest rate BELOW the 3 month T-Bill. This indicates that the market is expecting cuts as the next consecutive action by the Fed.
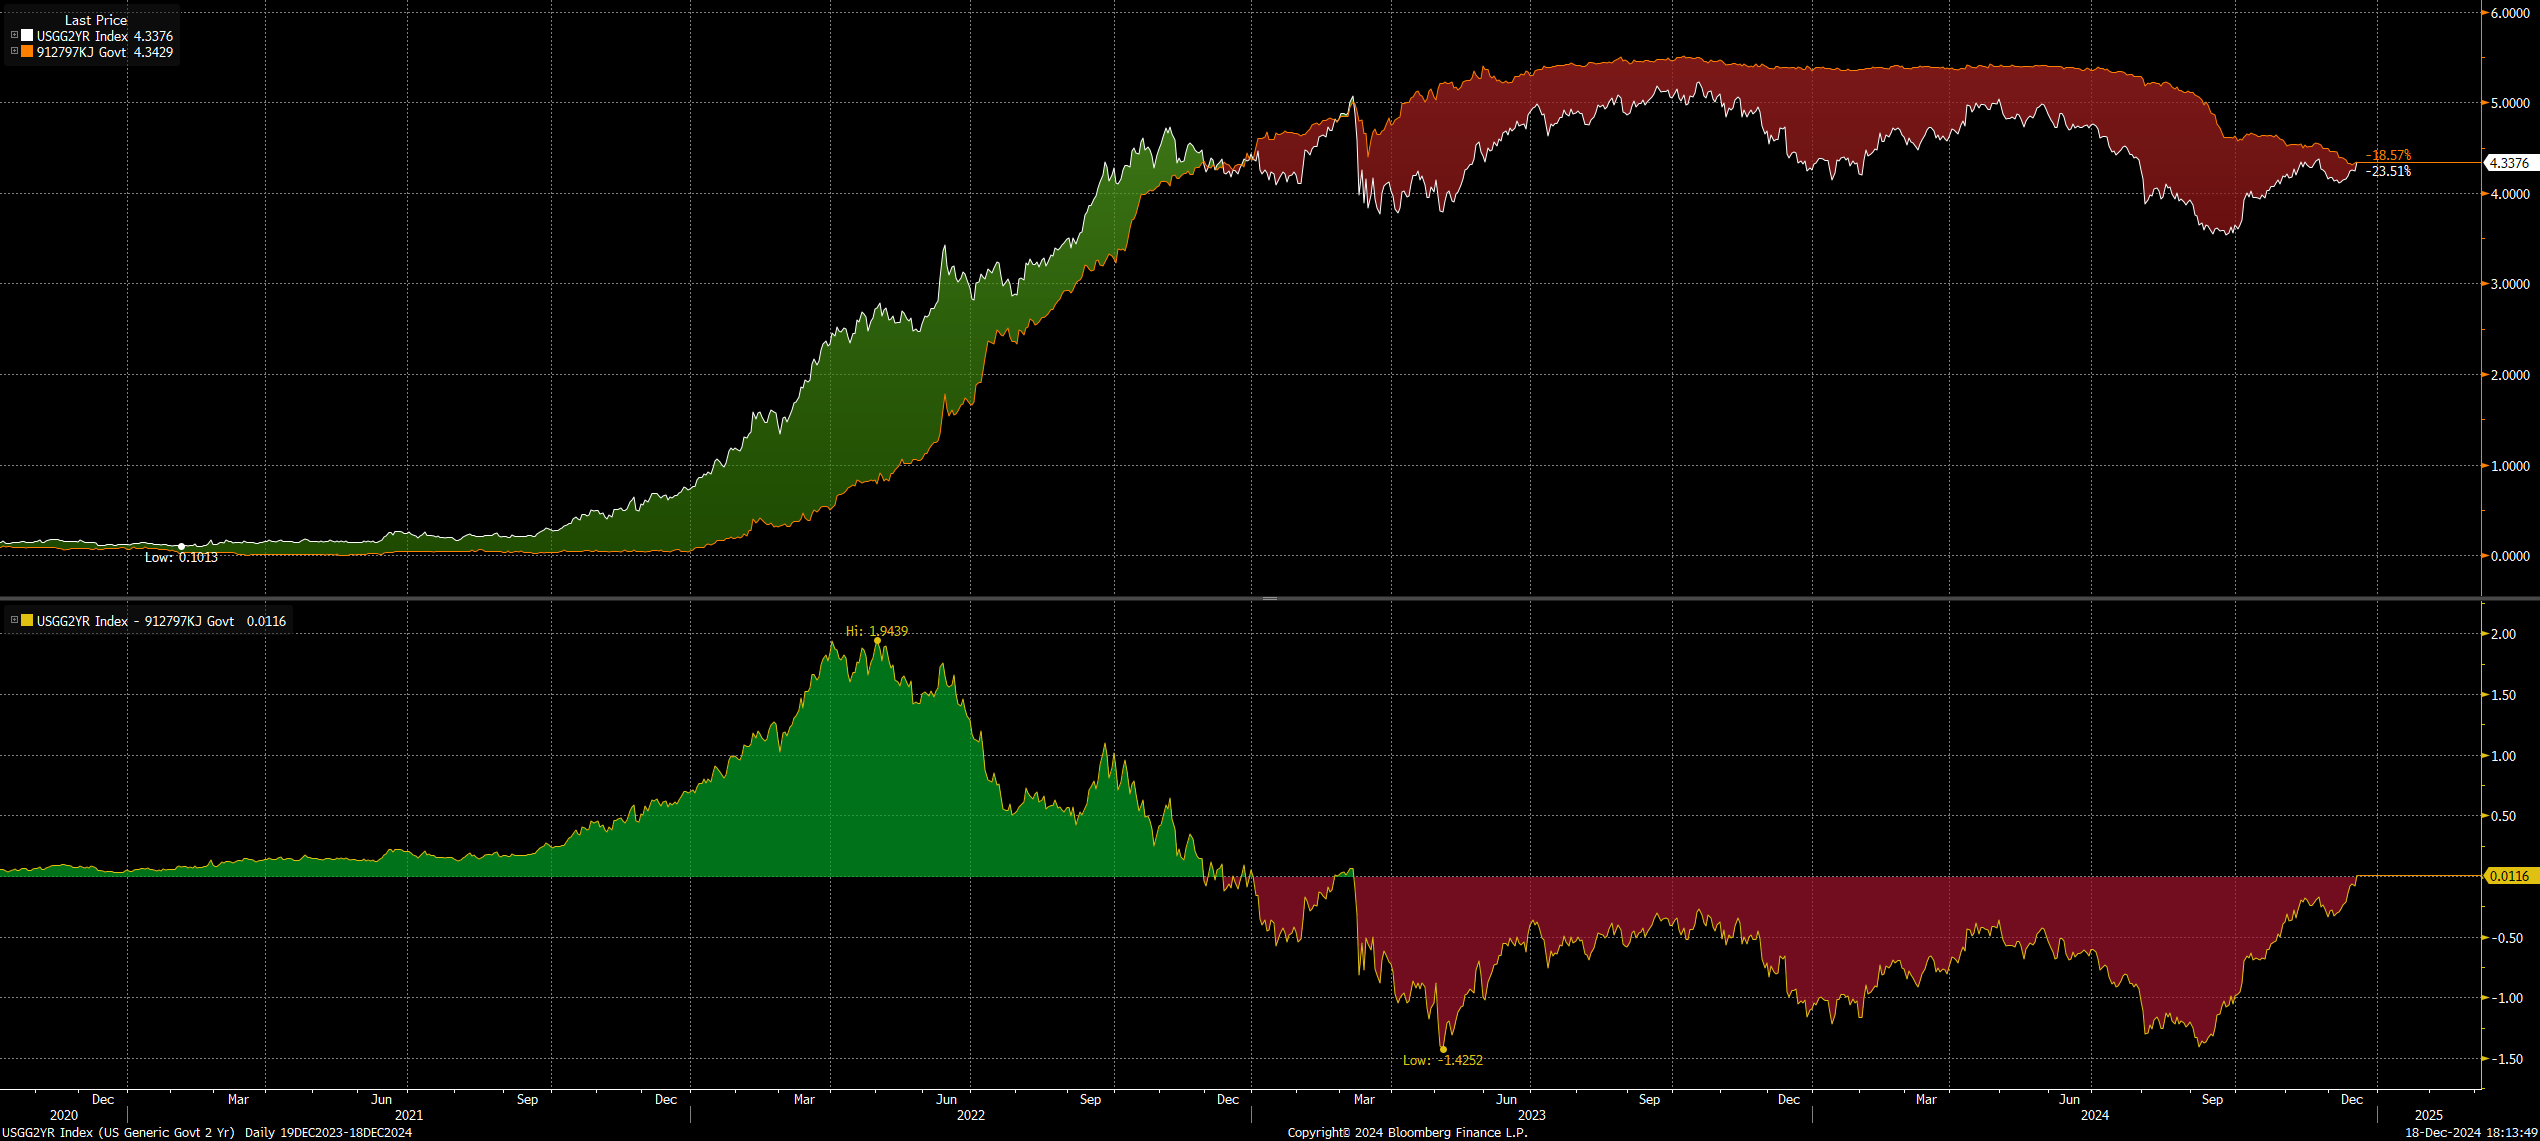
Now you will notice that in November, the 2-year rate went above the 3-month T-Bill just marginally pricing a hawkish extreme. This is one of the reasons why my strategy opened a bond long during this time in November. The implication was if the 2 year keeps going ABOVE the 3 month T-Bill then hikes are going to come back on the table which is unlikely. Pricing hikes are dramatically different than pricing pauses.
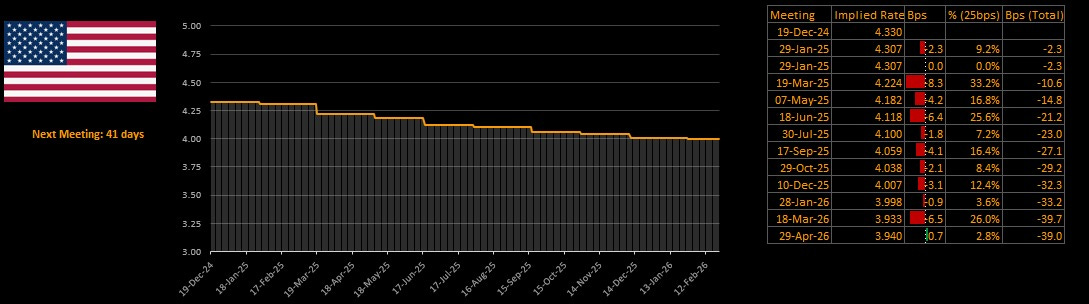
Since Powell’s comments today, the forward curve is much flatter with only 32bps being priced for 2025. Coming into FOMC today, the market was pricing 50bps of cuts and there was a reasonable case to price an additional 25bps of cuts in 2025.
Instead, Powell came out incredibly hawkish

The dot plot and SEP reflect a view by the Fed that inflation won’t make progress in 2025:

The Fed is functionally saying, we think the most recent flatness in prints will persist:

The Fed has taken a stance where it wants to hold rates above inflation. The chart below shows the 3-month T Bill (orange) and core CPI (white). The bottom panel reflects how this spread is currently negative.

The fact that the Fed is shifting its stance after multiple cuts and softening labor market data indicates that it intentionally wants to take an even more aggressive stance toward inflation AT THE EXPENSE of growth. (Does this have something to do with the new administration? We don’t know yet but it could).
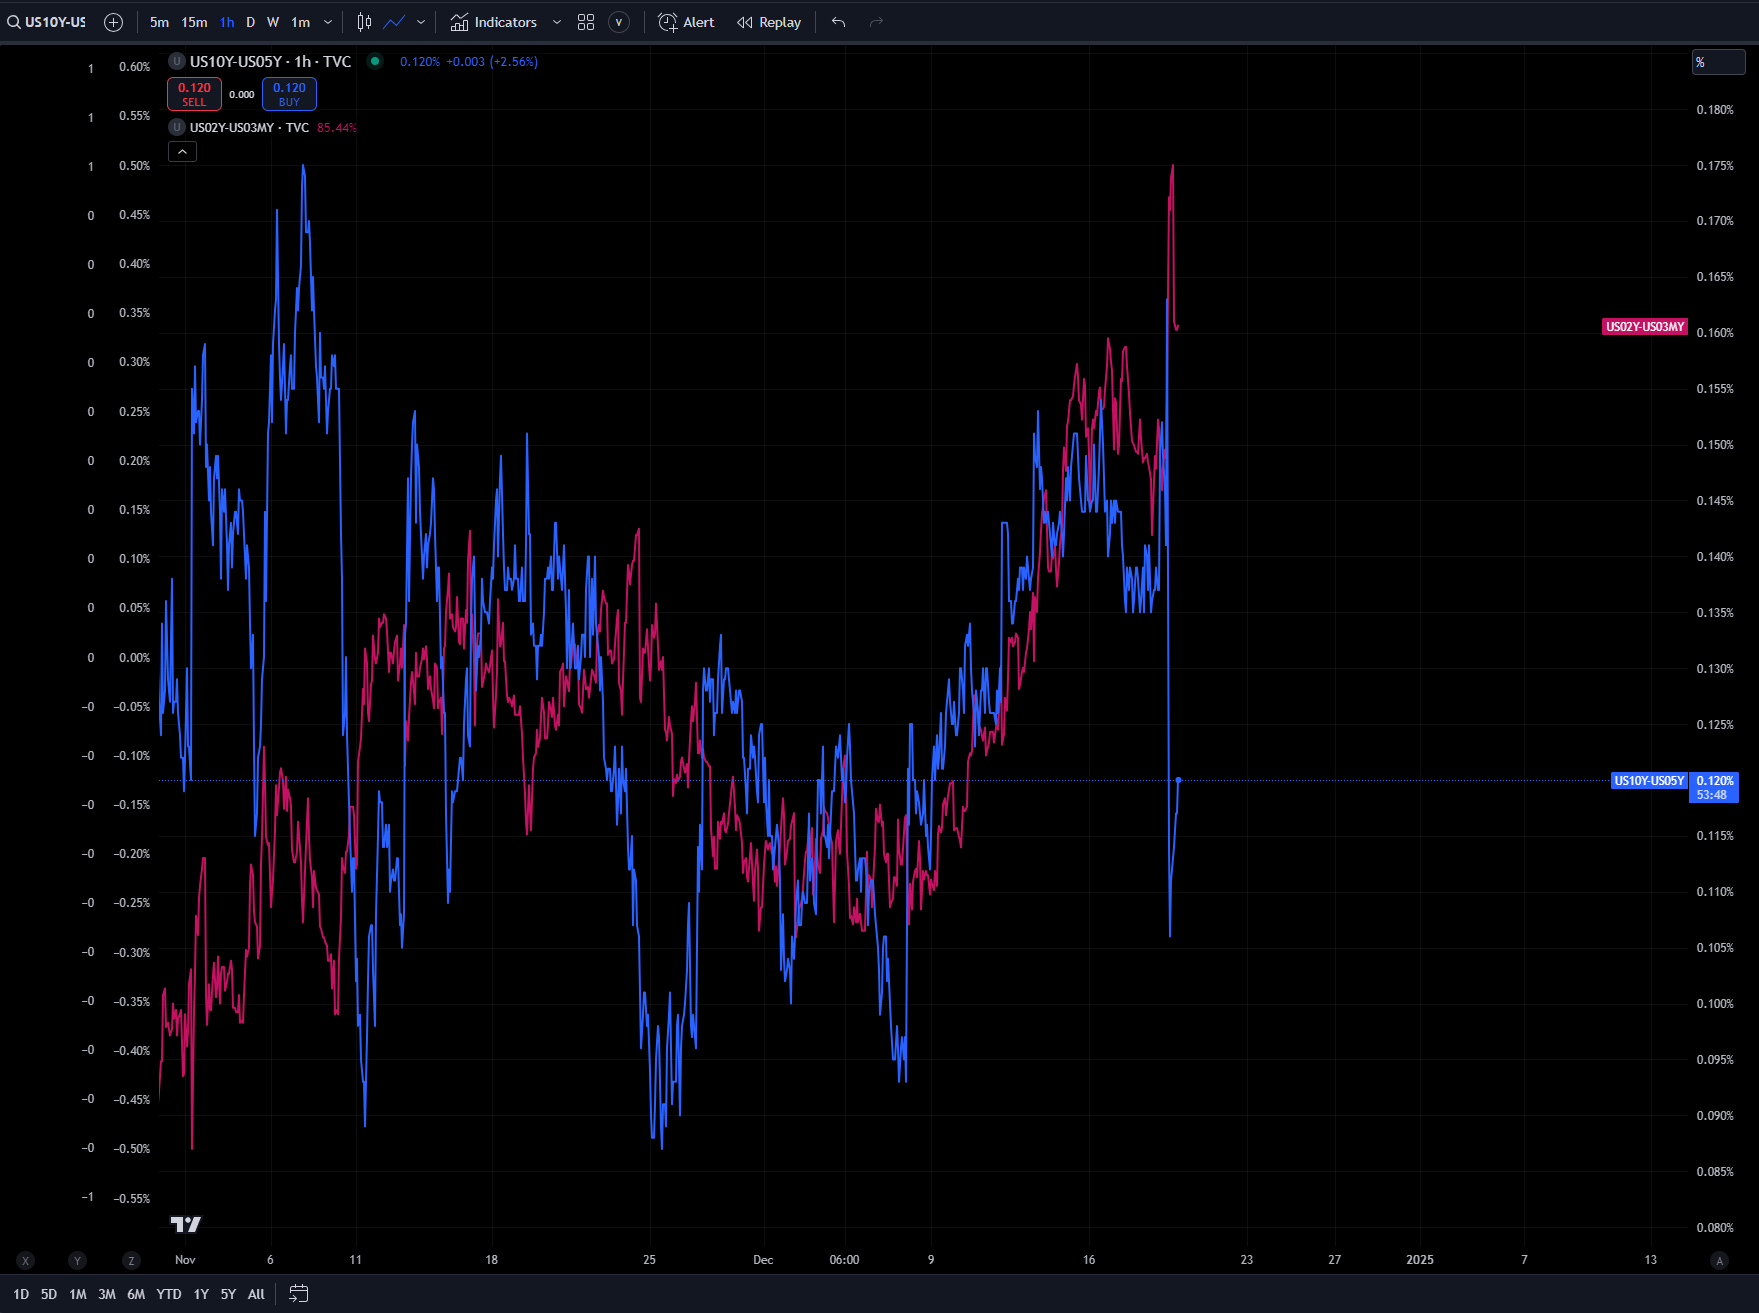
You can see the market’s reaction to this dynamic in two ways. First, the 2y3m spread uninverted and pushed higher. This happened at the same time longer end curves actually flattened on the day. The 30y10y spread moved down:

The same is true for the 10y5y
The important variable to remember is that growth isn’t at 2023 levels. NFP is much lower and the unemployment rate is higher.

The second way to understand the market reaction today is in inflation swaps. The entire move in bonds today was purely from the real rate function as opposed to inflation. The implication is that all of the Fed’s rhetoric today only pushed real rates higher, inflation swaps aren’t buying their “forecast.”

Powell came out to dovish in Septemeber with a 50bps cut. Now he is coming out to hawkish for the underlying economic situation and the equity market is responding.
Equities:
Since November 11th, I have been neutral on equities and I have laid this out in the macro reports (link and link). There is a reason equities sold off so aggressively today.

When you are incredibly rich in terms of valuation multiples, risk assets become more sensitive to changes in rates. This is why stocks and bonds were down together today and this reverberated across the FX and metals space.

This is why Russell and Dow retraced the entire move, where the election hedges were unwound.

And why volatility has blown out so much across ES, NQ, and RTY.

The primary reason ES and NQ have rallied since the election is due to the indexation effect and contribution of Mag7.

However, the marginal rolling over in growth, higher real rates and the stance of the Fed is likely to cause credit spreads to rise marginally as we move into the pause period. This is also why today we saw stocks down, bonds down, and credit spreads rising. (investment grade CDX index in the chart below):

Additional Note on Trades and Positioning:
Keep reading with a 7-day free trial
Subscribe to Capital Flows to keep reading this post and get 7 days of free access to the full post archives.