Asset Class Report: Bonds and Inflation
An analysis of inflation tensions
Inflation Report:
Summary: We are in a period of time when inflation is decelerating and approaching the Fed’s 2% inflation target. However, there are key tensions to monitor with HOW inflation and growth are impacting each other. Additionally, the Fed's stance introduces a marginal degree of uncertainty because inflation is partially dependent on the degree of the Fed’s actions. Fundamentally, we are at the beginning of a cutting cycle where inflation is skewed to the downside and the primary uncertainty is around HOW MANY rate cuts will take place.
Inflation:
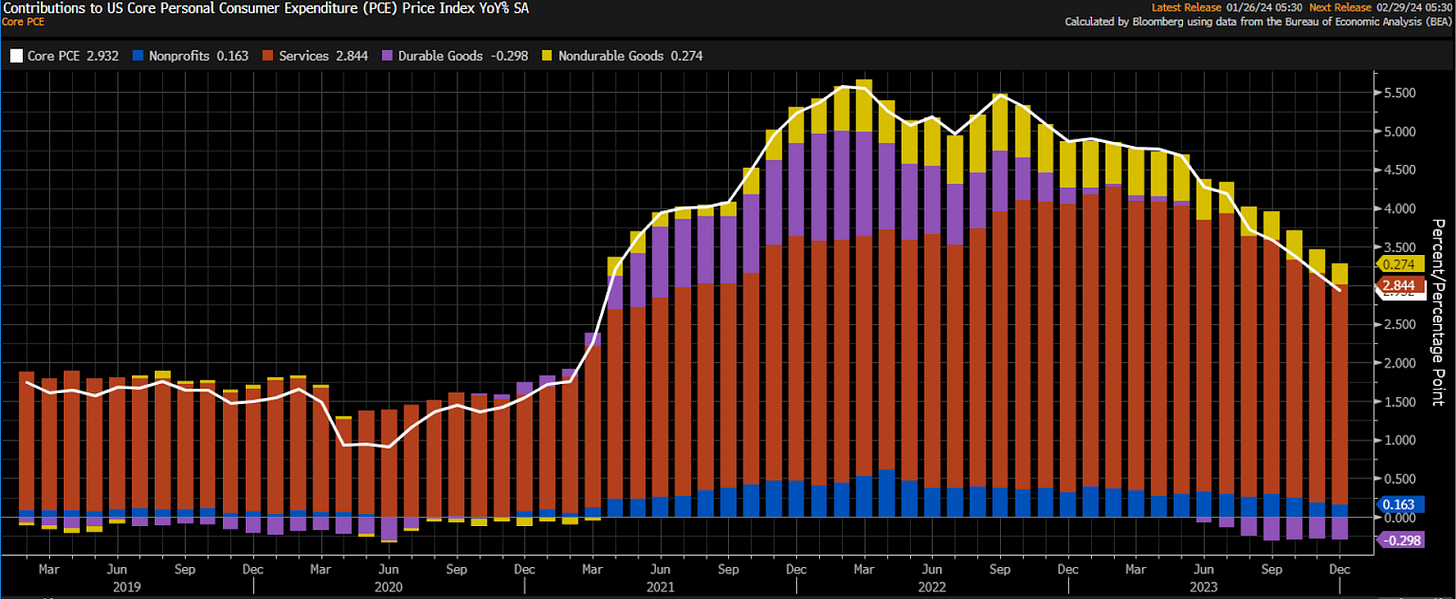
The core components of inflation as seen in CPI and PCE continue to show a consistent deceleration. This is providing confirmation to the Fed that inflation is on track to meet its target.
Core CPI is at 3.88%
And the more recent core PCE print is at 2.93%
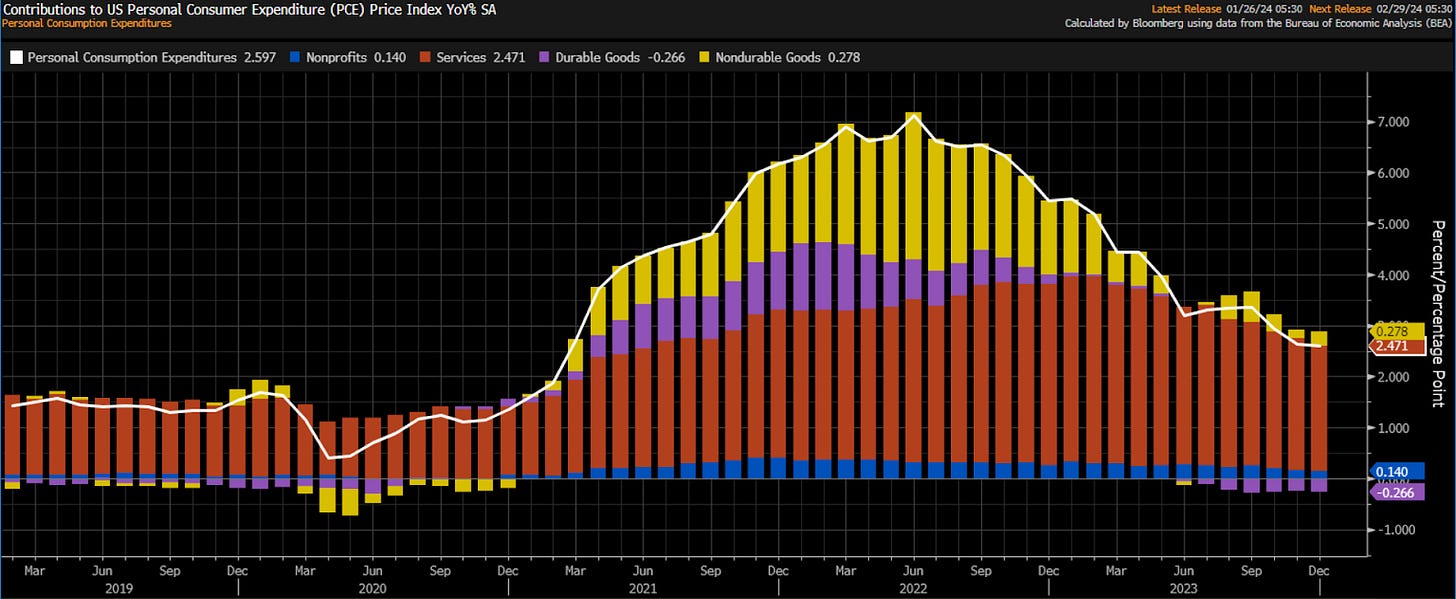
While we continue to see a pronounced and pervasive deceleration in the core components of CPI, the resilience in growth is marginally impacting the headline numbers due to the energy component.
The headline CPI number (white line) has been consolidating in a range since June of 2023:
Headline PCE decelerated more than headline CPI but still showed a marginal reacceleration during September of 2023:
PPI numbers are also consolidating in a range here:
The primary reason for the short-term divergence between core and headline numbers is due to the energy component. Energy prices have been moving in lockstep with the positive growth prints. Here is a chart of crude (white), the Atlanta Fed GDP Nowcast (blue), and the Bloomberg economic growth surprise index (orange).
While the Fed understands headline numbers have greater volatility due to the energy component, they will most certainly be watching this relationship closely. Additionally, if the headline components of inflation begin to impact the core components, we are likely to see more hawkish forward guidance by the Fed.
Since growth is directly impacted by interest rates, any cuts by the Fed could cause growth to accelerate and thereby increase energy prices. While significant spreads have historically occurred between headline and core inflation, this tension reflects the higher nominal environment we are in.
The Fed:
Within this context, we can further quantify HOW the Fed is likely analyzing the amount of cuts they will implement this year.
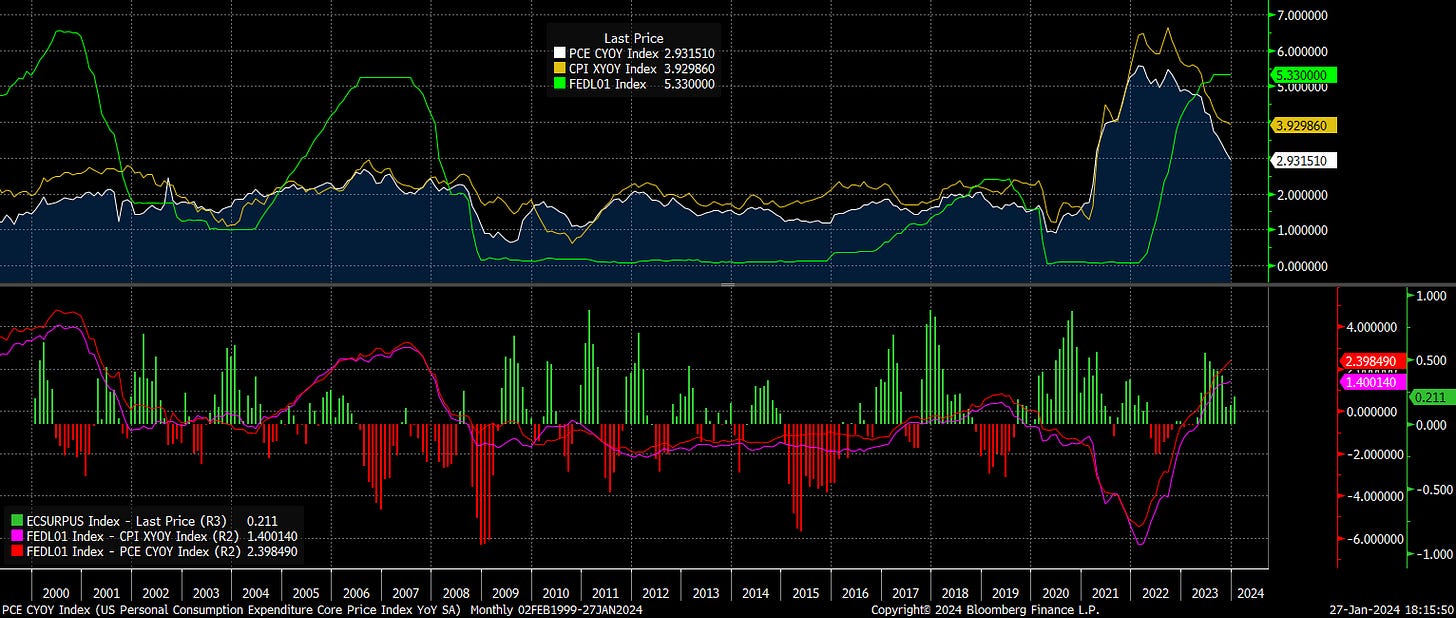
The important tension to note in the chart below is the SPREAD between Fed funds and inflation. The Fed knows that the discount rate is far above the actual core CPI and PCE levels. In reality, it is likely that the Fed is targeting a specific spread between the discount rate and inflation. The chart below shows core PCE, core CPI, and Fed Funds in the top panel. The bottom panel shows the spread between Fed Funds and both core metrics. Additionally, I have overlaid the Bloomberg Economic Growth Surprise index (green/red) as a proxy for growth.
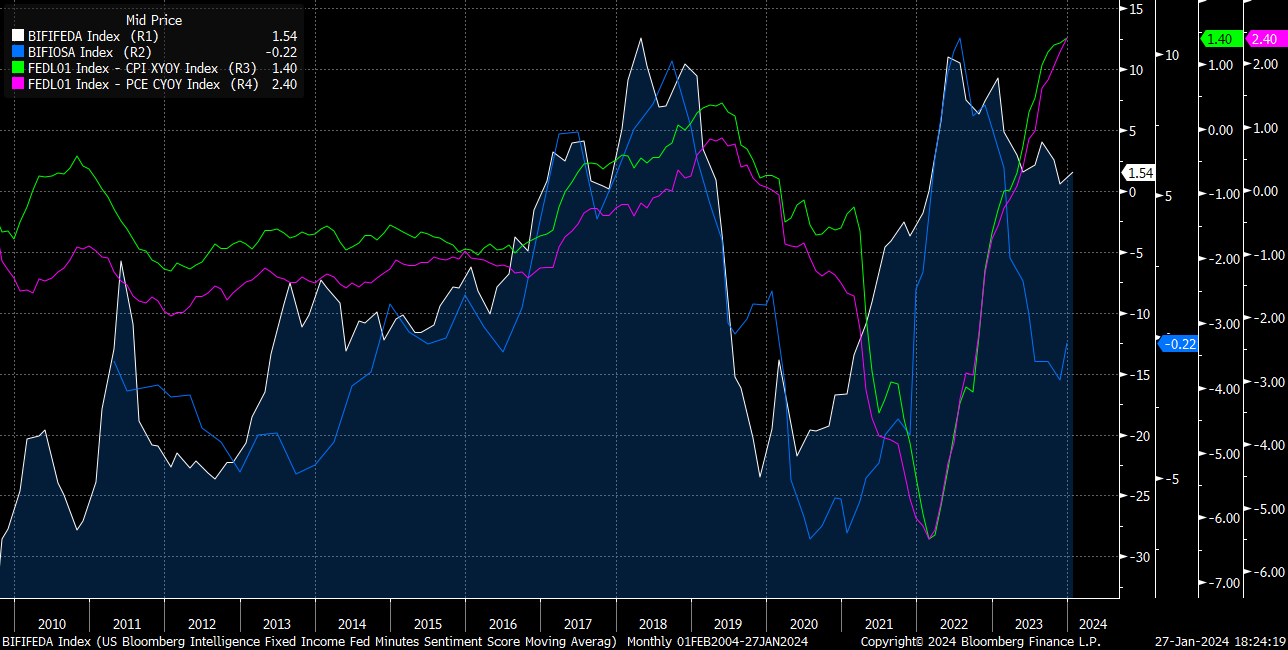
If growth remains resilient then the Fed is likely to target a higher spread and potentially do 3-4 rate cuts this year. If growth begins to decelerate further then this is likely to provide greater confirmation for the Fed to cut 5-6 times. The Fed funds rate and core inflation spreads can be compared to the Fed’s opening remarks and minutes sentiment indices. The sentiment indices are indicating a lower spread:
The tensions to keep in mind:
Rate cuts can exert positive pressure on growth and thereby headline inflation numbers.
A reasonable spread between headline and core inflation numbers can occur without the Fed drastically changing its stance. However, due to the environment we are in, a large enough rise in headline is likely to seep into core numbers.
The Fed is likely targeting a specific spread between the discount rate and core inflation.
There is a high degree of path dependency in the relationship between rate cuts, inflation, and growth.
Inflation Expectations:
The final dynamic to take note of is how the market is pricing inflation expectations.
We are seeing a marginal rally in inflation swap forwards (white) and 10-year breakevens:
The 2-year / 10-year breakeven spread is accelerating marginally indicating shorter-term inflation expectations are rising more than longer-term inflation expectations. This will be a key spread to monitor if we continue to see a rally in energy prices.
The inflation expectation curve is sloping down though which is in stark contrast to how the inflation curve was shaped during 2022:
The main idea to take away is that the market is pricing a downward direction for inflation. This is confluent with the direction of core inflation metrics. The inflation surprise index remains low but still must be monitored in connection with the headline and core tensions noted above.
As both the inflation expectations curve (green) and Fed Funds curve (represented by OIS in blue) are downward sloping, the primary uncertainty for 2024 is HOW MANY rate cuts are likely to take place. This uncertainty can be managed by monitoring the tensions noted above.
Conclusion:
As noted in previous macro reports, nominal rates are skewed to the downside on a cyclical basis. The oscillations that occur in nominal rates will likely be due to how the market prices the number of cuts that are likely to occur.
I will be writing the next macro report for paid subscribers soon. Check out the previous one here:


So Red Sea volatility would only cause oil to spike. Not all inflation. So it could cause CL prices to rise marginally. Big picture tho, very unlikely that the event causes a persistent rise in oil prices. It’s more of a one off event
Any thoughts on if the tensions in the Red Sea are a potential risk for inflation spiking?