Comprehensive Macro Report: Structural Support and Cyclical Trends
Growth, Inflation and Liquidity as they impact each asset
We are starting 2024 strong by quantifying the structural dynamics in the US economy and connecting them with cyclical trends.
I write a monthly macro report breaking down growth, inflation, and liquidity to show how they impact each major asset class. If you want to see the previous macro report, here are the links:
We will have the macro webinar tomorrow so be sure to sign up for that as well:
One of the main reasons for the macro reports is to analyze the various future scenarios that could take place. In retrospect, there is the illusion of only one possible outcome. In reality, many different scenarios COULD take place but don’t. To operate under uncertainty, you need to correctly quantify all potential scenarios. As the CEO of Goldman Sachs said in the video I shared (link), you want to be an exceptional contingency planner.
Enjoy!
Macro Report:
Main idea: Structural macro forces are beginning to put constraints on cyclical trends. The impact of onshoring and deglobalization is continuing to exert itself across global economies. This creates the preconditions for resilient growth. The most recent change in the stance of monetary policy decreases the probability of a recession and we are now at a crossroads with the current Goldilocks macro regime.
In macro, there are always cyclical fluctuations within a larger structural regime. As we move through the economic cycle, people typically extrapolate cyclical moves to structural realities. Understanding how these cyclical and structural forces shift is incredibly valuable for determining the amplitude and duration of growth and inflation cycles.
We are currently at a point where structural forces are clearly taking place. The demographic and deglobalization trends that Peter Zeihan has recently written books about are tangibly expressing themselves in economic data. What was once a conceptual projection is now becoming a quantifiable reality.
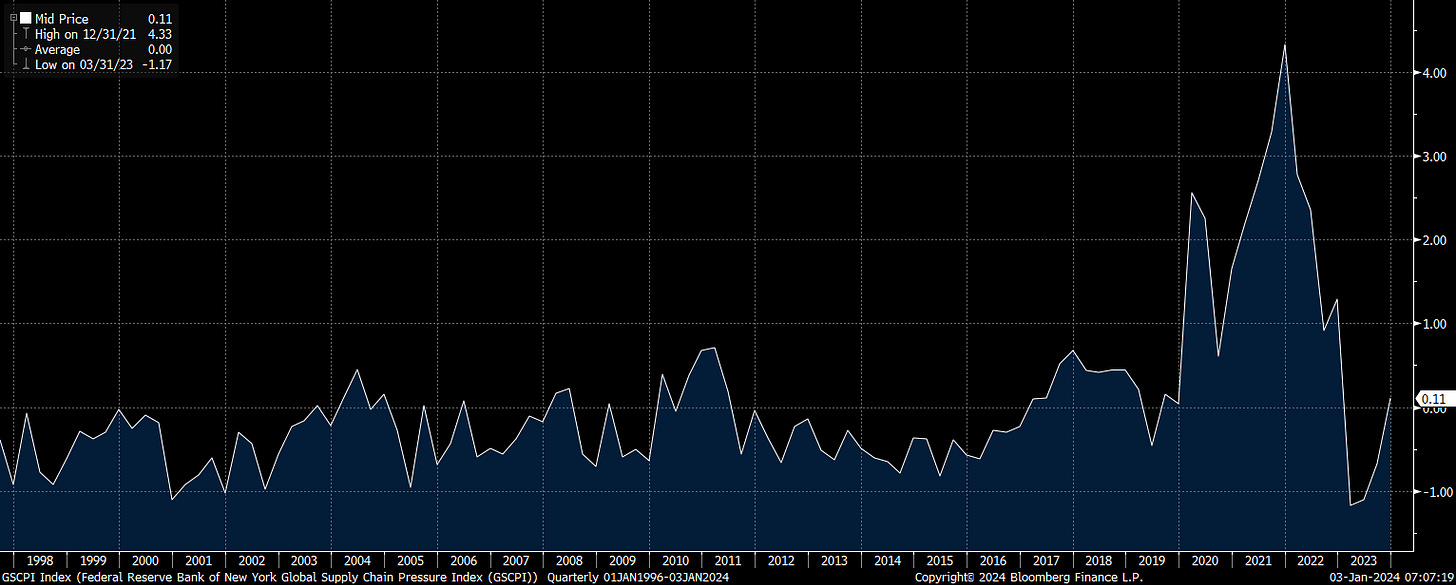
These structural trends were accelerated by COVID and we saw further changes in consumption and employment patterns. These structural changes were one of the primary drivers behind the inflation we saw over the last 3 years. The supply chain pressure index illustrates how the trend of deglobalization can cause significant price increases.
While major portions of inflation were driven by supply-side factors, there is another side of this deglobalization trend that is taking place, onshoring. Private domestic investment due to onshoring has been one of the primary factors supporting the resilience of US economic growth. This is the primary factor that bearish economists have ignored in their analysis.
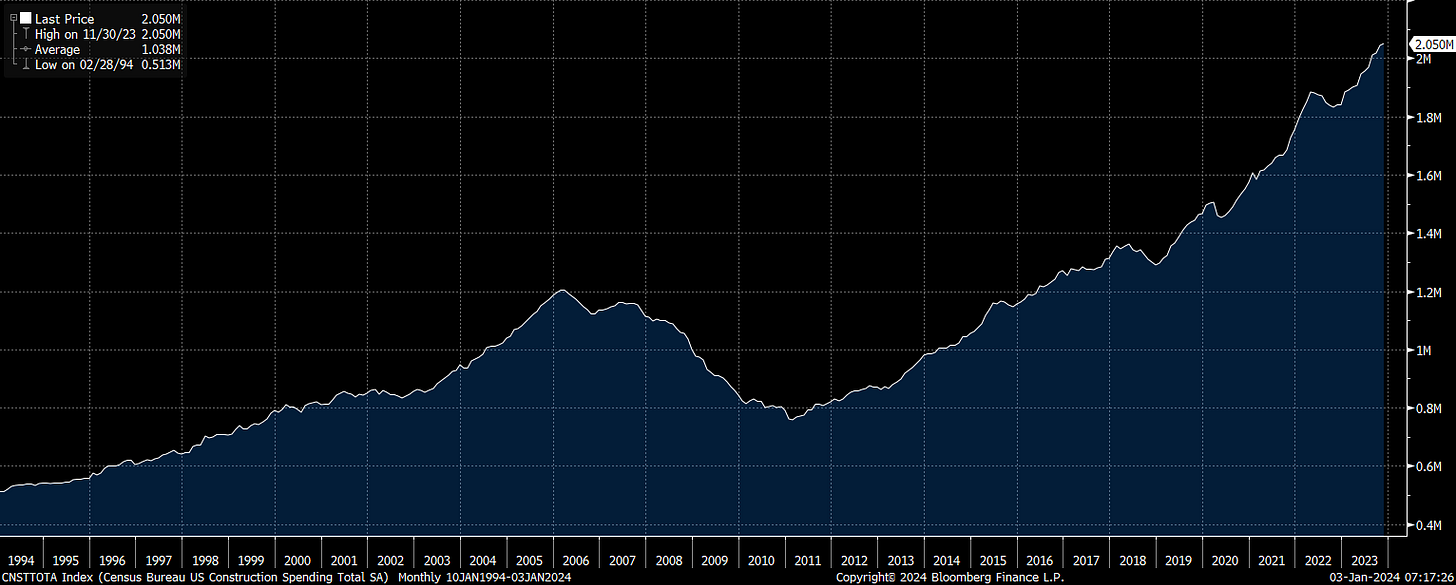
Total construction spending has continued to make highs, even while the FED has hiked rates:
Residential construction decelerated marginally during the hiking cycle but is now accelerating:
Transportation construction is also trending up:
Manufacturing construction has made a parabolic move to the upside:
Construction spending is a monthly dataset that provides consistent visibility into investment spending. This is not the only dataset indicating a structural shift, monthly employment data is saying the same thing.
Employment in this sector has moved well above pre-COVID levels:
Average hourly earnings in this sector are still elevated:
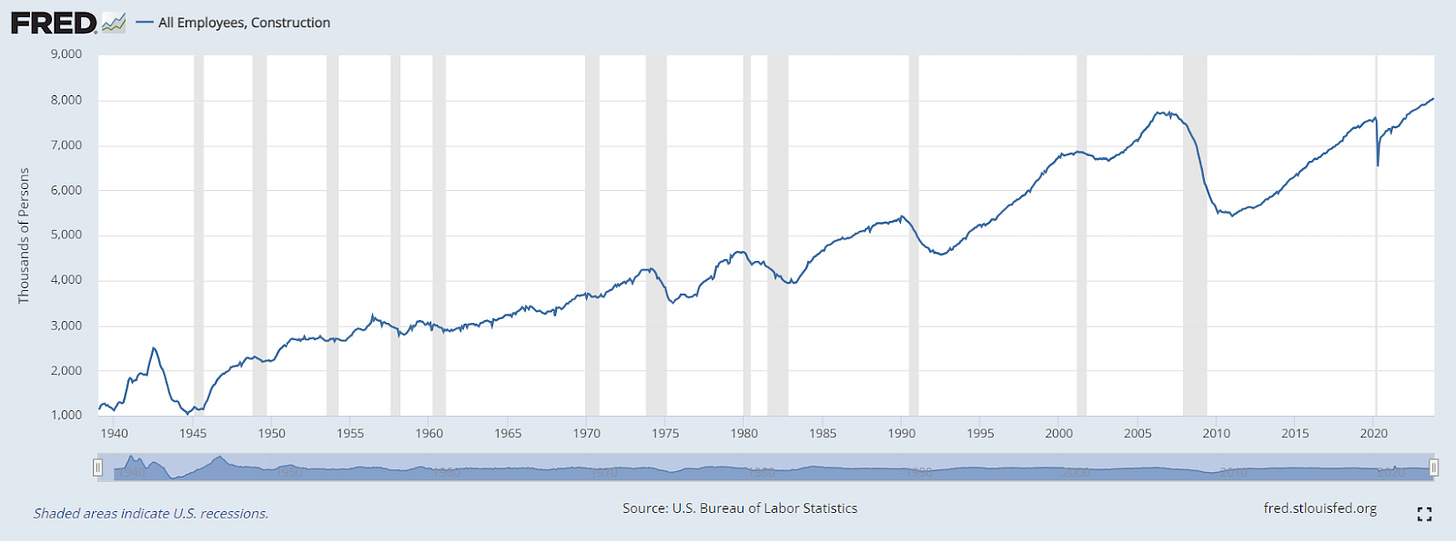
Overall construction employment has moved above the housing boom highs during the 2000s:
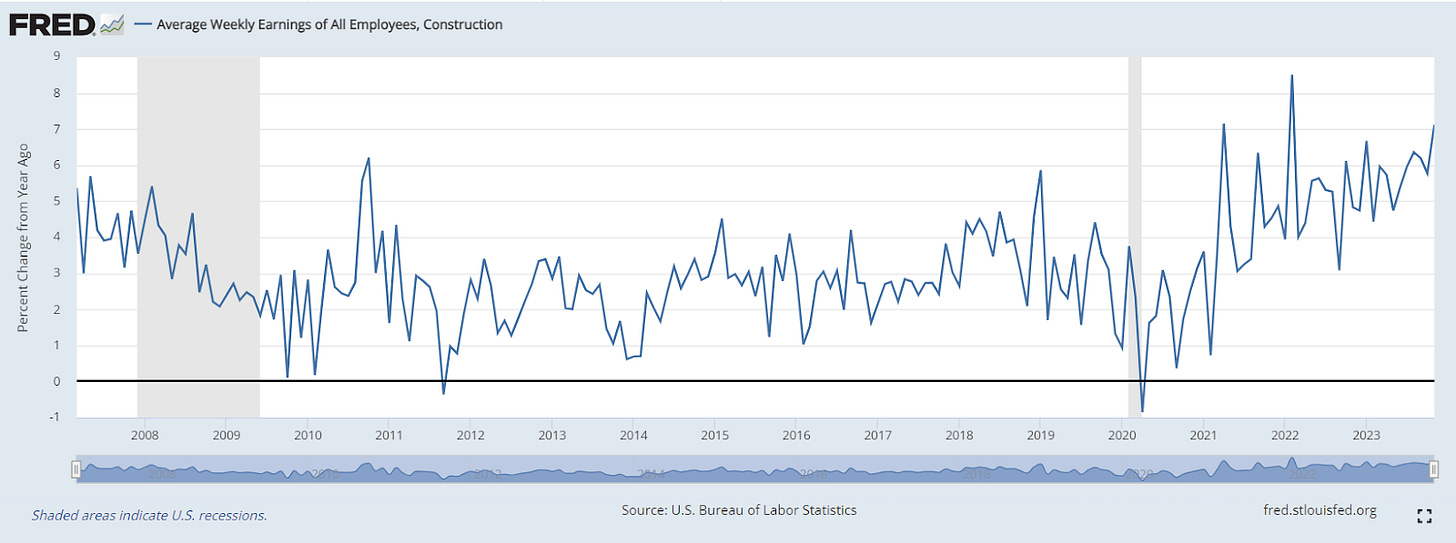
Average hourly earnings are still accelerating:
Warehouse and storage employment has moved up significantly and is now normalizing:
When we break down employment, the main idea is that people are shifting back to blue-collar jobs.
Food manufacturing:
Heavy and Civil Engineering Construction:
Specialty Trade Contractors:
Transportation and Warehousing:
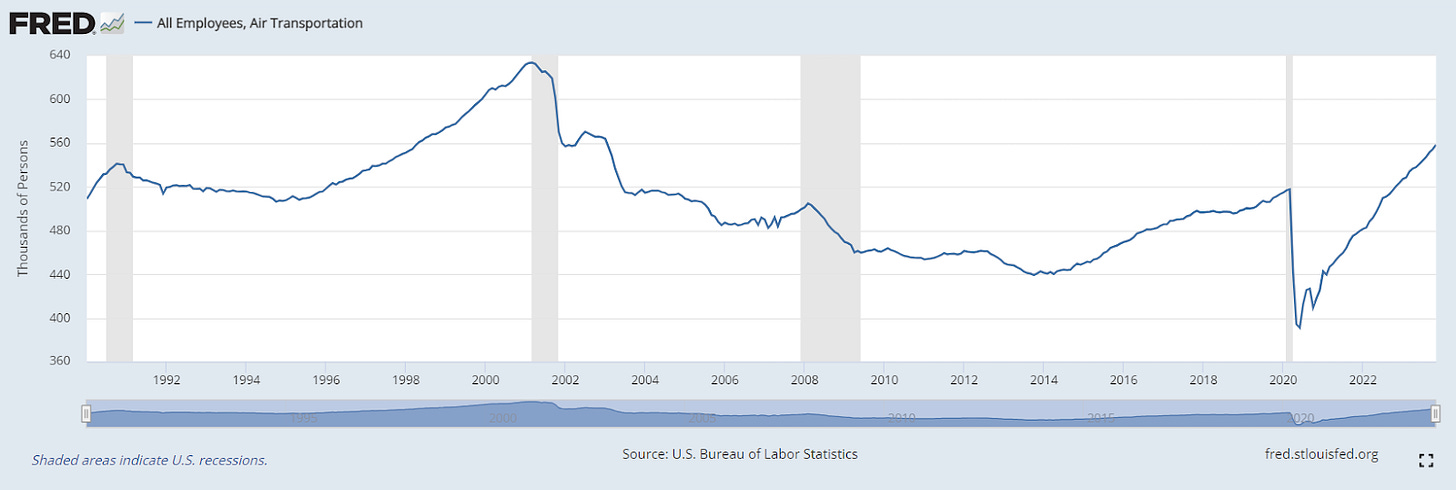
Air Transportation:
Trade, Transportation, and Utilities employment is at all-time highs:
And many of these employees are being pulled from other sectors:
All of these changes are reflected in the fact that fixed private investment in the US remains positive:
Gross Private Domestic Investment (a major line item in GDP that is the most sensitive cyclically) is trending up and making new highs on an outright basis:
We did see a deceleration and this datapoint go negative momentarily during the FED’s hiking cycle but it has since accelerated:
These structural trends directly inform our cyclical views on growth and inflation. These structural trends can persist for years and even decades. This is what brings us to the current cyclical growth and inflation situation.
Some Context:
Before we dig into the specific data points quantifying the cyclical trends we are seeing, let’s contextualize this regime:
The structural forces noted above are persisting. However, the initial supply-driven inflationary impulse is fading marginally. Additionally, the impulses from fiscal policy and monetary policy during 2020 and 2021 are fading. 2020 and 2021 were regimes with extremely loose fiscal and monetary policy. 2022 was the opposite extreme. 2023 was a normalization between these two extremes.
The “crises” we have had are signals of the TYPE of structural and cyclical regime we are in, one of resilient growth and inflation risk. There were four major “crises”:
1)The invasion by Russia which caused commodity prices to rise.
2) the devaluation of the Yen by the BoJ.
3) The pension crisis in the UK due to duration risk
4) The SVB crisis which was primarily due to duration risk as opposed to credit risk.
The backstopping of the system by sovereign authorities indicates the safety net they are placing under financial markets. By implication, sovereign authorities are placing a safety net under growth AND inflation.
Finally, growth continues to run at an elevated level. Interpreting the level and marginal change in growth, inflation and liquidity has been essential due to the normalization during 2023. The level of real growth is incredibly elevated right now:
Current Macro Regime:
Keep reading with a 7-day free trial
Subscribe to Capital Flows to keep reading this post and get 7 days of free access to the full post archives.


