

Macro Report/Insights: Comprehensive Macro Report
The next move for bonds and equities

Hey everyone,
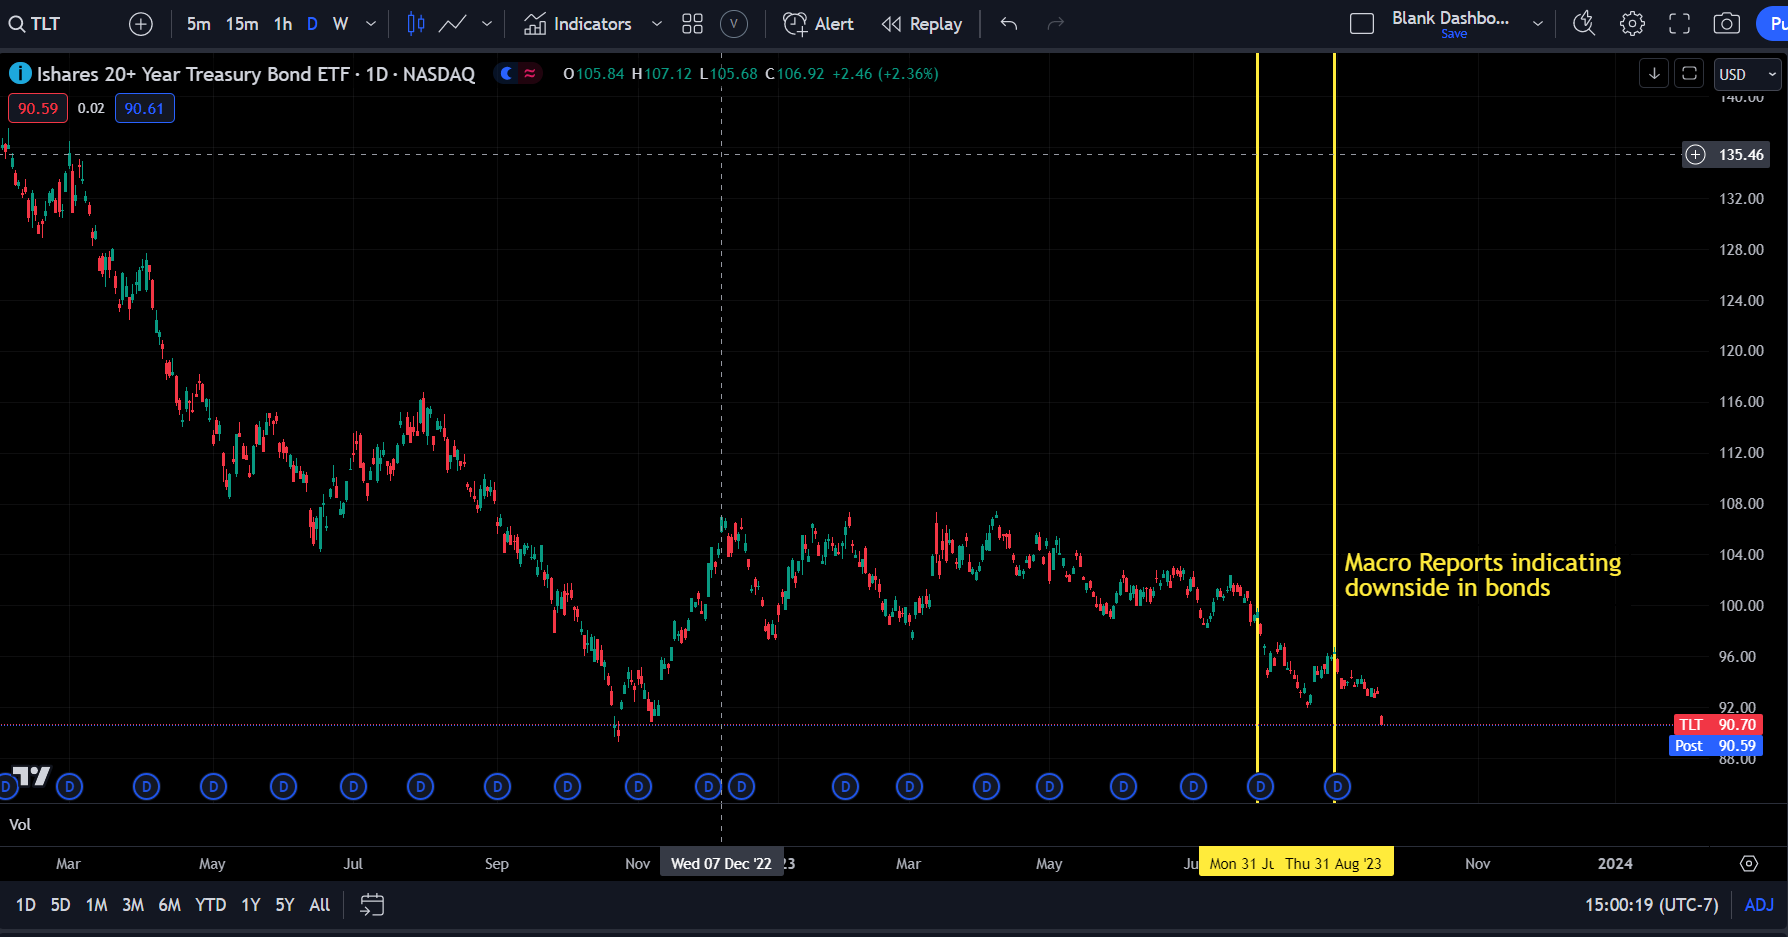
Since I started this Substack, I’ve written long-form macro reports breaking down my views of the macro regime and how it impacts all assets. The two previous macro reports drew attention to the fact that there was considerable downside in bonds even though the majority of financial media was peddling a bearish narrative.
Previous macro reports nailing bonds: link and link
At the end of the day, our P&L, bank accounts, and consumption are denominated in THE PRICE, not a narrative. This is fundamental to remember.
Let’s jump into it!
Macro Report:
In this macro report, I want to analyze the regular topics of growth, inflation, and liquidity in how they impact asset prices. However, I want to contextualize these variables a little more. We don’t want to get distracted by noise on the wrong timeframe or become complacent in not being preemptive in our thinking.
When we look at how market participants are positioned and the sensitivity of asset prices to macro variables, there are two major things to note:
The dominant impulse moving markets remains inflation.
The TYPE of price action we are seeing is compressing on a cyclical basis for the next spike in volatility.
Let’s break these down:
The dominant impulse moving markets remains inflation.
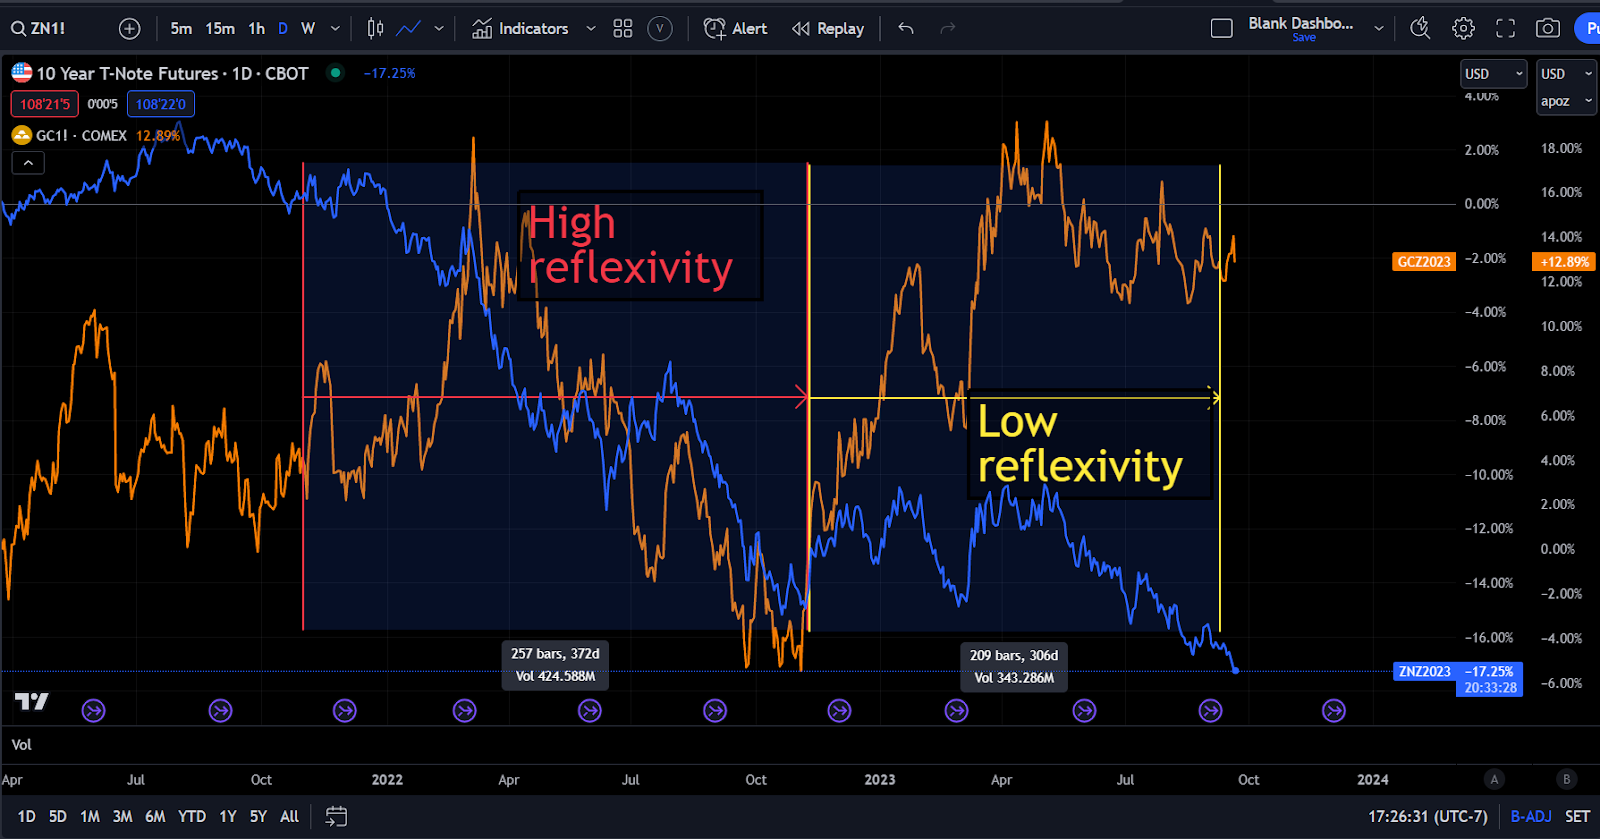
There is a key signal to watch here. There was a significant reflexive feedback loop between bonds and every other asset in financial markets during 2022. This reflexivity has decreased which has caused cross-asset class volatility to decrease.
For example, the correlation between stocks and bonds exemplifies this. The period of high reflexivity occurred while inflation and inflation volatility were accelerating. As we moved into 2023, inflation decelerated from its high and growth surprised marginally which caused the reflexivity between stocks and bonds to decrease.

Another example is between gold and bonds:

Finally, the DXY (inverted) is exhibiting the same dynamic:

The TYPE of price action we are seeing is compressing on a cyclical basis for the next spike in volatility.
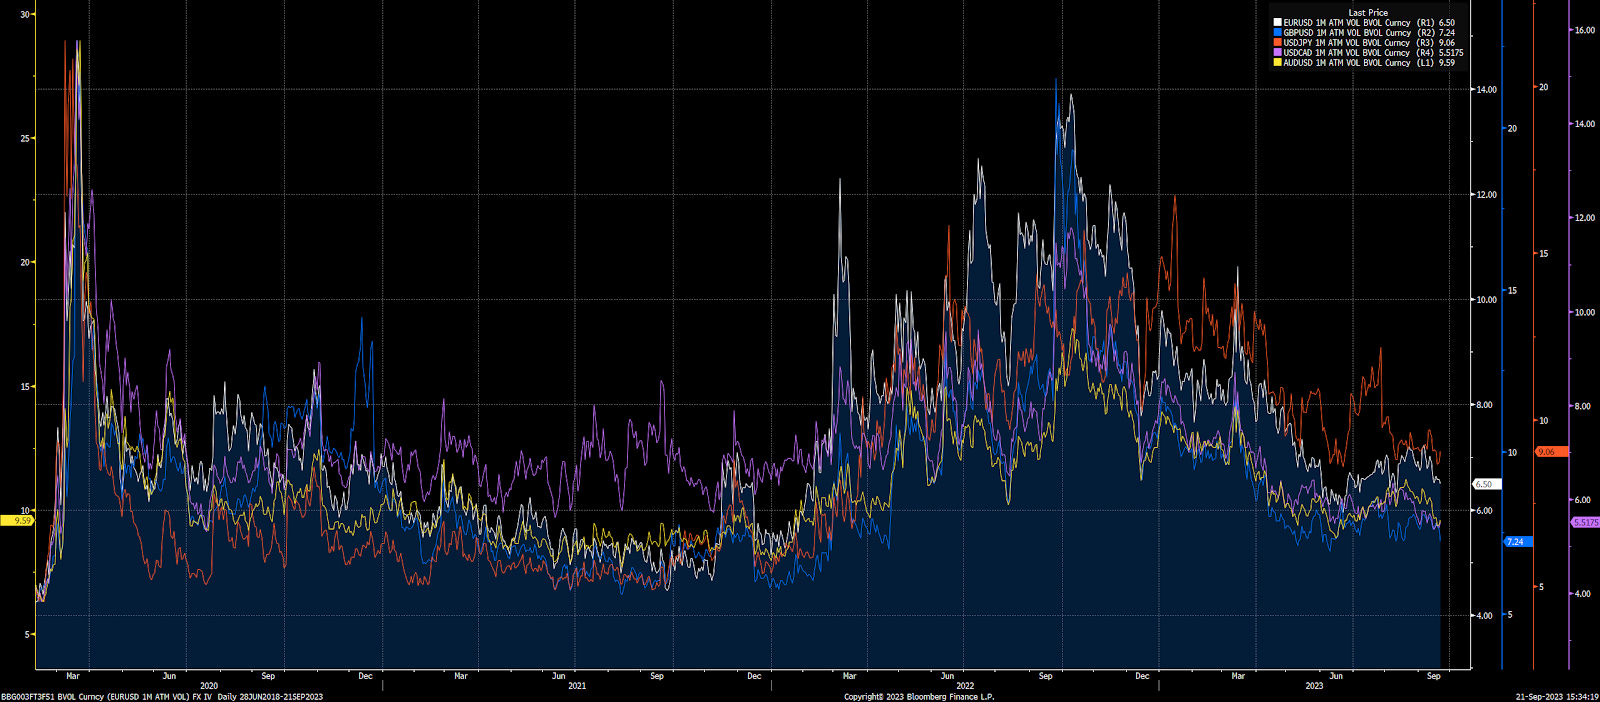
This dynamic of reflexivity decreasing is directly connected to the GIP (growth, inflation, policy) environment. However, this has created an environment where implied vol is incredibly low.
Notice that bond vol, equity vol, credit vol and fx vol continue to compress TOGETHER.

This TYPE of compression has caused a slow grind down in bonds and smaller ranges for almost every other asset. This compression in volatility is because a surplus of liquidity is being provided to financial assets.
These are the two main ideas that contextualize our current location in the economic cycle. Now we will break down each of these variables and show how they impact each asset class in financial markets.
Main Ideas for Macro Report:
Growth: Real GDP is at 2.40% QoQ indicating resilience in the US economy. Broad growth metrics continue to surprise expectations and show strength despite the level of Fed Funds.
Inflation: Broad inflation metrics continue to decelerate very slowly but not at the pace markets are pricing.
Liquidity: We continue to see broad liquidity remain accommodative for asset markets even though the dollar is rallying considerably.
Growth:
Nominal and real GDP are positive YTD. When we examine the cyclical components of GDP that have a higher sensitivity to interest rates such as investment, we can see they are at a low YoY. Real gross private domestic investment is negative YoY.

However, we have seen a QoQ reaccelerating in Q2 of 2023. This QoQ marginal reacceleration is a key observation to consider when thinking about the effectiveness and time lag of rate hikes.

We have seen a reacceleration of cyclical sectors in nowcasts such as the Atlanta FED

And Prometheus:


This marginal reacceleration of cyclical sectors is a key observation as it connects with inflation and liquidity. Interest rate hikes typically put pressure on cyclical sectors in the economy and thereby put pressure on output which can feed through to service sectors and broad consumption. Fundamentally, we are not seeing cyclical sectors put enough weight on output to cause consumption and the labor market to weaken. This creates the preconditions for inflation to fall slower than expected.
Personal consumption and specifically services remain the dominant weighting in GDP. Here is a chart of nominal personal consumption in goods and services. We can see that both are significantly positive in nominal terms:

If we look at real personal consumption in goods and services, goods are reaccelerating considerably as services remain resilient and positive:

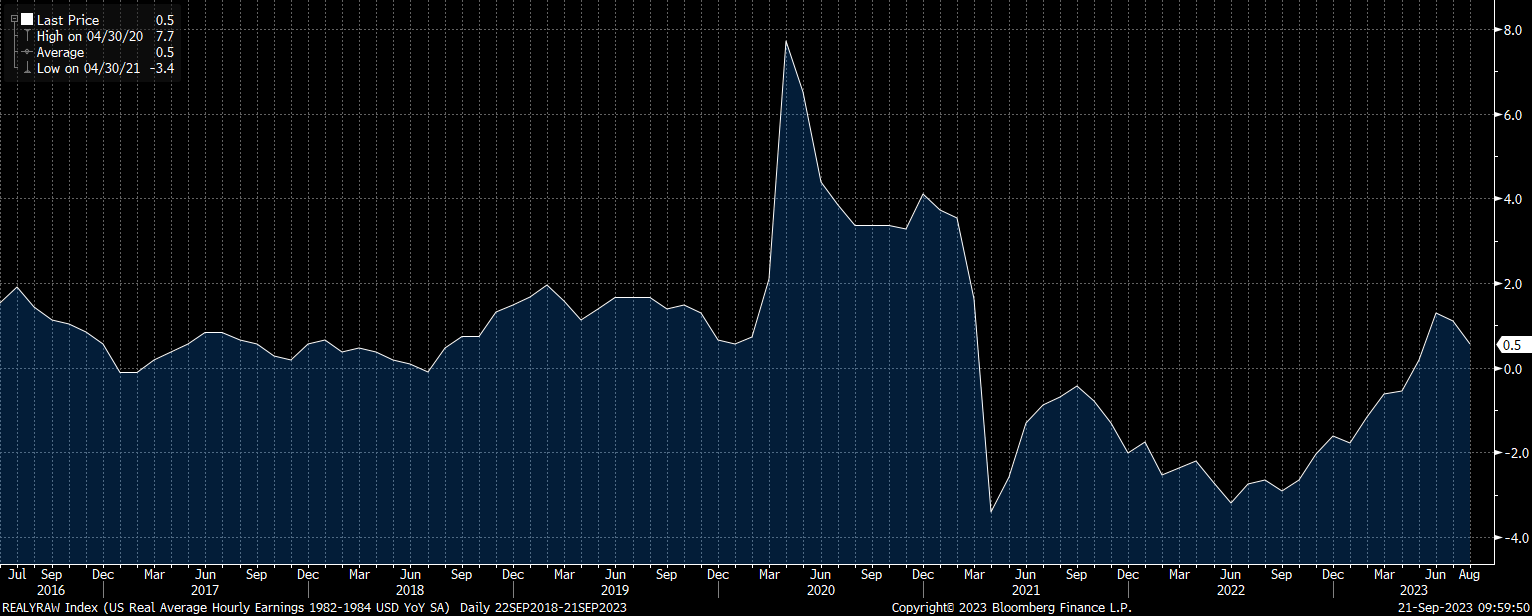
This is occurring at the same time real wages are rising:
The collocation of these variables has caused economic data to surprise expectations considerably:
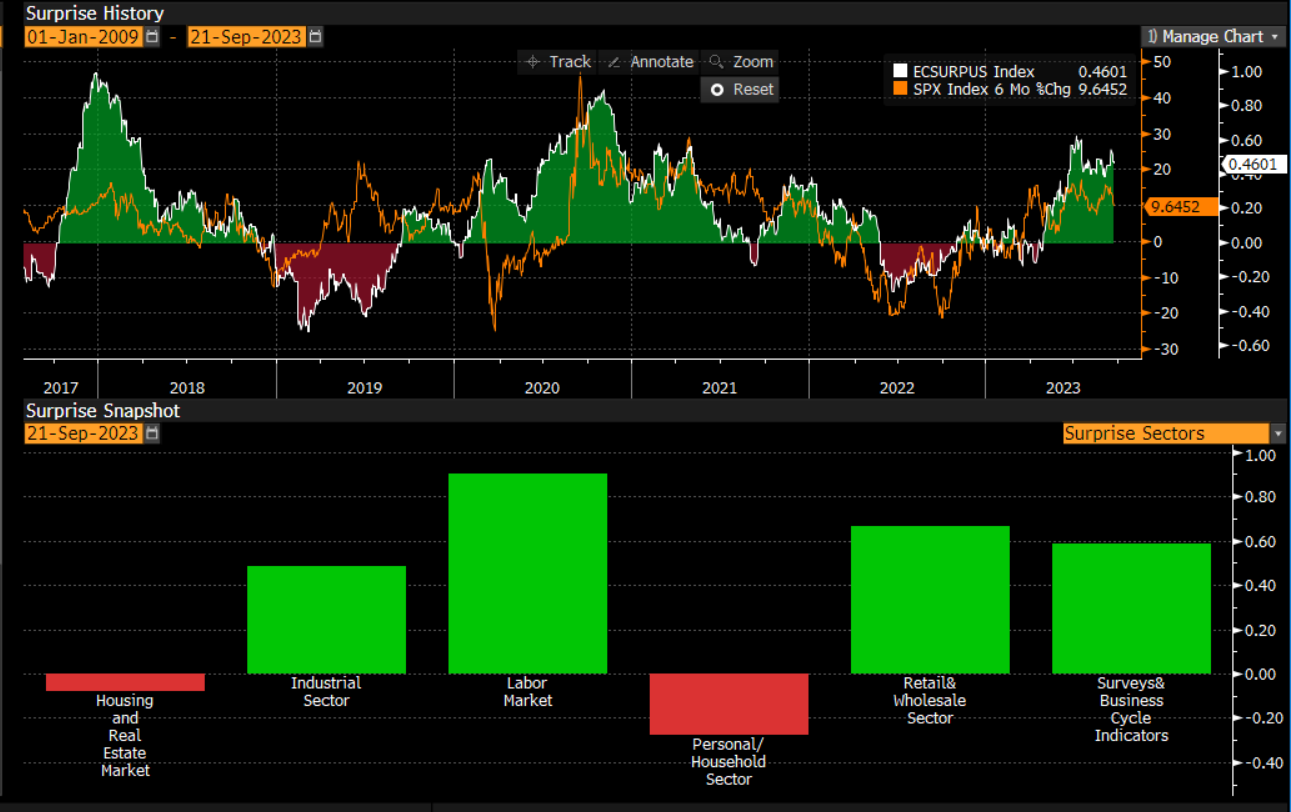
While individuals in the recession camp continue to show marginal evidence of slowing growth, we are not seeing a pervasive and persistent decline in growth across broad economic metrics. This transitions us to the topic of inflation.
Inflation:
As long as growth remains resilient, it will be difficult for inflation to decelerate to 2% or decelerate at the speed the market is pricing.
We are seeing a marginal reacceleration in headline CPI due to the energy component:
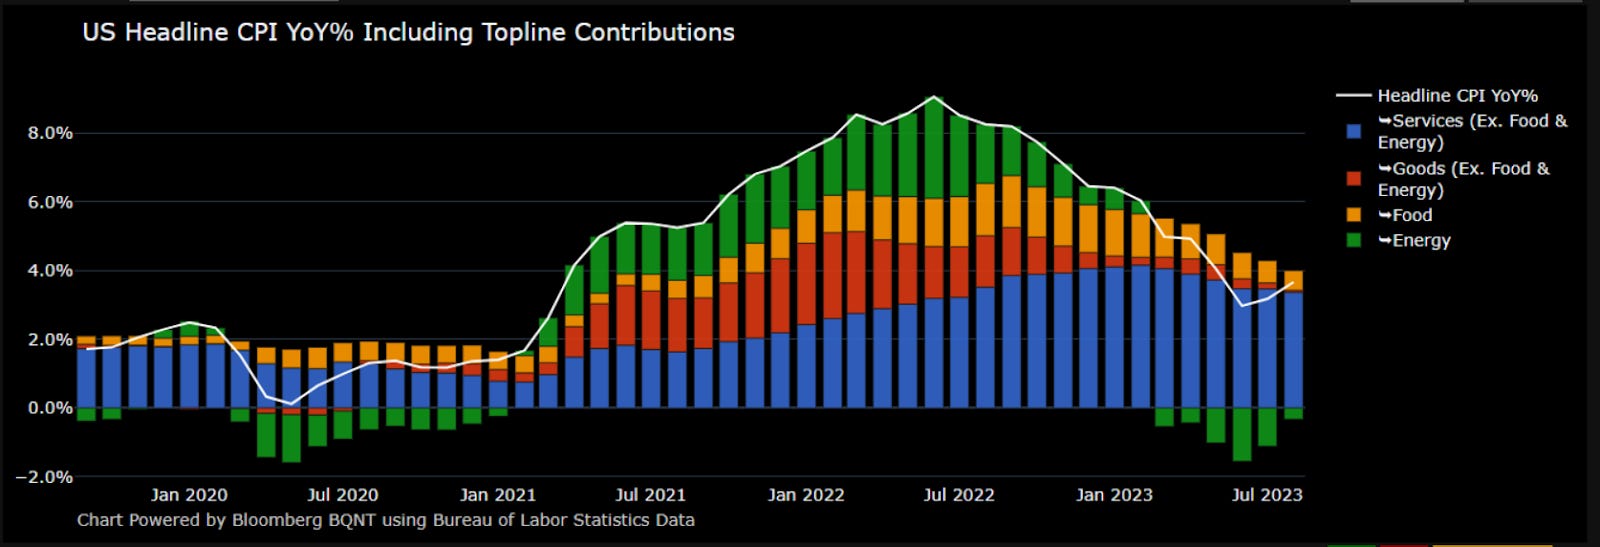
However, the main variable that matters to the FED and the market is services:

Core CPI is currently at 4.4% and the market is pricing 2.8% by November of 2023:
While this type of deceleration is possible, we would need to see the speed be between -0.50 and -0.75. Here is a scenario breakdown projecting various speeds out 6 months (If you want to know how to run this in ChatGPT, click this link):

The rate of change in YoY prints for the past several months could make this possible but there is still a risk since growth is significantly positive:

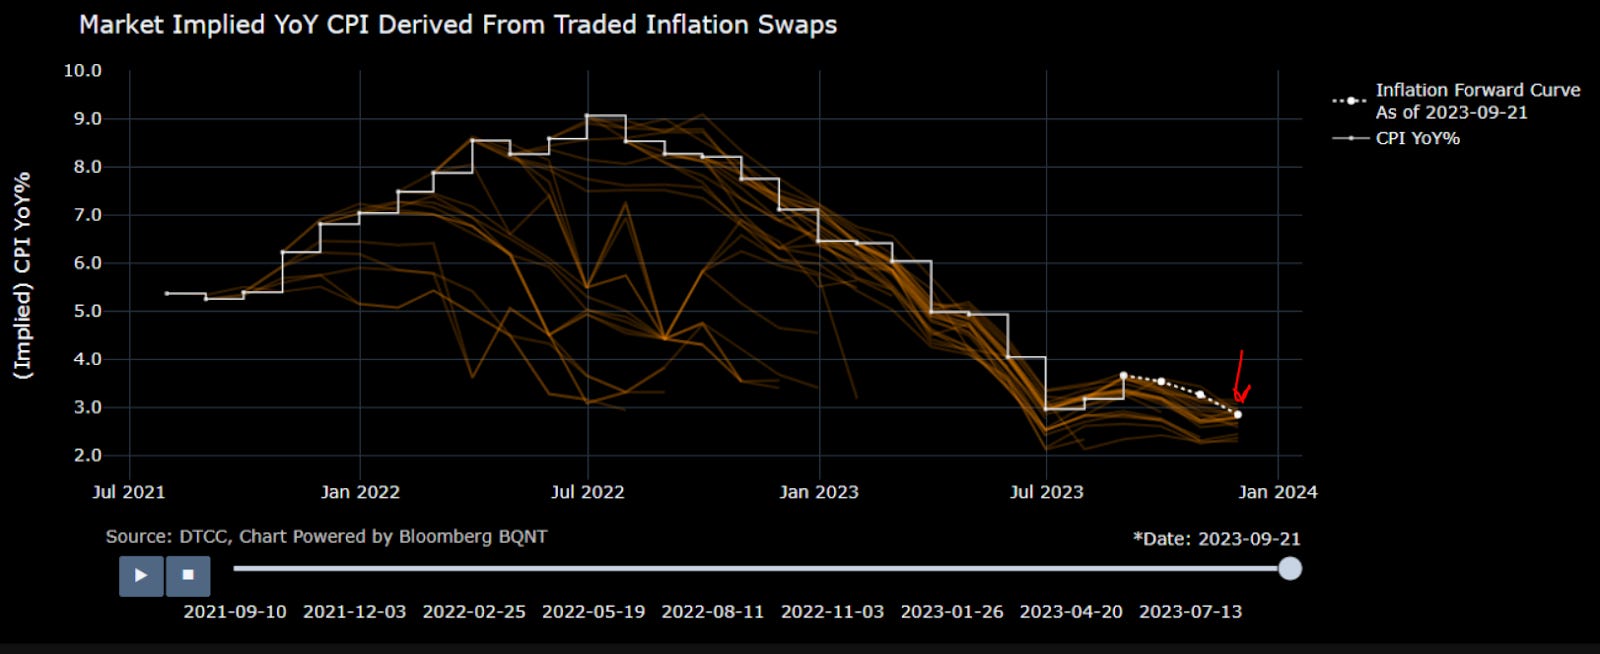
While both inflation swaps and the forward curve are pricing a more realistic PATH for inflation than they were 3 months ago, we are still not seeing the signals for a durable bottom in bonds yet:

There are two variables to keep in mind when comparing inflation to the Fed funds rate: 1) growth conditions and 2) the Fed’s forward guidance.
The Fed funds rate is above core inflation but since growth isn’t falling dramatically, there is still a risk of inflation reaccelerating. This risk of reacceleration is taken into account by the Fed which biases them to keep the terminal rate above or below the inflation rate for a specific periods of time.

The other tension is how much the FED is biased to overtighten or under-tighten. In sum, the spread between the inflation rate and Fed funds rate is typically determined by growth conditions and the Fed’s forward guidance. Right now, it is unlikely that the Fed will cut preemptively or simply because inflation is below Fed funds.
Liquidity:
Liquidity has accelerated YTD and is just beginning to slow but remains accommodative.
Over the past year, we have seen multiple liquidity impulses which is part of the reason valuations have expanded and volatility has been suppressed. This liquidity has been in the form of SVB liquidity injections, TGA drain, and bill issuance.
The shift we are beginning to see is directly connected to the treasury issuing a greater amount of long-duration bonds. This issuance has caused and will likely continue a bear steepener in the yield curve.

The bear steepener is likely to decrease liquidity marginally into the end of the year. However, we aren't seeing significant dollar shortages as a result. The rally in the dollar YTD has primarily been driven by monetary policy differentials as opposed to a dollar shortage:

When we look at cross-currency basis swaps as a proxy for liquidity, they are incredibly elevated indicating a dollar shortage is not driving the most recent price action. This continues to show that the dominant impulse in markets remains inflation, even if it's causing less volatility.

Synthesis of GIP:
We have seen an increase in both growth and liquidity YTD which has caused equities to rally and volatility to fall. This tension overlapping with a deceleration in inflation has caused the reflexivity between bonds and other assets to decrease.
Scenario Analysis:
Scenario 1: If inflation continues to decelerate at a slow pace and growth remains resilient, it is likely that volatility will remain low into the end of the year and potentially into Q1 of 2024. While we have the long-duration issuance that will decrease liquidity marginally, we haven't seen cross-asset volatility spike yet.
Scenario 2: If a negative growth impulse materializes then we could see a rise in delinquencies which would cause credit risk to spike. This would likely cause cross-asset class volatility to rise and likely a shift in correlations that would begin a regime shift. However, an imminent credit event or recession is unlikely right now due to the LEVEL of growth and its underlying drivers.
Scenario 3: If growth remains resilient, it is possible that we see a reacceleration in inflation which constrains the FED to hike again. This would likely cause volatility to spike again but it is unlikely to be as extreme as 2022 since market participants have a clearer frame of reference for this type of price action.
In my analysis, scenario 1 is what is currently taking place and is likely to continue taking place until some type of catalyst shifts the regime. In one sense, the pain trade is a slow grind in bonds to the downside without a considerable spike in cross-asset volatility. With these insights and tensions in mind, let’s examine each asset class in light of the current macro regime.
Assets:
Duration and Credit:
Interest rates on the long end have made a clean breakout to the upside. Many people believed we would see a capitulatory type of move if we broke to new highs but the conditions surrounding this move in rates are dramatically different than the environment in 2022.

The current environment has bond volatility moving down instead of up due to the GIP regime:

What would cause a spike in volatility to accompany a move in interest rates? It would likely be from a reacceleration in inflation or a significant negative growth impulse. YTD, we have seen inflation decelerate but the market mispriced the path as opposed to the direction. If inflation began to move up on a directional basis, volatility would likely spike indicating further upside for interest rates and Fed hawkishness.
The 10-year and 30-year interest rates are likely skewed to the upside until duration issuance is over or the yield curve has univerted enough to attract investors to take duration risk. The 2 year likely has less downside compared to the long end but if inflation accelerates on an outright basis then additional Fed hikes could be on the table.
When we look at the forward curve, there is a key tension to take into account in light of the most recent FOMC meeting. The November and December meetings are pricing a marginal probability of hikes since some of the participants said they see one more hike this year. However, the March contract of 2024 is pricing a marginal probability of cuts.

I think cuts are possible after Q1 2024 if growth and inflation fall enough but wouldn’t be betting on it yet. A key spread to watch is long the November FF future and short the March FF future. This spread simply reflects the premia that the market is pricing. If we pause into the end of the year and the March cuts get priced out due to the Fed implying, they will hold rates at an elevated level, this spread will move up. I think this is likely.

We continue to see Fed sentiment decelerate but we are likely to see some consolidation in their rhetoric as they hold rates at an elevated level into 2024.

The key thing to monitor into the end of the year is how the market digests treasury auctions and the new supply.


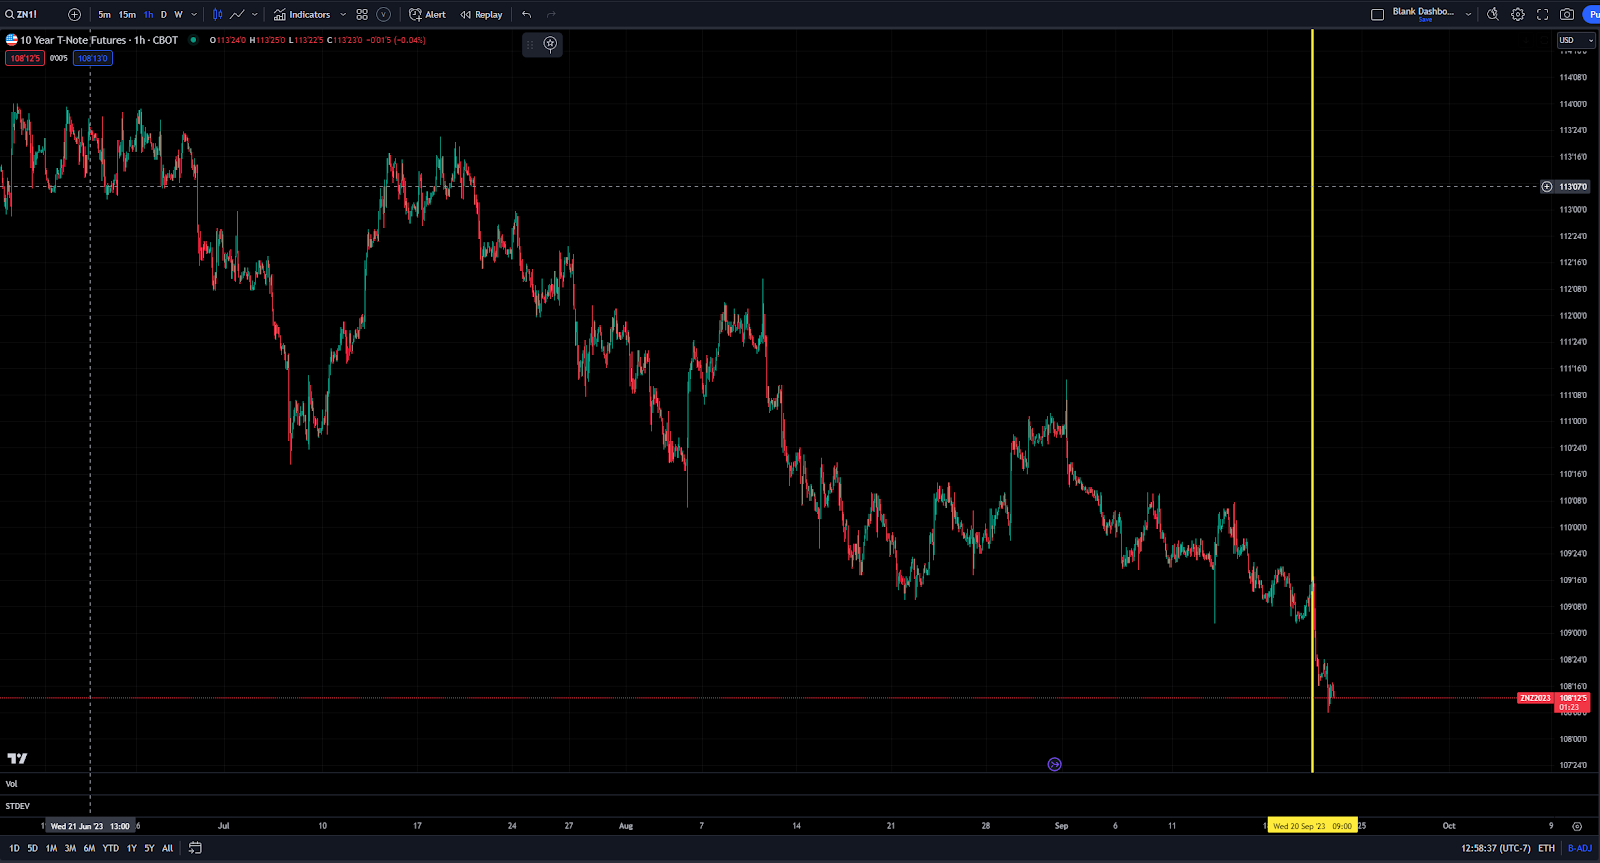
Price action across the curve continues to sell off on every major catalyst. The most recent FOMC meeting (marked by yellow) still couldn’t set a bottom in bonds indicating we have yet to set a durable bottom in bonds.
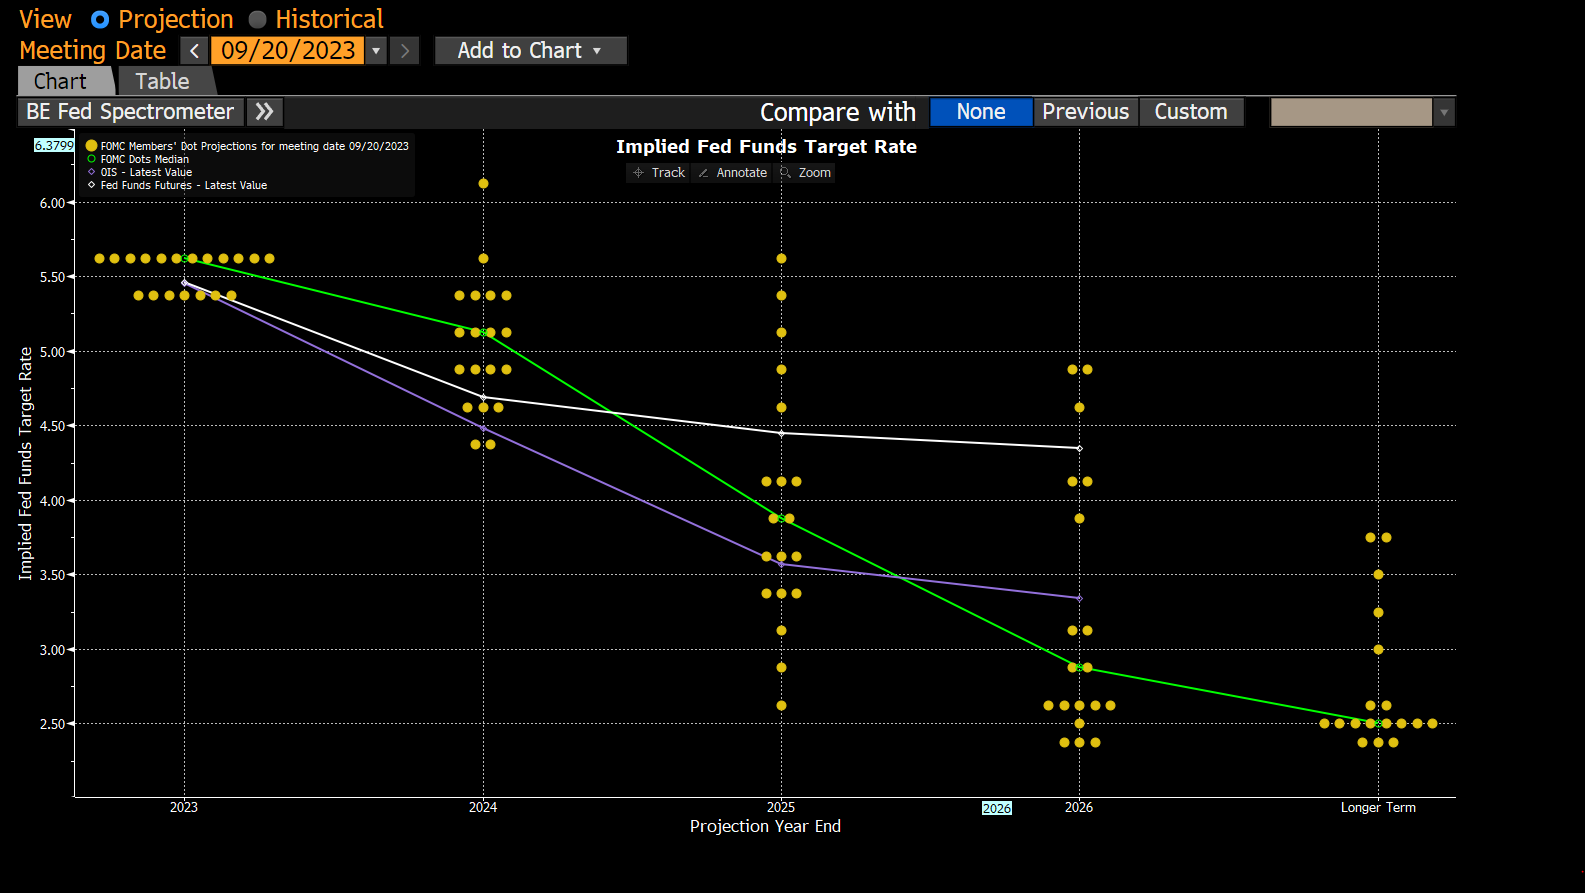
While the dot plot shifted marginally, it still says the Fed is likely to hold rates at an elevated level for a prolonged period of time. Furthermore, the Fed continues to say they are data dependent and not taking an extreme policy stance in either a hawkish or dovish direction from current levels.
While duration risk remains high, credit spreads remain incredibly low due to the macro environment noted above:
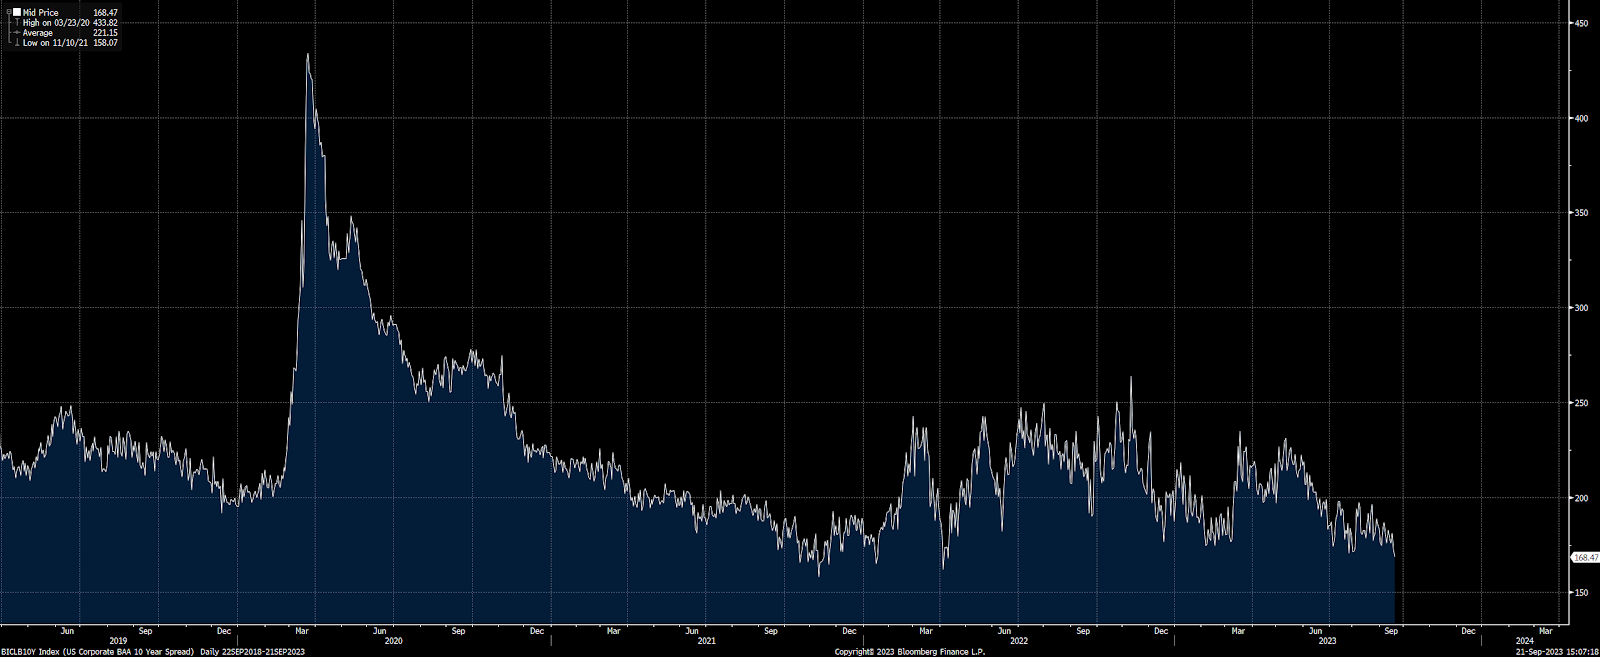
We might see credit spreads expand marginally during a bear steepener but we would need to see a negative growth impulse for a persistent rise in credit risk.
Equities:
Equities from a macro perspective are relatively simple right now. They have been incredibly rich because the majority of their rally has been valuation expansion. This has increased their sensitivity to changes in liquidity. We can see below the spread between SPX earnings yield and the 10-year:
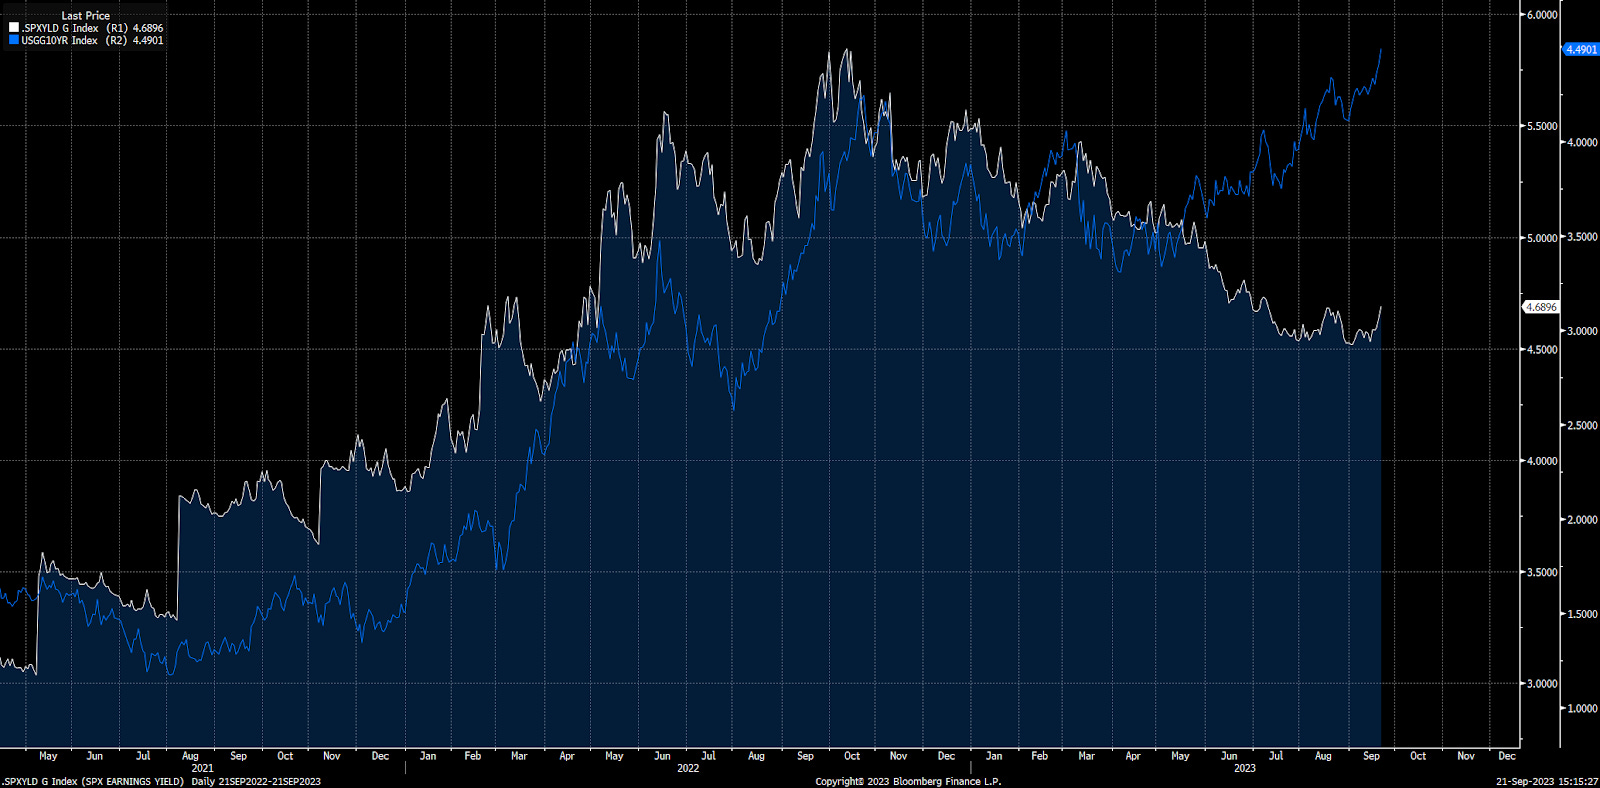
As we can see, the most recent sell-off in ES has been driven by the bear steepener. This downside in ES is likely to continue until valuations contract down to a reasonable level (likely around 4200) or the bear steepener stops because the market is able to digest the duration issuance.

This dynamic is causing the stock bond correlation to turn marginally positive on a short-term basis. In sum, this continues to show duration and inflation as the dominant impulse in this macro regime. This is true of FX as well.
FX:
When inflation is the dominant regime, monetary policy differentials are typically the dominant causal force moving exchange rates.
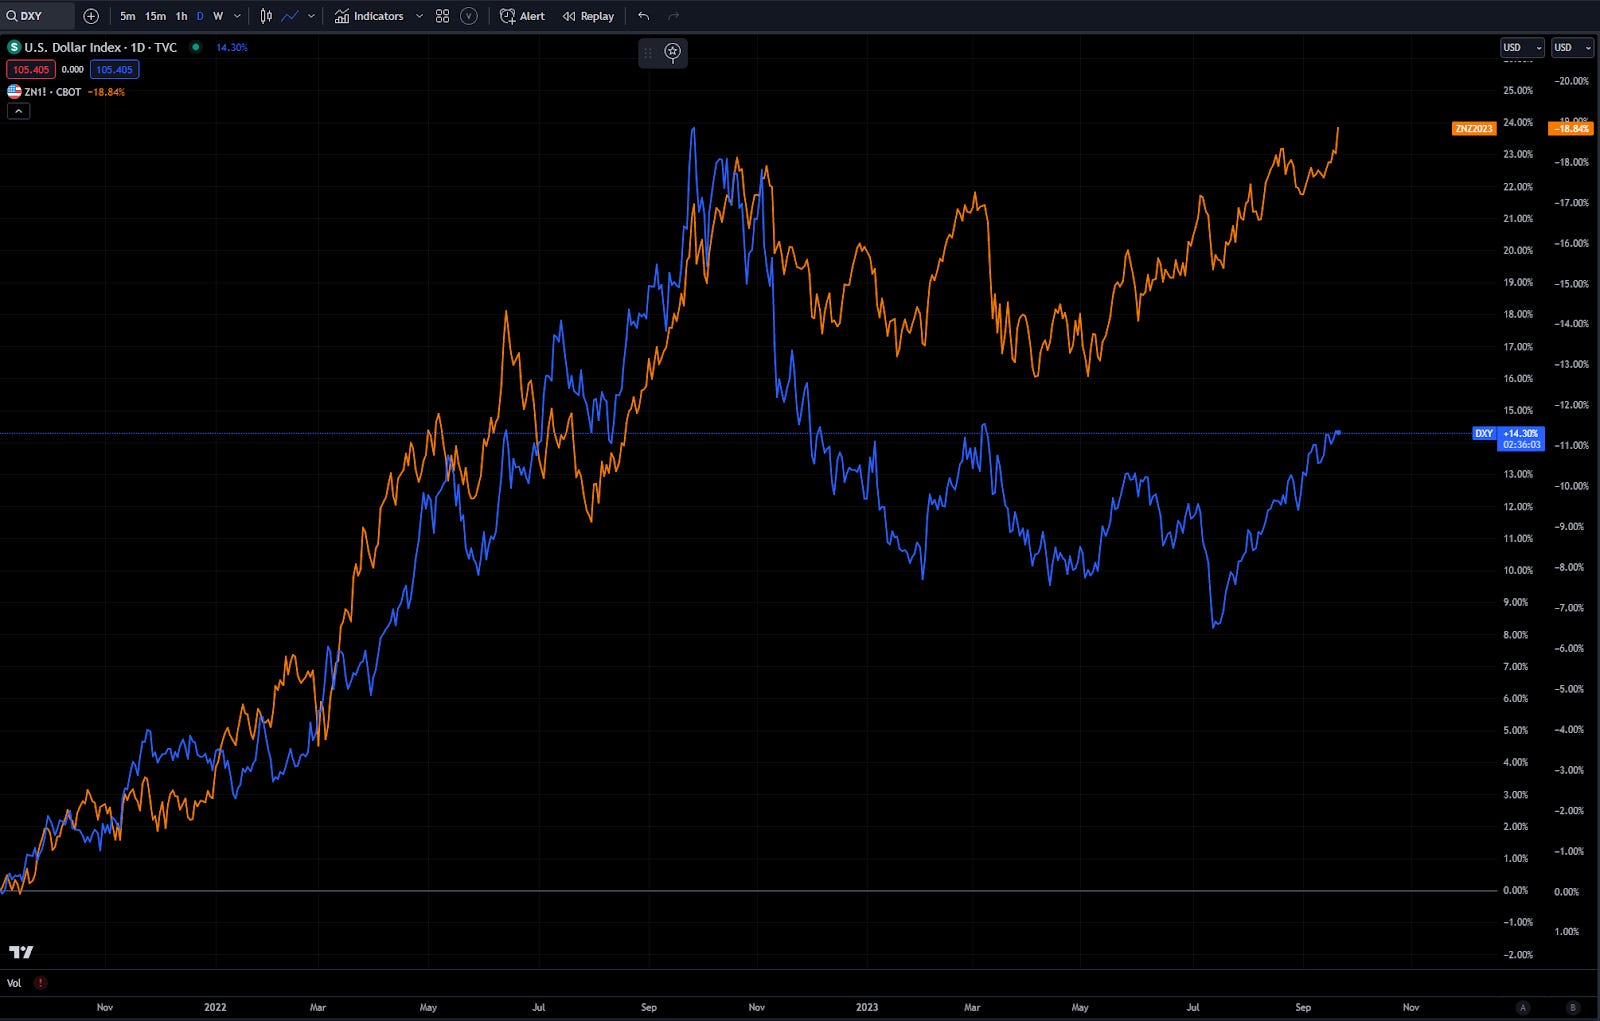
We continue to see a positive correlation between the DXY and bonds even though there has been a marginal divergence due to inflation decelerating:
We continue to see OIS differentials for the Dollar and Euro account for the price action in EURUSD:

Watching the Euro forward curve as it connects to the eurozone growth environment will be key for EURUSD price action in 2024:

Part of the tension is the growth differentials between the US and Eurozone right now. While inflation remains the dominant impulse, growth and credit are the release valve of risk that will eventually constrain monetary policy. Here is the Eurozone economic surprise index:

We are seeing the same dynamic in OIS differentials between the Pound and the Dollar as well:
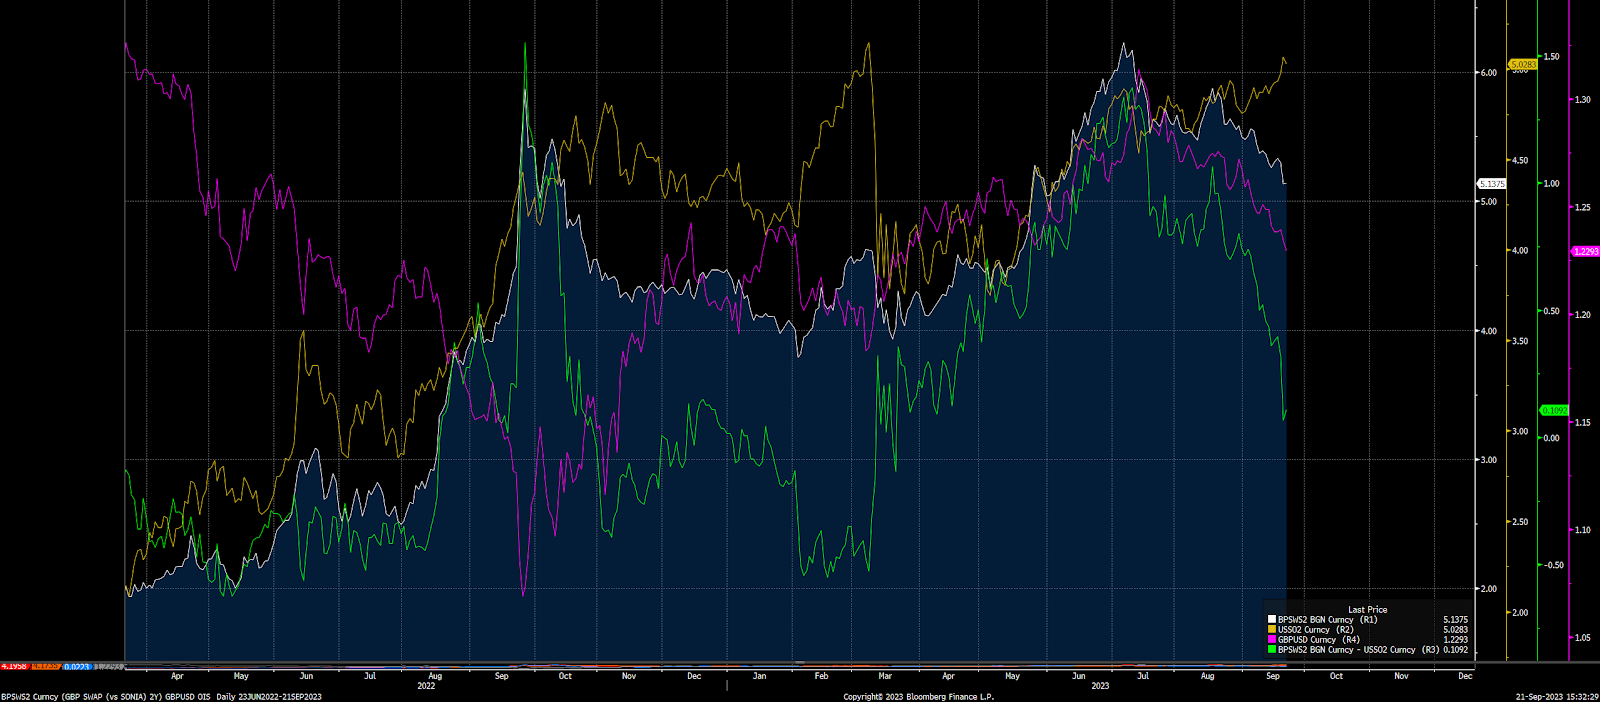
However, even though we are seeing a strong dollar, it is primarily driven by monetary policy differentials responding to inflation as opposed to credit risk and dollar shortages.
This is clear simply from XCCY and FX implied vol:

Crypto:
All major cryptocurrencies continue to move in lockstep with the liquidity situation. The injections of liquidity we saw this year were only able to push up BTC to the 31k level. However, the fact that it couldn’t break above 31k is telling to the upside in this macro regime.

The next crypto bull market will likely be driven by a considerable expansion in liquidity which will be a response to credit risk. We are still in an inflationary regime which means we still have a considerable amount of time before the next bull market.
The final asset to cover is commodities.
Commodities:
While commodities have decelerated from their 2022 highs, most of their price action YTD has been consolidation on a long-term basis.
Ags were unable to breakout to higher highs:

Nat gas remains in a range:

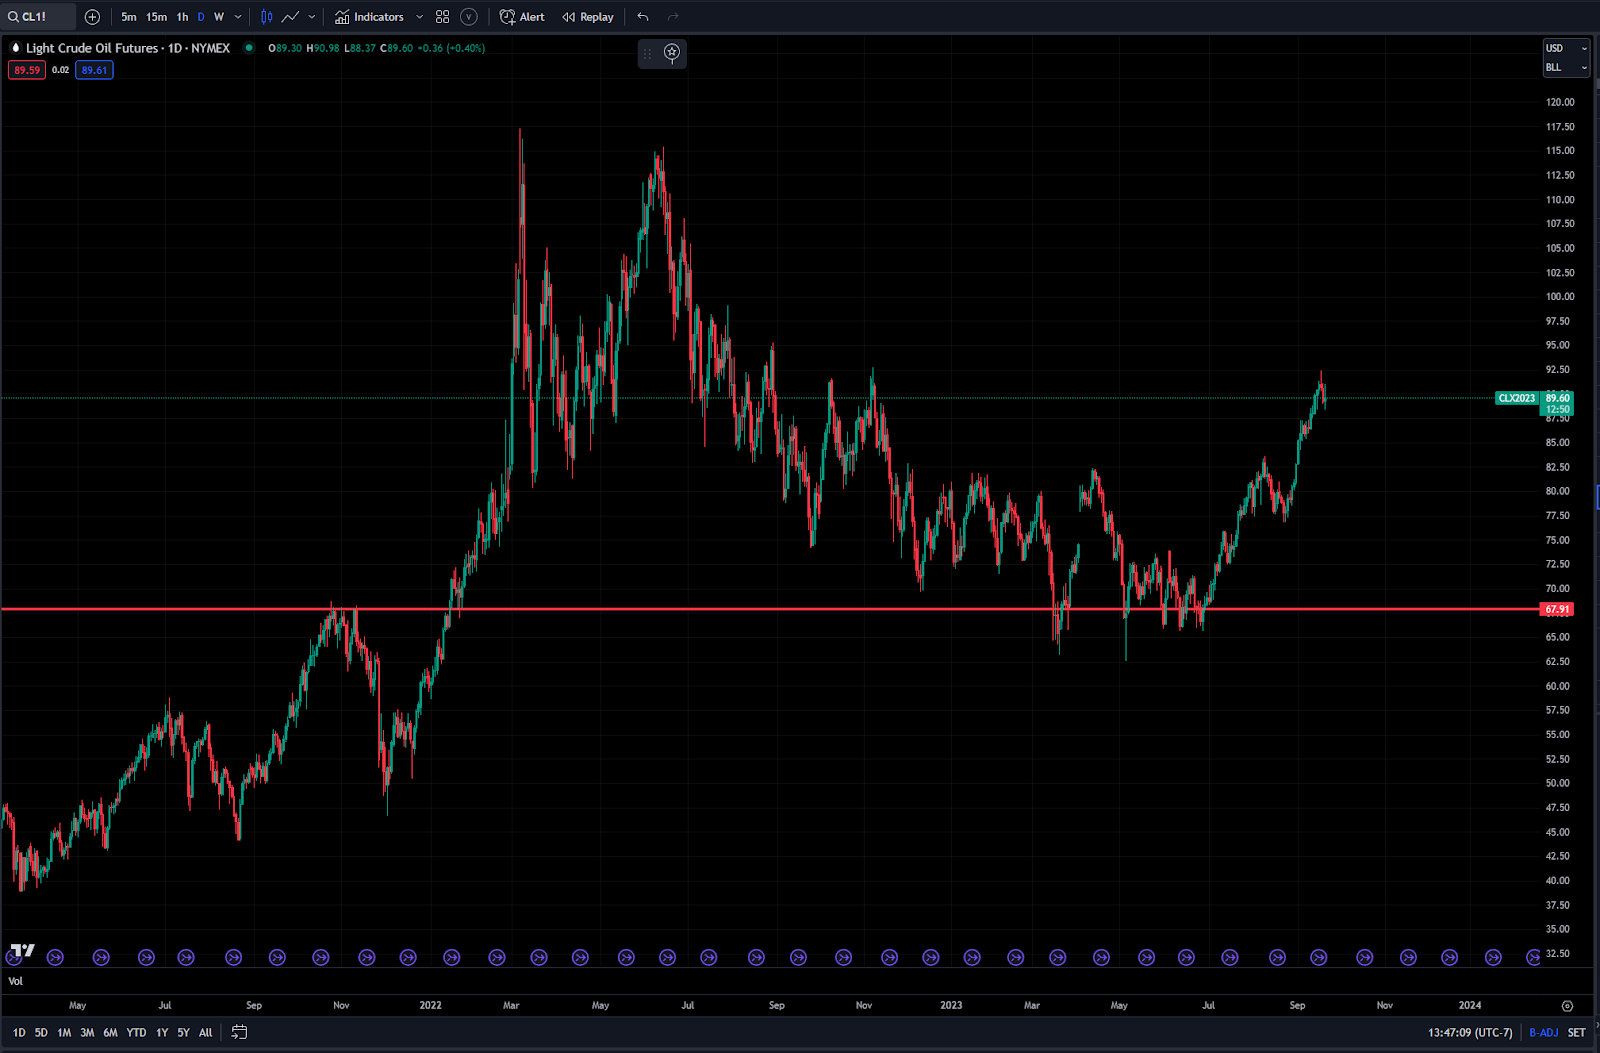
CL has rallied over the past couple of months which has caused headline CPI to tick up:
And gold continues moving with macro positioning as it remains in its range:
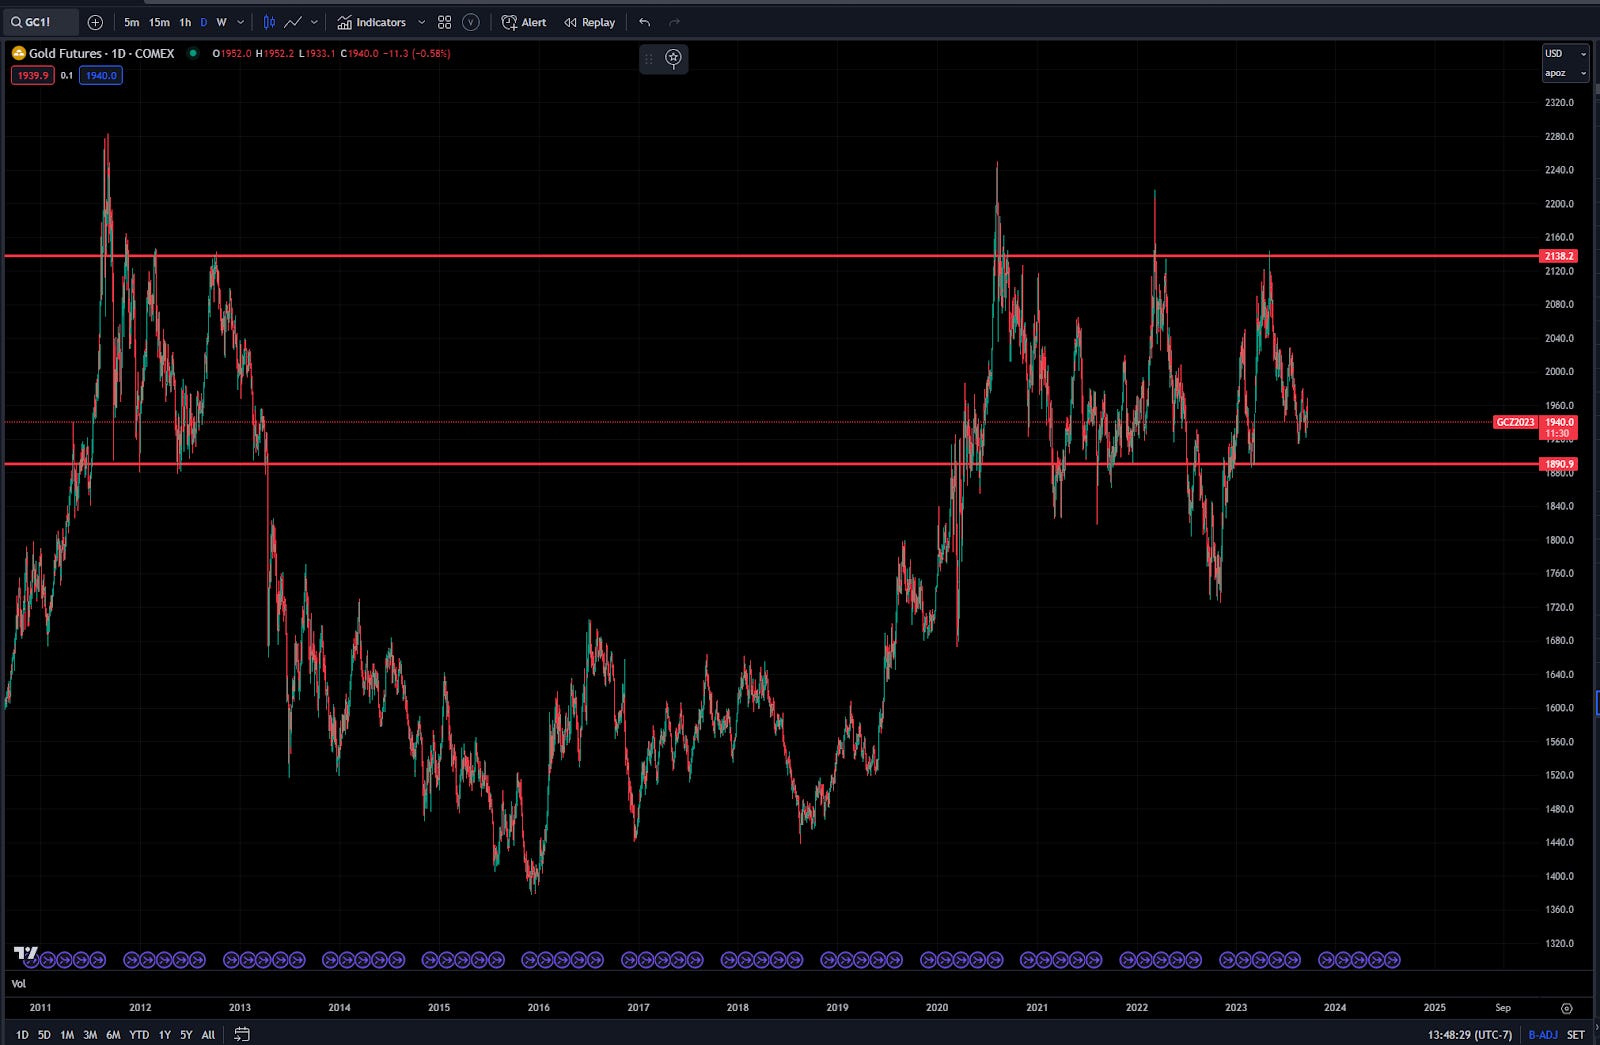
Until we see a considerable deceleration in growth, I would not be overly bearish energy based on the growth situation. Inversely, I wouldn’t be overly bullish on gold until we see a durable bottom in bonds take place.
Conclusion:
Even though inflation remains the dominant impulse in markets, the type of regime we are in is dramatically different than 2022 given the decrease in reflexivity and volatility. The slow grind down in bonds as implied vol decreases is reverberating across every other asset class. Fundamentally, there are two ways to squeeze out positioning: 1) squeezing it directionally in a short period of time or 2) stretching out price action over a prolonged period of time. 2022 was the former, we are currently experiencing the latter.

In the information age, you simply need to be at the right place, at the right time, with the right information to succeed
Thanks for reading!
Nice framework!
great work!and I see you mentioned liquidity in this report,want to know that what indicators you would use to monitor current liquidity conditions (like fed b/s or something else?)