Asset Class Report: Bonds, Equities, Quant Signals
Alpha generation into NFP, CPI and FOMC
The macro views and asset class views I have laid are taking place as expected. Equities continue to melt up because nominal growth is elevated, liquidity is plentiful and earnings are accelerating.
I noted this in the equity article (link) and most recent bond report (link). These cyclical views fall into a larger structural regime that is going to eventually change.
The Bigger Picture:
US financial markets have continued to rally and be driven by the valuation function. Many market participants will say this is irrational exuberance or “insane.” In reality, this is a very simple valuation function driven by macro liquidity. Growth and inflation drive the underlying cash flows of assets and liquidity drives the valuation for those underlying cash flows. However, as we go through different market regimes and the transmission mechanism of liquidity changes due to policy, the signal for macro liquidity shifts. This is why running simple regressions at inflection points failed because the rules of the game fundamentally change.
As a result of this dynamic, individuals who don’t understand the underlying mechanics, run regressions that are less precise and can’t make as nuanced implications.
The chart below is the P/S ratio of the S&P500 (white) overlayed with bank reserves (blue):
It is clear that we are at an extended level. For this to reverse, we fundamentally need to see a reduction in the quantity of money or deterioration in the underlying cash flows.
While we have just finished one of the most aggressive hiking cycles in US history, these arent transmitting through to the balance sheets of companies due to the low levels of debt in the S&P500.
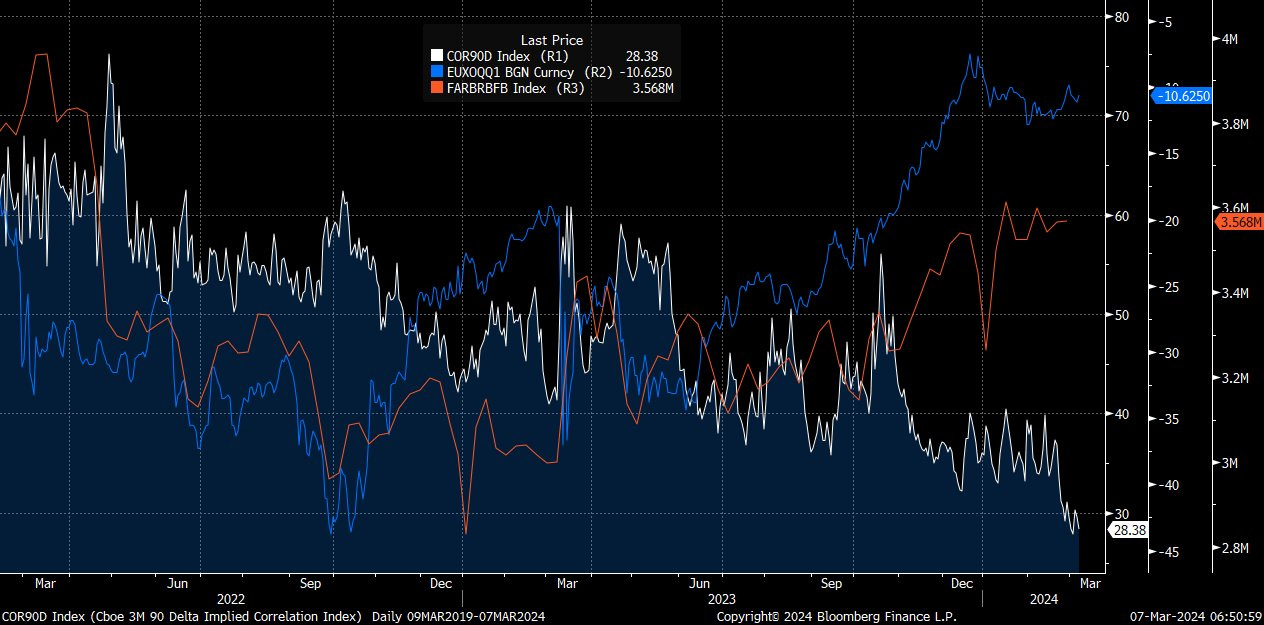
Since the hiking cycle isn’t impacting financial conditions enough to cause a recession, growth is resilient. As the Fed holds rates at an elevated level, the quantity of money is the marginal driver of liquidity. This is why implied correlations (white) are so low as cross-currency basis swaps (blue) and bank reserves accelerate (orange):
This is likely to persist: see article by Concoda (link)
This liquidity dynamic is reflective of the new regime we are in where the Fed is between a tension of supplying liquidity to keep asset prices elevated and killing inflation. (Visual from Totem Macro report)
Whitney Baker had an exceptional interview on this recently:
While many market participants continue to view these markets as a “bubble”, it is a very clear liquidity mechanism. These structural dynamics need to be connected to cyclical views and proper market timing.
Asset Class Analysis, Views and Trades:
My view of the DXY has been laid out in the macro reports:
As macro liquidity expands, the DXY is likely to move to 96 this year:
While interest rate differentials are compressing, monitoring the relative money supply will be critical for the DXY view. Here is a chart of the Fed balance sheet (blue) and ECB balance sheet (white):
Fundamentally though, this dynamic is being expressed in cross-currency basis swaps:
I touched on this dynamic in the Podcast with Paper Alfa :
The dollar liquidity situation directly connects to views for equities and bonds here. These tensions are critical to understand at this juncture of the macro regime.
Stock-Bond Relationship and Individual Views:
Keep reading with a 7-day free trial
Subscribe to Capital Flows to keep reading this post and get 7 days of free access to the full post archives.


