Asset Class Report: FX
DXY Analysis and Signals
This article is meant to be the third of the “Asset Class Reports” (see “About” Section) focusing on FX. I laid out the updated version of this Substack in this report: link
Today, we are going to specifically focus on the dollar. The FX reports will cover all major FX currencies but due to the extensive amount of analysis required for each individual currency, I will typically focus on 1-2 currencies per report.
FX is incredibly complex and difficult to understand. The primary reason is that the causal factors driving price action change through various structural and cyclical regimes. If you want to dig into FX more, I wrote a 5 part educational primer breaking down how to analyze and trade FX:
The Research HUB: FX Primer, Pt 5
Hey everyone, This is Part 5 of the FX Primer! 5-Part FX Primer Breakdown: Part 1: FX - Resources, The Big Picture, Variables, Aggregating Knowledge, and Essential Tools. Part 2: FX - Synthesizing Information from Part 1: Theory, Practice, Causal Mechanics vs. Regression Analysis.
Big Picture:
When we think about FX, the underlying mechanics are always the same but the specific drivers of price action are dynamically changing.
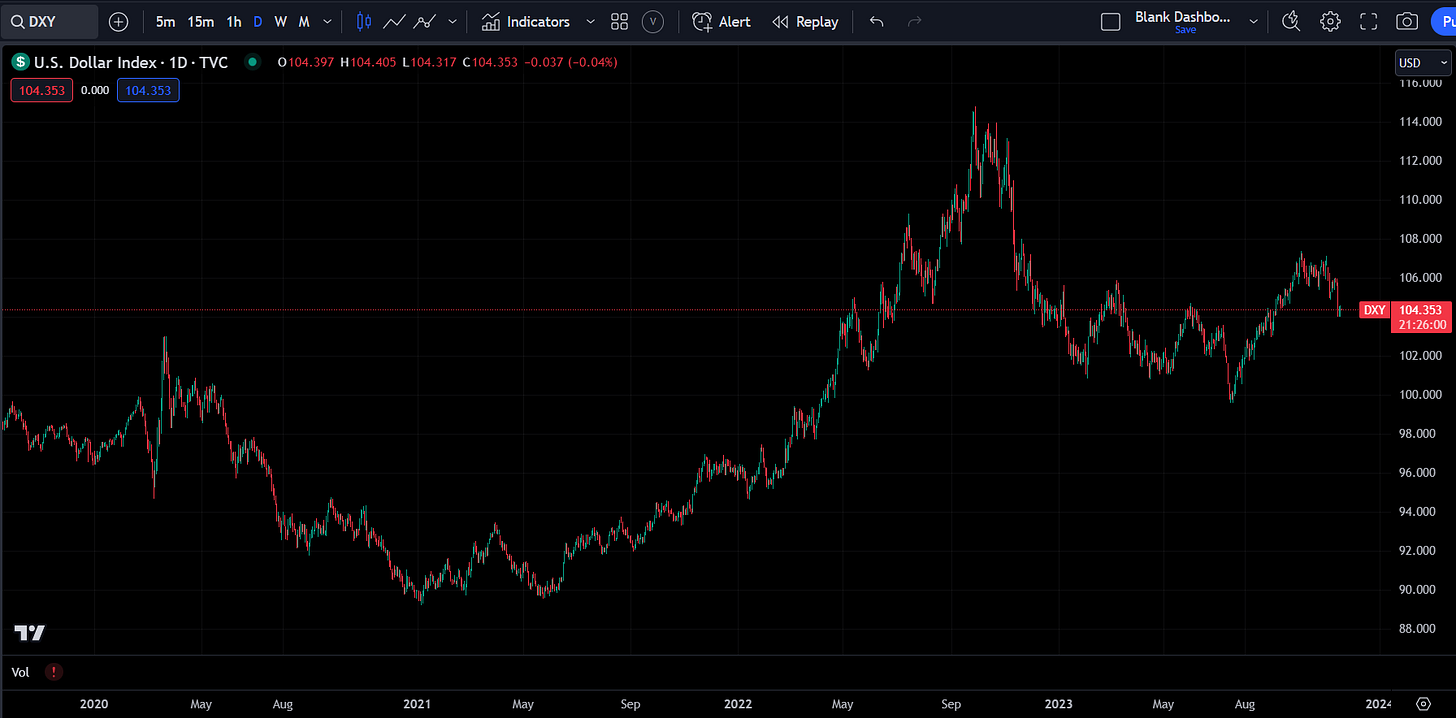
The DXY has moved in lockstep with the GIP impulses we have seen. During 2021 there was a dramatic rise in asset prices as liquidity was injected. This caused the expected returns of assets to decrease. As we move into 2022, the FED hiking cycle pushed BOTH stocks and bonds down thereby causing their expected returns to go up. As we moved into the end of 2022 and through 2023, interpreting price action required greater specificity since there were multiple GIP impulses that occurred. While there were multiple GIP impulses occurring, they were weaker in strength compared to the impulses we saw in 2022.
During 2022, the peak in the DXY overlapped with the peak in interest rate expectations on both the long end and short end. Here is a chart of the DXY (blue), 2-year OIS (orange) and 10-year OIS (white):
There has been a marginal divergence between nominal rates and the DXY due to multiple factors such as: 1) The speed of rate hikes decelerating, 2) the SVB crisis, 3) the US debt ceiling issue, 4) a surprise in US growth during 2023, and 5) the bill and duration issuance by the Treasury.
Since all of these factors had less of an impulse than the rate hikes of 2022, we have seen the DXY chop in a range on a cyclical basis. Even though this range has been wide, it has been difficult for CTA funds to make money in the DXY during this period of time. This reflects the difficulty of just running a trend-following model on the DXY and the necessity for more informed views that are connected with macro drivers.
As we move into the end of 2023, the DXY and its correlations with other assets will be directly connected to the relative GIP dynamic we are likely to see between the US and Europe.
Attribution Analysis:
As I have noted previously, we remain in a regime where inflation is the dominant impulse. This impulse is fading but it is still the primary thing driving price action. This is exemplified by the fact that the dollar continues to move with interest rate differentials:
Keep reading with a 7-day free trial
Subscribe to Capital Flows to keep reading this post and get 7 days of free access to the full post archives.


