Hello everyone,
I cannot emphasize enough the importance of where we are for both interest rates and risk assets. When implied volatility is blown out this much, it is time to generate alpha. This is why we are here!
In order to frame the context better for everyone, I have taken the paywall off the macro report I did 1 month ago. While many things have changed, the process of thinking will be incredibly helpful and show why the macro report is so valuable:
As a reminder, there will be a price increase TOMORROW!
Everyone who is currently a Paid Subscriber has access to all of the in-depth macro research and trades at the current price ($60/month or $720/year). This price will never change for you. In order to continue future innovation and the quality of research, the price for new subscribers will be increasing.
This price will be increasing to $70/month or $840/year on Monday, August 5th. If you subscribe BEFORE then, you will lock in the lower price ($60/month or $720/year) and never pay more than this. If you are here early and long the Capital Flows Substack, then you get to lock in the lower price for all the future upside.
This would be a great time to even do a free trial so that you can read the full macro report.
Enjoy the macro report!
Introduction:
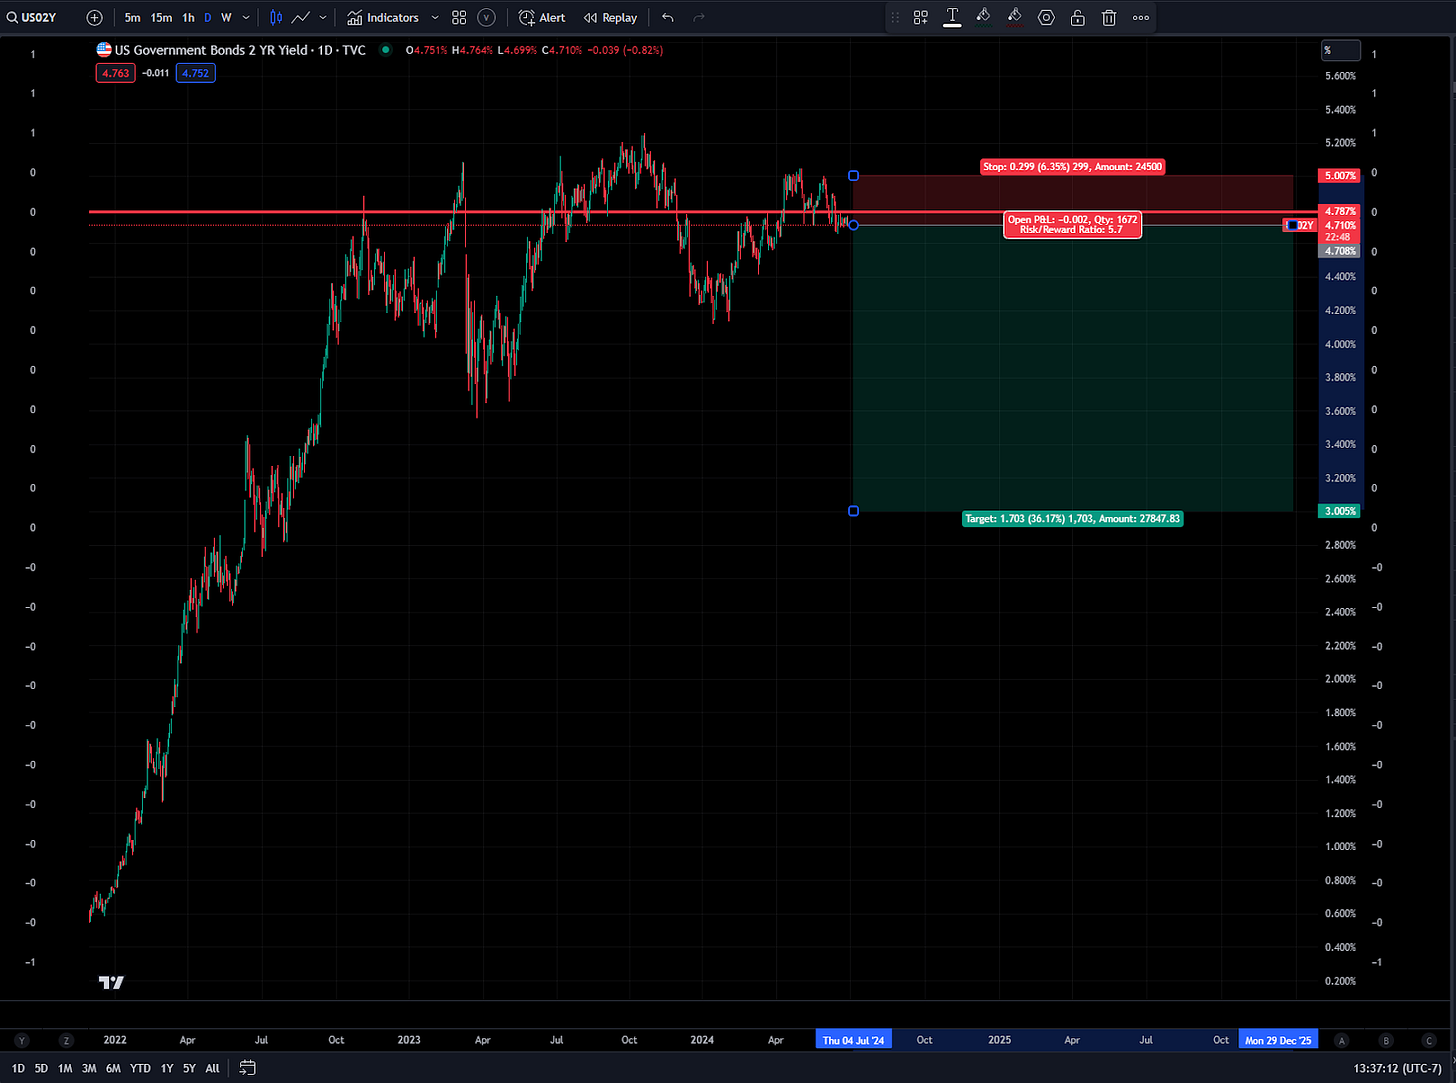
The last macro report (published 6/28/2024: Link) noted the following about the 2 year and provided the respective risk reward in the chart below:
“If inflation reaches the 2% target in 2025 and the Fed targets a 100bps spread between core CPI and Fed Funds, this is still 100bps of cuts that need to be priced in to the 2025 SOFR contracts. At the very least, this creates a significant skew to the downside in rates on the short end. If the 2 year was at 5% at the previous FOMC where the market was expecting a potential “hawkish pivot” this functions as clear resistance on a cyclical basis. If we reach 2% inflation with 100bps spread between Fed Funds and inflation, we could see the 2 year significantly lower from here.”
Since this time we have seen the 2-year move down approximately 100bps.
The macro context and drivers behind this move are important to understand because they contextualize the critical place we are at now. During 2023, the resilience in growth allowed the Fed to target a higher spread between Fed Funds and inflation. You will notice the Atlanta Fed GDP-nowcast put in highs at the same time as the 2-year repriced higher:
Fundamentally, growth sets the preconditions for how high or low the Fed can hold the discount rate above/below inflation. As we approached the end of June when the last macro report was published, the level of the 2-year was skewed to the downside for two reasons: 1) The level of growth was lower than 2023 which justified a narrower spread between Fed Funds and inflation, 2) the forward path of inflation to reach the 2% goal was actually a reasonable outcome.
Since the last macro report, interest rates across the curve have moved DOWN as the curve bull steepens. However, additional economic data has been released to update macro views and the forward curve holds significantly less asymmetry to the downside compared to when the June macro report was published. This report will break down the current dynamics with growth and inflation to explain what is likely to unfold through the remainder of 2024 and the beginning of 2025. Additionally, it will show how these macro tensions contextualize the risk-reward for interest rates and risk assets across the curve.
Growth:
When we look at nominal and real GDP on a longer-term basis, we need to remember that all assets are pricing (and directly connected to) the outright change in GDP as well as the relative relationship between nominal and real numbers. During 2020 we had an extreme in one direction as noted by the spread between nominal and real GDP in the bottom panel of the chart. This set the preconditions for an extreme in the opposite direction where nominal GDP was significantly elevated above real GDP. Since the Fed started the rate hiking cycle, we have been in the process of normalization of this spread. You will notice that the spread in the bottom panel of the chart has been sequentially moving UP for years now.
When we zoom in a little, we can see that we are in a tension between two extremes on a cyclical basis: The first extreme is that we move into a deflationary recession comparable to 2020 or 2008. The second extreme is a reacceleration in nominal growth comparable to 2021 or 2022 where nominal growth accelerates while real activity remains resilient or accelerates as well.
The financial media and investment bank research puts continual focus on these extreme tails on either side of the spectrum. This is even reflected in financial markets with the forward curve pricing a 50bps cut in the next meeting on a single data print even after Powell said they aren’t considering it.
When we analyze the underlying components of growth and inflation in the economy, the highest probability is that we will continue to be in a regime where there are inflation scares and growth scares but none of them materialize into the tail event consensus is expecting. For example, earlier this year inflation came in above expectations and had a marginal reacceleration on a short-term basis. This pushed the pricing of the forward curve to the back half of 2024. However, there was no cyclical reacceleration in inflation.
We are now at a point in time where a comparable situation is happening in growth. The most recent NFP print showed the unemployment rate tick up by 20bps. This shows a marginal acceleration above the moving average but still from a low level.
The question we need to ask is, will this 20bps increase (an occurrence that is common historically) have persistence? If we look at the market-implied expectations in the forward curve and response from equities, traders are positioned for a continued deterioration in growth. If this is simply a “growth scare” that doesn't turn into a cyclical contraction in growth then the market will need to reprice the forward curve with fewer cuts and risk assets higher from their recent pullback. This is why understanding if the move in the labor market has persistence behind because it will contextualize and even drive interest rates and risk assets through the end of the year.
Big picture, when we look at growth, we want to ask if there is a pervasiveness and persistence in an expansion or contraction. When a reflexive feedback loop in growth begins to occur, then a negative growth impulse can feed on itself and turn into a recession. However, if there isn’t a pervasive feedback loop, then we will simply have dispersion in the growth of various sectors in the economy. Dispersion will occur when some sectors are expanding and others are neutral or contracting in their growth rates. This is why looking “under the surface” is valuable. The way in which we properly analyze the full picture of growth is by going through each line item of GDP and the respective datasets nowcasting them.
GDP:
When we look at the most recent GDP data it is clear that the main line items of GDP are all in expansion. Personal consumption, fixed investment, and government consumption are all expanding on a QoQ basis.
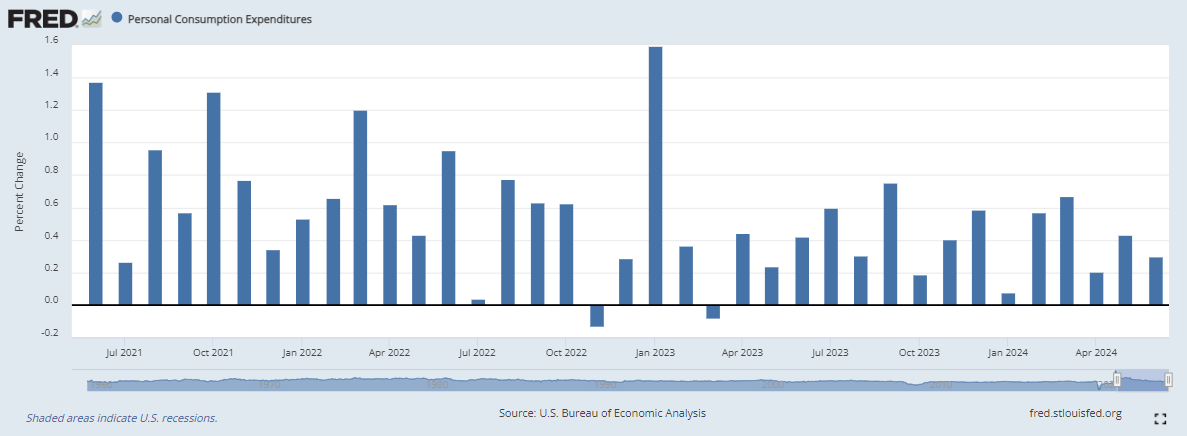
The monthly personal consumption (largest weighting in GDP) numbers from the personal income and outlay data remain strong on a YoY basis:
MoM accelerations remain in positive territory as well:
When we look at the goods and services line items of personal consumption in real terms, services (blue) remain very strong, and goods (red) remain positive as well. Goods (red) will typically have a higher sensitivity to interest rates and are be more sensitive cyclically. This is illustrated in their contraction during 2022 when the Fed was hiking interest rates. Now that we are moving into a cutting cycle, we are likely to see continued resilience.
We are at a point where understanding the level and diffusion of growth is critical. For example, in 2019 we had the ISM manufacturing and services PMI well below the 50 level but real GDP remained positive as the Fed cut rates. Powell even referenced this period of time as an example in the most recent FOMC meeting.
During this period of time interest rates trended down as equities rallied. Additionally, you will notice that there were multiple pullbacks during this period of time where the stock-bond correlation flipped back and forth. The period during May and June is likely a reasonable comparable for the current period of time:
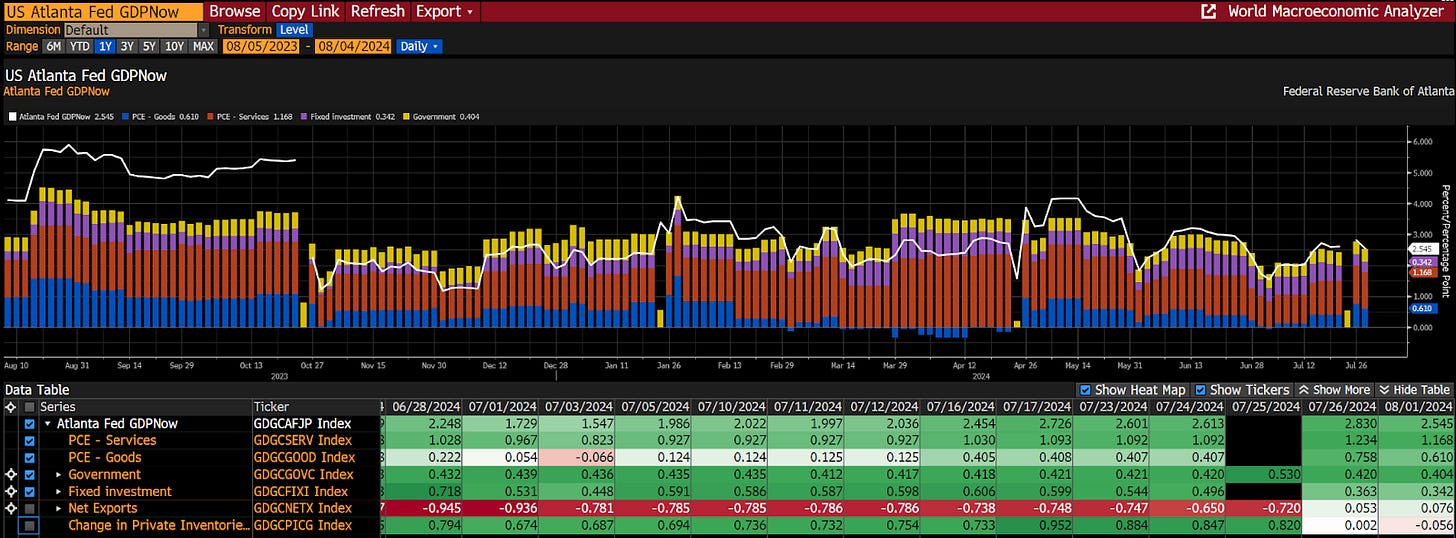
Circling back to GDP, we know consumption remains strong which is the largest line item in GDP. When we look at the Atlanta Fed nowcast we see can both consumption and fixed investment remain positive.
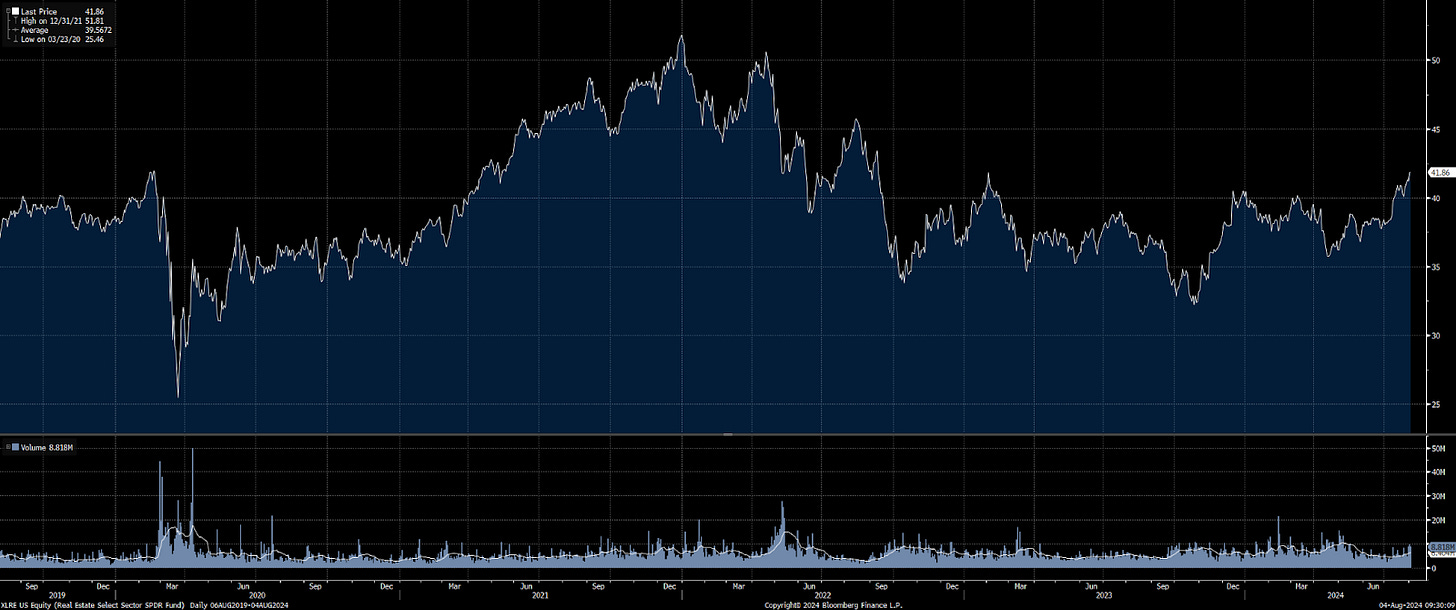
While there are concerns in the commercial real estate market that could impact fixed investment, these are likely already priced in and the most recent rally in REITs indicates that the beginning of the cutting cycle is going to be a net benefit. This is especially significant since XLRE has rallied during the drawdown in the index.
Additionally, construction in the residential continues to show resilience and significant discontinuity from the early warning signs pre-2008. For example, building permits and housing starts haven't fallen nearly as much as 2008 and this was primarily due to the rate hikes which are now over.
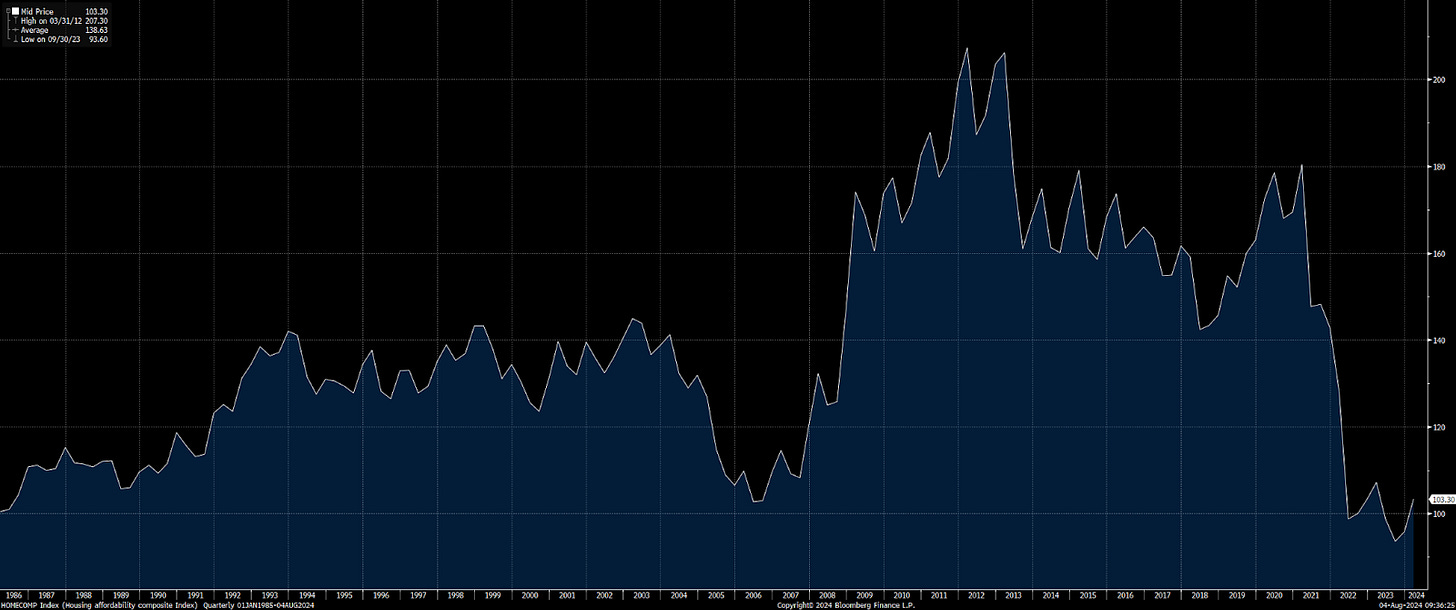
Even a marginal acceleration in the housing affordability index as mortgage rates fall could provide considerable support to the residential fixed investment line item of GDP:
Existing home inventory still remains well below 2008 levels. Additionally, we aren’t seeing a rise in delinquencies forcing homeowners to sell and thereby dump large amounts of supply on the market.
Overall, fixed investment and cyclical sectors are likely to have more volatility due to their heightened sensitivity to rates. However, we aren’t seeing an outright contraction that would cause investment to drag on headline GDP so that it would go negative.
For example, if the Atlanta Fed GDP nowcast had fixed investment move into contraction similar to 2022 then this could begin to drag on personal consumption. However, you will note that the labor market was even stronger in 2022 than it is today. This is why the fixed investment contraction couldn't feed into headline GDP. Since the labor market is now less strong than it was in 2022, a weakness in cyclical sectors could have a larger impact and thereby increase the risk of a negative feedback loop on growth. This is a risk to monitor but there isn't a clear signal implying the increasing probability of a recession.
The final line item of GDP to note is government spending. We have seen government spending consistently contribute between 50bps and 100bps to headline GDP numbers. This is incredibly large given the current growth rates in other line items of GDP.
Overall, GDP remains supported by government spending and the Nowcast is projecting 40bps of contribution to headline GDP.
The primary implication to take away from the line items of GDP is that to see a recession, we need to see one or more of these line items contract enough to either drag on other sectors or pull down the headline number. We aren’t seeing this right now which is why we are likely seeing a growth scare in the most recent NFP numbers and market price reaction as opposed to the beginning of a recession that will materialize in 2024.
As a reminder, we are still adding new jobs to the labor market every month. We are simply adding fewer jobs than in 2023. Less growth can’t always be extrapolated into a contraction and recession.
To be clear, the marginal softening we have seen with growth is incredibly important as it connects with inflation and interest rates.
Inflation:
The marginal softening we have seen in growth from the 2023 numbers set the context for the path of inflation and the degree of restrictiveness the Fed implements in its monetary policy decisions.
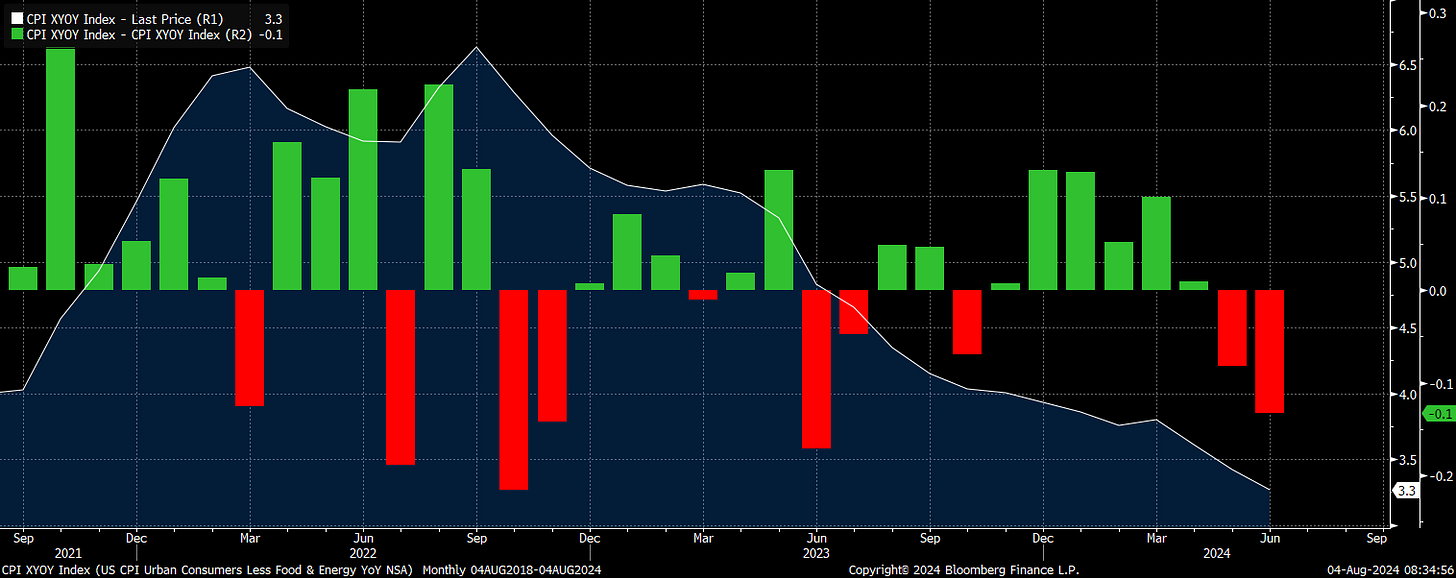
Headline CPI and PCE numbers continue to decelerate and remain skewed to the downside:
Core CPI and PCE also continue to decelerate and remain skewed to the downside. The recent softening in growth confirms that a considerable reacceleration is unlikely:
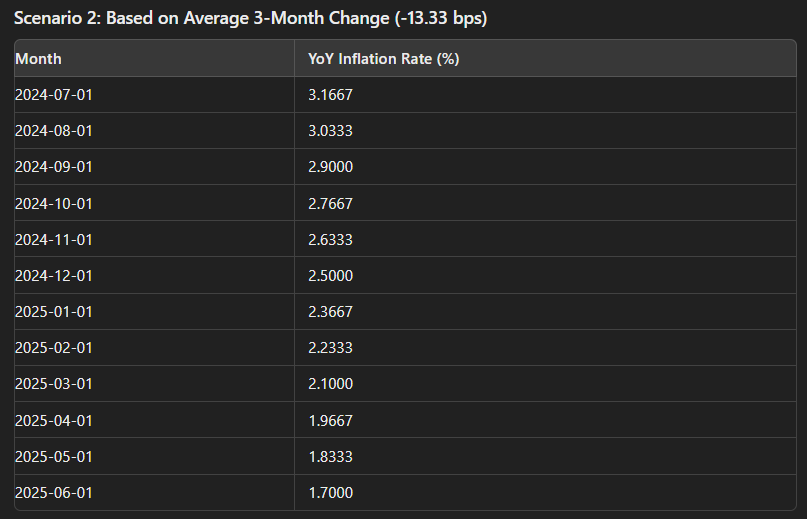
Both the Fed and the market are fundamentally focused on Core CPI. While many market participants try to provide an alternative perspective with other line items or alternative datasets (Truflation), neither the market nor the Fed cares about these. We remain below the 3-month average for core CPI and have seen a continual deceleration over the last 3 prints.
If the speed of the previous 3 months remains roughly the same, we are likely to arrive at the Fed’s 2% inflation target during Q1 or Q2 of 2025.
However, the expectation was already established in the last macro report and was clear 1 month ago. The question facing market participants now is the speed of rate cuts into the end of 2025 and the degree of restrictiveness the Fed will have.
Fundamentally, the Fed is targeting a spread between Fed Funds and inflation. Growth is the release valve that determines this spread. The Fed is been able to hold the discount rate significantly above inflation due to the resilience in growth. As growth has softened from 2023, this spread will narrow. After the short-term inflation surprise at the beginning of this year, it was clear that both the inflation function and growth function skewed rates to the downside. This is the primary idea that the last macro report laid out. (Chart below is Fed funds minus core CPI).
Before we move into the market’s pricing of these tensions, let’s break down the scenario analysis for growth and inflation:
Scenario 1: Inflation continues falling and hits the Fed’s 2% target in Q1-Q2 of 2025. Growth remains positive but remains between 1-2% real GDP on a QoQ basis. The beginning of the cutting cycle will provide greater support to cyclical sectors and the strength in services will remain constant. While there might be some cyclical weakening in some sectors similar to 2019, it is unlikely to drag headline GDP numbers negative for Q3 and Q4 of 2024.
Scenario 2: Inflation continues falling and hits the Fed’s 2% target in Q1-Q2 of 2025. Growth remains marginally positive but begins to contract as underlying weakness reflexively feeds on itself. This results in the potential for negative real GDP prints in nowcasts at the end of Q4 and in real GDP data at the beginning of 2025. In a scenario where growth significantly deteriorates, this would likely cause inflation to reach the 2% target in early Q1 of 2025.
Scenario 3: As interest rate cuts are realized, we begin to see growth and inflation receive significant support due to a less restrictive stance by the Fed. As a result, growth and inflation begin to consolidate into the end of the year. If the Fed cuts into a consolidation (meaning YoY inflation and nominal GDP is flat) of growth and inflation, this could create a scenario for growth and inflation to surprise to the upside in 2025.
Scenario Probabilities:
Scenario 1: 80% probability
Scenario 2: 10% probability
Scenario 3: 10% probability
Summary: based on the current state of economic data and the overall skew, scenario 1 is the highest probability for the macro regime moving into the end of this year. If the data begins to shift away from this scenario then the probabilities can be updated. As the evidence and respective risk reward stand, scenario 1 is the highest probability right now.
Interest Rates:
On a cyclical basis, we have begun moving into an interest rate-cutting cycle. As noted in the last macro report, short end rates were likely to trend down into the end of 2024. This move down has caused the curve to bull steepen thereby pushing more capital out the duration risk curve on a marginal basis. We are now almost at an uninversion in the curve at -9.35%.
While interest rates remain skewed to the downside and we are likely to see an uninversion this year, the SPEED at which the forward curve has priced cuts is becoming highly unrealistic. The market is now pricing a high probability of a 50bps cut in September:
The December 2025 SOFR contract is pricing a 3% Fed Funds rate:
If the forward curve is pricing 9+ 0.25% cuts in the next 16 months. On top of this, the market is pricing a 50bps cut on the front end at the September meeting. This implied future by the market occurred at an incredibly fast rate after Powell’s comments and a single NFP report. Given the growth and inflation context laid out above and unrealistic speed at which the forward curve is pricing the future, the downside for rates on the short end and long end is low for the month of August and likely into the next FOMC meeting on September 18th.
The updated levels for the 2 year are noted in this chart. We are unlikely to move back above the FOMC level but the pricing has created significantly less asymmetry for being long ZT (2 year futures) for the next 2 months.
Bonds are likely to begin hitting resistance over the next 2 months as well until we reprice the short end marginally. ZN is approaching a resistance level and we are unlikely to make significant moves higher. While the cyclical skew for bonds is to the upside right now, any shorting must be done with a high degree of precision. The better option is waiting for a potential pullback or consolidation and adding additional duration exposure for when the curve uninverts.
Bottom line, interest rates have significantly less asymmetrical downside over the next 2 months. However, on a cyclical basis, they remain skewed to the downside because we are entering the beginning of a rate-cutting cycle where inflation is likely to reach the Fed’s 2% target in 2025. While the Fed is moving interest rates with inflation and targeting a specific degree of restrictiveness based on growth, risk assets are the release valve pricing the degree of growth relative to the time value of money (which is reflected in the risk-free rate).
Risk Assets: Credit, Equities, and Bitcoin
Assets across the risk curve in both their sector and factor exposure are directly linked with underlying growth. We have seen credit spreads rise marginally from their lows during this most recent pullback in equities.
We have seen the S&P500 fall 7% from its all-time highs so that it is now up 7.80% on the year:
This pullback in the S&P500 has overlapped with a bid in bonds which is a flip in the stock bond correlation we have seen over the past two years: (ZN inverted in chart below)
The question to answer is if there is more downside in risk assets? There are several big-picture qualifications we should make before digging into the answer to this:
The S&P500 historically generates 9-10% average yearly returns over the past 50 years. We were up 16% YTD before this pullback in equities. It is not surprising that we had a pullback.
Earnings expectations continue to come out positive and we are primarily seeing a positioning unwind as opposed to a recessionary bear market.
We continue to see a rotation out of tech into real estate, utilities, and health care in the S&P500. You will notice 1-month returns have real estate, industrials, and financials with positive returns. These are most certainly not signals confluent with recessionary conditions.
Credit risk (CDX in white) didn't begin increasing when the rotation out of NQ (blue) into RTY (yellow) began but post FOMC and into NFP when the Russell was falling:
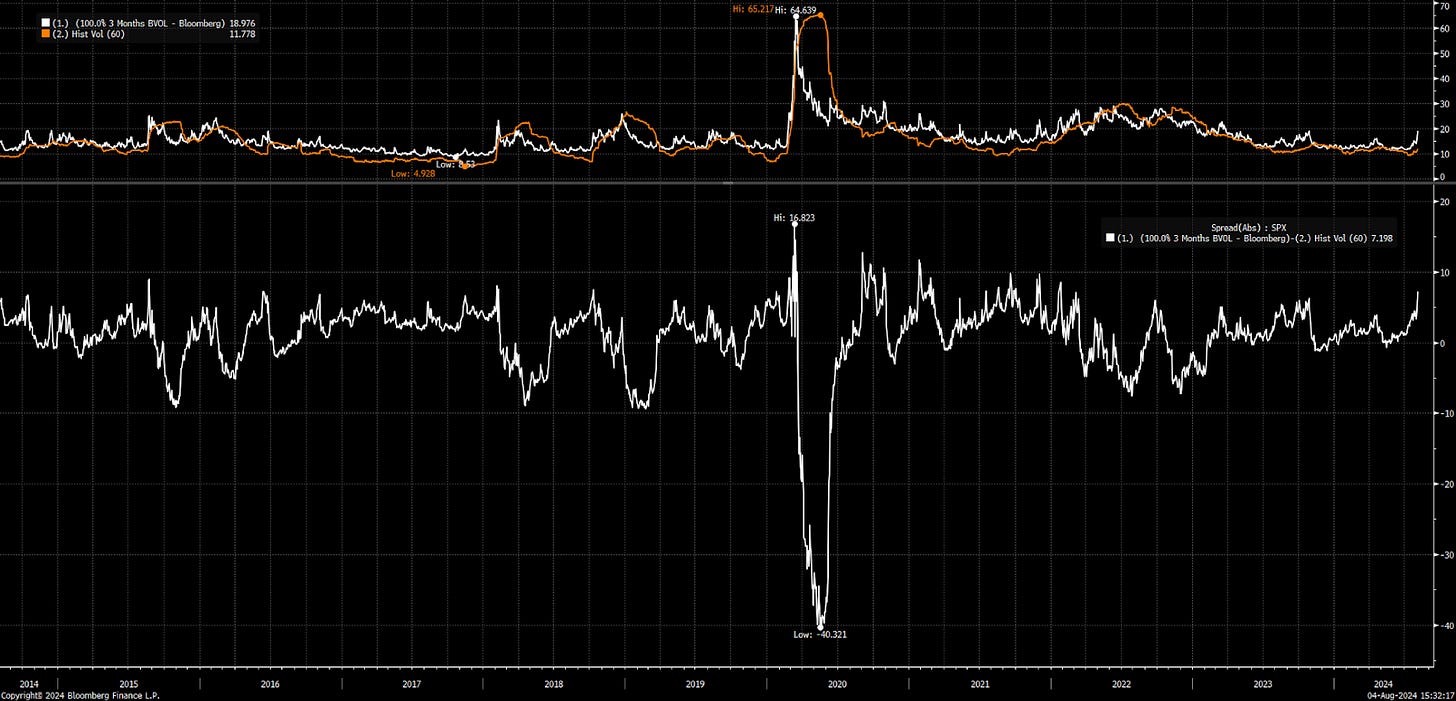
Finally, the rotation we have seen is directly connected to the implied correlation and vol premiums we have been seeing over the past month. We are seeing implied correlation revert back from their lows and implied volatility premiums reach historically high levels. Both of these are normalizing from low levels and are now extrapolating the single NFP print to a recession in a very similar way that interest rates are.
This capitulation in positioning for risk assets is directly connected to the extreme pricing of the forward curve. Notice that the bid in the Z5 contract overlapped perfectly with the ES sell-off last week:
With this context, let’s circle back to the original question, is there persistence in the downside for risk assets? The answer is that it is unlikely since the macro regime remains one of positive growth. We are in a period of time where positioning in markets is fighting the tension of realizing the fundamental returns in assets. Even if it is the case that we are heading into a recession in Q4 of this year (which is unlikely), the vol premiums in equities have priced the risk and uncertainty around this unrealistically. This means even if we were entering into a bear market, it is highly likely that we unwind this volatility premium first and begin to have more signals from the economic data about growth before we shift to a bearish trend.
Fundamentally, the price action we have seen in equities is one of sector and factor rotation as well as unwinding implied correlation positioning which is pushing implied vol premiums up to an extreme. The implication is that there isn’t a fundamental macro driver and we are unlikely to see persistence in the bearish price action of risk assets that has taken place over the past month.
We are unlikely to have a weekly close BELOW the 5,200 level in ES:
We are more likely to see a reversion in positioning where the equity-to-bond ratio moves back up either from bonds pricing less aggressive cuts or equities pricing less of a volatility premium.
Bitcoin maintained its correlation with risk assets YTD until June and July when it diverged due to idiosyncratic risk. This positioning mean reverted and actually outperformed equities for a few days. It is now likely to reestablish its correlation to risk assets.
Momentum is clearly skewed to the downside in Bitcoin given the multiple tops it has put in. Watching Bitcoin’s correlation with risk assets, bonds and gold will be critical here. If we can see a positive correlation between Bitcoin and broad risk assets along with a reversal at the lows, then taking the long can offer a reasonable risk reward trade.
Bottom line, risk assets remain skewed to the upside on a cyclical basis. However, as the beginning of this report noted, the growth scare and unwind in positioning is something to manage actively but is unlikely to have persistence.
Trades and Catalysts:
We are very likely to have a marginal pullback in ZN and UB, especially since the next FOMC meeting is pricing 50bps.
This view is likely to be realized on any data prints that show even a marginal degree of resilient growth. Additionally, CPI is likely to be a catalyst to realize the short-term downside in bonds.
It is incredibly important to note here that any bond shorts will be difficult since the cyclical trend of bonds remains to the upside. However, it is possible that we see a short-term bear steepener over the next month as the long end sells off more than the short end. If this takes place, monitoring the transmission into equities will be important. A bear steepener could cause some selling in equities.
Monitoring the relative performance between stocks and bonds will be important here because the post-FOMC pricing had bonds rallying and stocks falling. Watching the OHLC levels from Friday and also monitoring the correlation will be key for tracking flows this month. We are likely to revert back up in the ES/ZN ratio and putting on this pair trade has a reasonable risk reward here:
Additionally, the implied vol premium that exists is incredibly high right now. Even if equities don’t revert up quickly, volatility positioning is likely to be unwound because these types of premiums are unsustainable without a macro driver:
Bottom line: Over the next two months into the September FOMC meeting, we are likely to see some marginal downside in ZT, ZN, and UB or at the very least very minimal upside. Risk assets are likely to consolidate but there is still the possibility of additional positioning risk. Volatility premiums are likely to fall though as economic data reins in expectations regarding the growth scare and reprice the 50bps expectation for the next FOMC meeting.
Conclusion:
The macro regime has been laid out clearly in its impulses and tensions. There is a clear cyclical context for where we are and the market continues to extrapolate small deviations to tails. The market continues to price macro data with incredible speed but this speed doesn’t imply a reasonable expectation of the current and future macro regime. Understanding these tensions and when the market prices outcomes unrealistically will continue to be a source for generating alpha.
Final note: This report lays out my big-picture views. I will keep you updated about execution and specific levels in equities and bonds. Keep an eye on the Substack. Everything will be published here in real-time.
Thanks!
The information on this website/Substack is for information purposes only. It is believed to be reliable, but Capital Flows does not warrant its completeness or accuracy. The information on the website/Substack is not intended as an offer or solicitation for the purchase of stock or any financial instrument. The information and materials contained in these pages and the terms, conditions and descriptions that appear, are subject to change without notice. Unauthorized use of Capital Flows websites and systems including but not limited to data scraping, unauthorized entry into Capital Flows systems, misuse of passwords, or misuse of any information posted on a site is strictly prohibited. Your eligibility for particular services is subject to final determination by Capital Flows and/or its affiliates. Investment services are not bank deposits or insured by the FDIC or other entity and are subject to investment risks, including possible loss of principal amount invested. Your use of any information which is proprietary to Capital Flows or a third-party information provider shall only be used on individual devices without any right to redistribute, upload, export, copy, or otherwise transfer the information to any centralized interdepartmental or shared device, directory, database or other repository nor to otherwise make it available to any other entity/person/third party, without the prior written consent of Capital Flows.


