


All of the research on interest rates and equities has been provided. I continue to hold the long ES trade published May 30th noted here:
Trades: Long ES

I have laid out the tensions for the macro situation and my view on equities: Trades/Week Ahead: Rates, GDP and Inflation Print (macro context for this week) Asset Class Report: Equities (I broke down the R:R of equities) Interest Rate Report: Strategy and Trades
Here are the links to all the main pieces I have done recently explaining the tensions of the macro situation.
Equity Report: Link
Equities are going to Melt UP published in January 2024: Link
Interest Rate Strategy and Report: Link
Interest Rate Primer: Link
Synthesis of all the educational articles: Link
End of Week Podcast: Breakdown of rates and equities: Link
As we move into the second half of 2024, it is critical to understand the macro tensions that exist. We are NOT at a cyclical extreme or inflection point. We are in the period of time in between where people get very confused. This is exactly why I write comprehensive macro reports.
I will be writing further alpha reports breaking down specific trades in the coming days. The comprehensive macro reports contextualize the logic for these trades. If you are new and trying to get a grasp on macro, all of the educational primers are synthesized here:
Research Synthesis / Direction Of Capital Flows Substack

Hello everyone, There has never been a time in history when understanding the world from a global perspective and interpreting it accurately paid such a high premium. Since the very beginning of this Substack, I have talked about the nature of the time we live in and how to act intentionally in it.
Comprehensive Macro Report:
Summary of Contents:
Growth
Inflation
Liquidity
Macro Implications For Rates
Macro Implications For Equities
Growth:
As we entered the hiking cycle of 2022, the consensus in both economist forecasts and positioning (reference ES COT positioning) was expecting a recession. The chart below shows consensus forecasts for the probability of a recession occurring. During 2023, consensus was incredibly high which means the absence of a recession would necessitate an unwind in bearish positioning across assets.
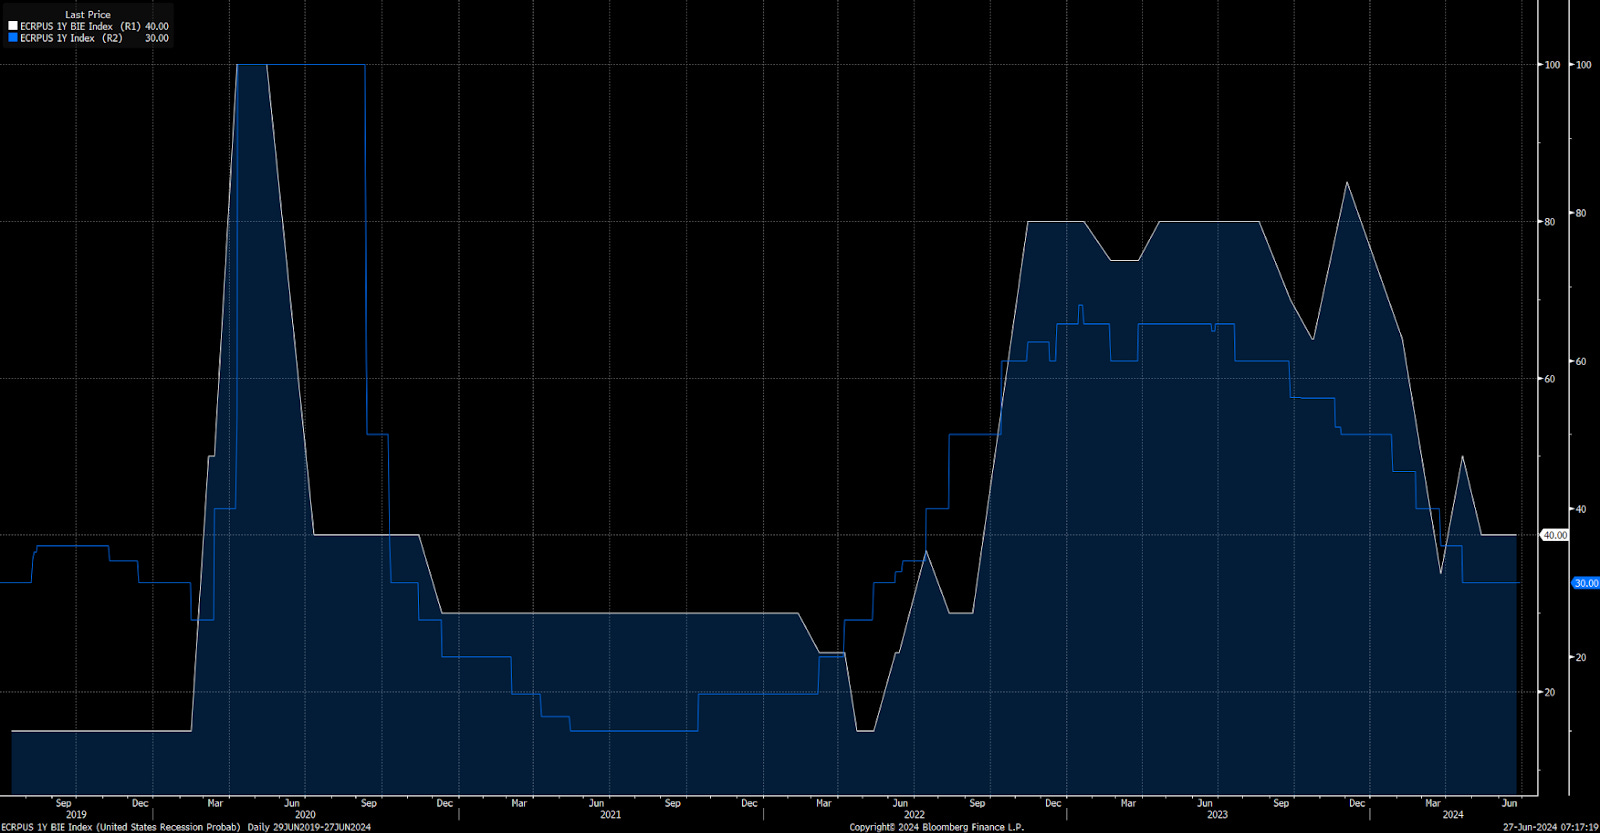
During 2023, real GDP in the Atlanta Fed nowcast reached almost 6%, an incredibly high number relative to the expectations of consensus.

As we entered 2024 the stage was set for the beginning of rate cuts. However, inflation prints coming in above expectations shifted cuts from the beginning of 2024 to the back half of the year. During this time, interest rates moved up to reprice the change. Due to the level interest have been held at and the large spread between inflation and Fed Funds, this rally in rates began to impact growth more.
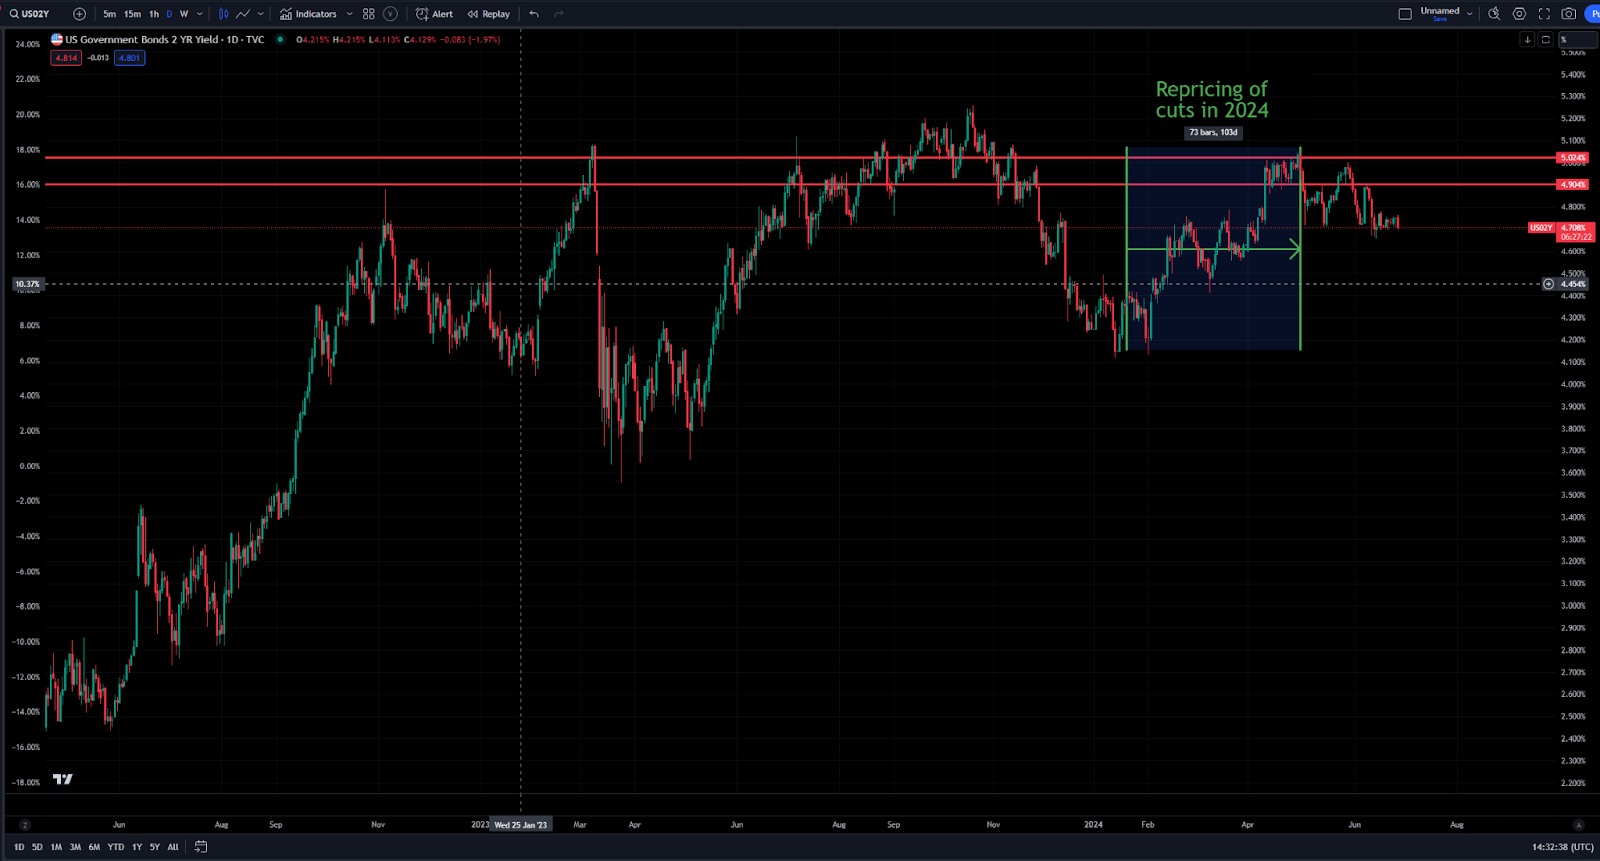
As interest rates rallied in the first half of 2024 (white line), the economic surprise index began to turn negative (green/red in chart).

While it would be easy to extrapolate the economic surprise index into a recession, this would result in lower-quality views similar to the economists who are surveyed for consensus. Instead, we will map the level, rate of change, and diffusion of growth data in all its facets and tensions. When we analyze growth data in this manner, then we can properly compare it to consensus and the embedded expectations in markets.
As we approach mapping these tensions, the most recent GDP print shows an overall acceleration but less strength than the last print.

Monthly data and GDPnowcasts continue to show strength across a multiplicity of sectors even if it’s not as strong as 2023. The key tension that market participants are missing here is a marginal softening in growth doesn’t imply a contraction. Furthermore, this softening coincided with the rise in rates during the first half of the year. If cuts by the Fed begin to be realized, we could see growth remain incredibly resilient from lower rates.

Monthly metrics of real personal consumption (the largest line item of GDP) remain squarely in positive territory:
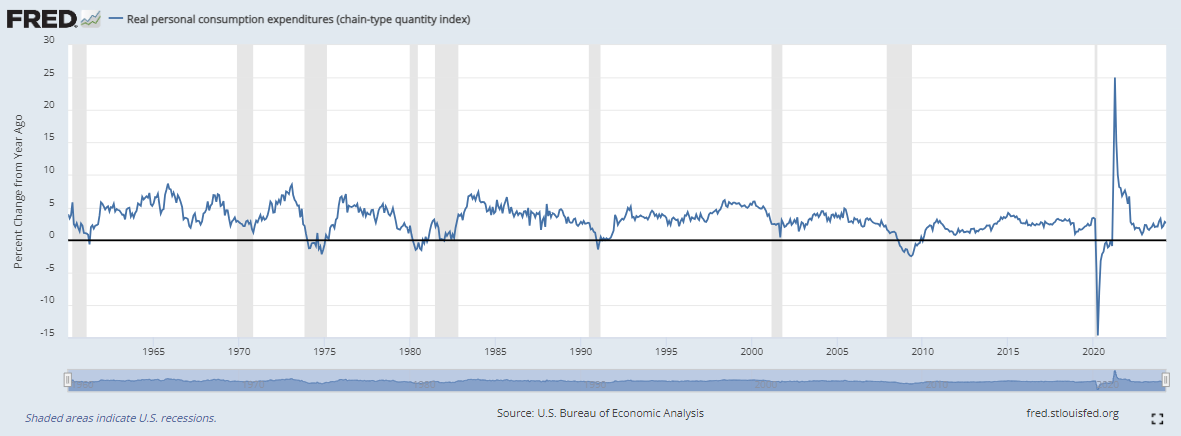
Both the goods and services line items of real PCE remain in expansionary territory:

The strength in consumption continues to function in a positive feedback loop with labor market data. The chart below shows the outright NFP data (blue) and the breadth index (white). Both are well above their historical median.

It is this LEVEL of labor market data that needs to be compared with the diffusion indices that are in contraction. For example, “soft data” metrics that in intentionally meant to have a higher sensitivity to changes in economic conditions are in contraction (colored in red).

The most popular measures remain line items such as the ISM employment datapoints.

Or Michigan Consumer sentiment:

While these datapoints are important to monitor, fundamentally, they have a lower quality compared to the economic datapoints noted above. This is inherent in their own process for collection. These types of data points are meant to show changes on the margin or diffusion as opposed to the absolute LEVEL.
We are seeing some marginal weakening in industrial production:

And less strength across employment sectors like manufacturing. However, this is part of the dispersion taking place under the surface of economic data.

For a negative growth impulse that drags QoQ real GDP into negative territory, we need to see a pronounced and pervasive contraction across ALL these metrics. Employment and consumption fundamentally function in a feedback loop with each other as opposed to one leading the other. As a result of this inherent connection, we need to see the beginning some degree of reflexivity between BOTH for a change in the macro regime.
There are several pieces of logic we need to address within this to have nuance in our implications:
First, most of the time, the US economy is expanding.
Second, being BELOW cycle highs doesn’t equal a recession or outright contraction. For example, we are adding significantly less jobs on a MoM basis than we were in 2021, 2022 and 2023. The fact that we are below the theoretical “cycle highs” doesn’t mean we are entering the beginning stages of a economic contraction. If this logic for predicting a recession was applied to any sample set of data in the US, the results would be worse than a coinflip.
Third, when the economic data is between the extremes of a deep contraction or cycle high, high-quality views come from mapping the dispersion and tensions in economic data.
Right now, MoM NFP data continues showing jobs being added every month to the US economy. While the labor market imbalances from COVID-19 have normalized, people are still being hired because consumption is increasing.

Growth in the US economy has remained elevated above contradictory levels, resilient to the rate hiking cycle and structurally supported due to the onshoring of US production and strength of household balance sheets. It is within this context that we can analyze inflation properly.
Inflation:
Inflation in the United States continues to decelerate and remain skewed to the downside in both headline and core components. The headline component has seen marginal volatility due to oil prices but we are unlikely to see another rise in crude comparable to 2022. Without another supply shock, we are unlikely to move ABOVE $95 and without a demand shock (recession) we are unlikely to move BELOW $65.

As a result, positioning and short-term catalysts are causing the price to oscillate in a range. On a cyclical basis, the trend is neutral. While the headline component of CPI and PCE can have marginal volatility and deviation from core without impacting the Fed’s stance on overall inflation, it is core inflation that remains the primary risk and focus of the Fed.
Core CPI continues to decelerate with goods in outright disinflation.

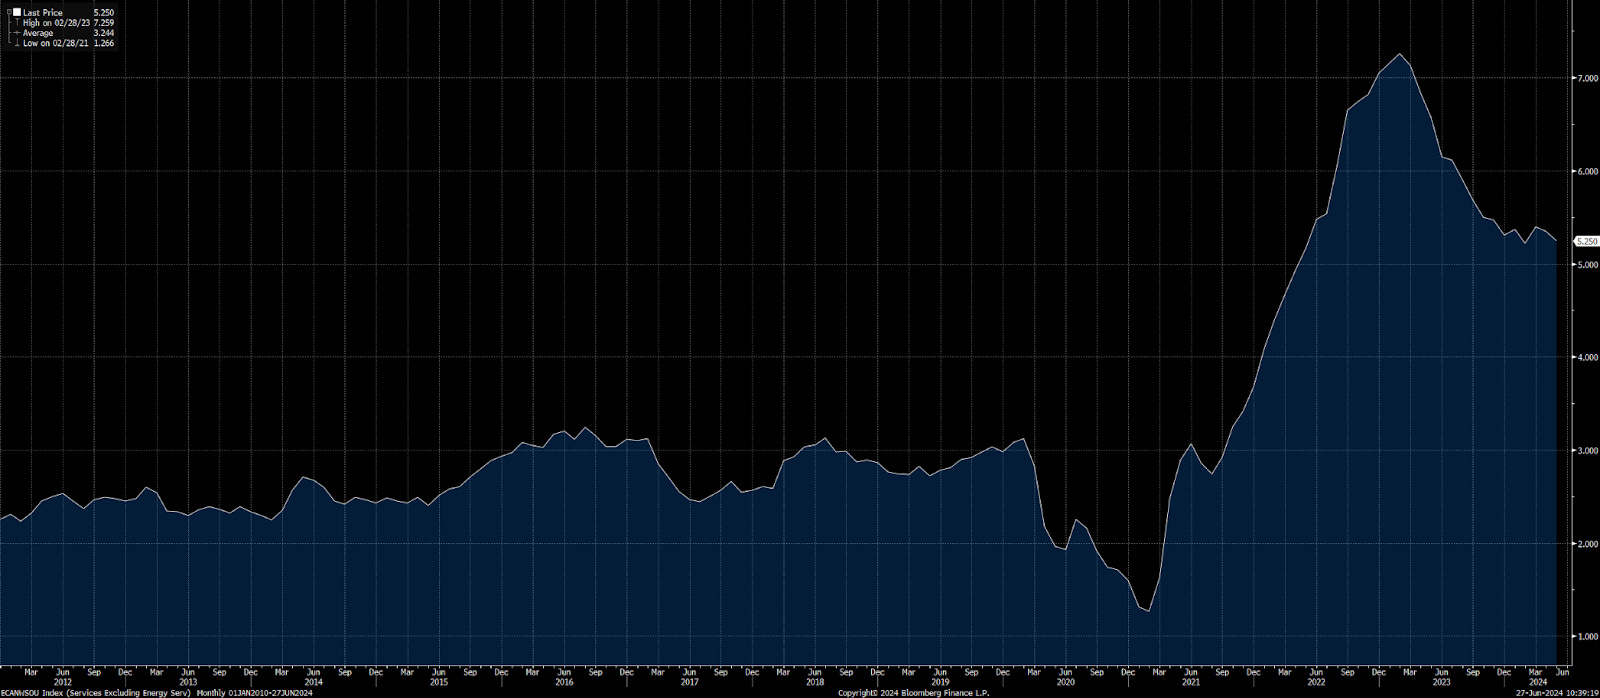
Core services are decelerating as well with the shelter component showing continual progress:

Overall, when the core services break BELOW 5%, this will likely cause a significant bid in bonds.
A fall in inflation would also cause bond volatility to decrease (Move Index in blue) which will help decrease the volatility in bonds.

As inflation falls, monitoring its relationship with real growth will be critical:

While the future macro regime has a degree of path dependency based on the Fed, inflation can fall considerably as supply and demand normalize without causing real GDP to move negative. If this occurs, we will see Goldilocks price action in markets. Inversely, if the fall in inflation coincides with weakening growth then we could see a disinflationary impulse overlapping with weaker growth. The specific outcome is dependent on two things:
The speed at which the Fed cutes rates and how much these cuts are transmitted into supporting growth.
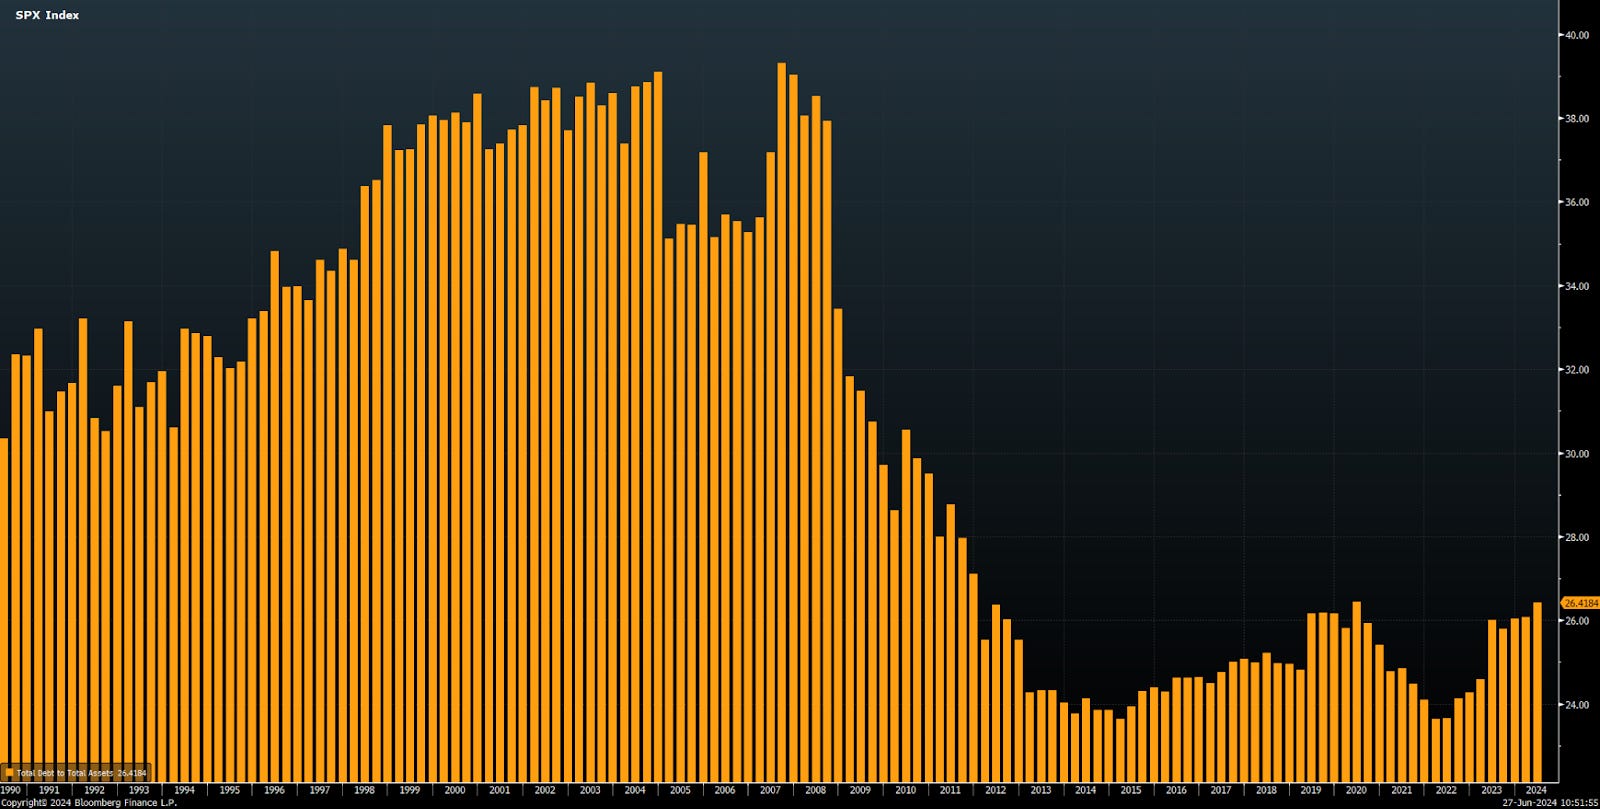
The current strength of growth as it connects to the balance sheet strength of agents in the economy. At this time, household balance sheets remain strong and the sovereign balance sheet isn't under any imminent constraints in refinancing its liabilities. The corporate balance sheet in some areas is in the process of deleveraging but in the S&P500, the level of debt is minimal.
Total debt to total assets remains well below levels seen during 2000 and 2008.
The same is true for debt to equity:

And net debt to EBITDA:

While the balance sheet concerns are low in this regime, liquidity is still incredibly important due to the heightened level of valuations we are seeing. The greater the amount of returns that are attributed to valuation expansion, the greater the sensitivity assets have to changes in liquidity conditions.
Liquidity:
Liquidity is always going to be a function of either the price of money (via interest rates) or the quantity of money via sovereign assets being transmitted through the liquidity transformation mechanism of the plumbing.
Below is a chart of real rates and the SPX PE ratio inverted. When real rates were at their lowest in history during 2020, valuations in SPX were very high. As real rates consolidated in 2021, the valuations of SPX contracted to price in the changing liquidity conditions. As we moved into 2022, valuation multiples contracted as real rates rose due to the Fed’s hiking. During 2023, there was a combination of factors that led to higher valuation multiples but one of them was simply the fact that the Fed was done hiking.

However, the chart above shows that during 2024, there has been a significant expansion in valuation multiples as real rates functionally remain at highs. This was due to the quantity of money in the system expanding as bank reserves accelerated from their lows:

Additionally, the amount of bill issuance (white line) has helped the liquidity in the system as well:

Overall, liquidity in the financial system remains ample. We aren’t seeing a lack of dollar liquidity and the amount of capital on the sidelines ready to aggressively buy dislocations remains ample. The dynamics with growth, inflation, and liquidity contextualize our analysis of individual assets and how they connect to the macro regime.
Macro Implications For Rates:
Interest rates are both directly impacted by the growth and inflation situation noted above, as well as influencing the outcome of growth and inflation. Four questions need to be answered for interest rates:
How fast will inflation (specifically core CPI) decelerate into the end of 2024 and the beginning of 2025?
How much will growth fluctuate as inflation falls and will a fall in rates help support growth without causing inflation to reaccelerate?
How will the Fed interpret these variables in connection with how the forward curve is pricing their actions?
How will these tensions on the short end reverberate to the long end while the yield curve remains inverted?
To start, the marginal softening in growth puts less upward pressure on inflation from the demand side of the economy. This helps with how the Fed targets the spread between inflation and Fed Funds.
If core inflation continues decelerating at the same speed as the 3-month trend then we will move under 3% by November or December of 2024.

We don’t know how much this will impact growth data but the more growth data that comes in below expectations, the faster inflation is likely to decelerate. The implication behind this is the speed of cuts by the Fed. However, the critical thing to keep in tension here is that growth data coming in below expectations doesn’t equal a QoQ contraction in GDP. Notice how the economic surprise index (blue) and Atlanta Fed Nowcast (white) have diverged.

While are unlikely to have aggressive cuts by the Fed this year driven by credit risk, we are likely to see the beginning of cuts as the Fed targets a smaller spread between inflation and Fed Funds.

This brings us to how the Fed will interpret these tensions. Fundamentally, the Fed is taking a stance of caution where they would rather wait for confirmation than act preemptively. We have clearly seen the Fed indicate further hikes are off the table and allude to the fact that they are figuring out HOW MANY cuts for this year.

The forward curve is pricing just over 2 cuts by the end of the year:
The December 2024 SOFR contract is currently sitting at 4.855%:

The December 2025 SOFR contract is sitting just at 4% pricing a total of 150bps of cuts by the end of 2025:

If inflation reaches the 2% target in 2025 and the Fed targets a 100bps spread between core CPI and Fed Funds, this is still 100bps of cuts that need to be priced in to the 2025 SOFR contracts. At the very least, this creates a significant skew to the downside in rates on the short end. If the 2 year was at 5% at the previous FOMC where the market was expecting a potential “hawkish pivot” this functions as clear resistance on a cyclical basis. If we reach 2% inflation with 100bps spread between Fed Funds and inflation, we could see the 2 year significantly lower from here. To be clear though, the 2 year is pricing the forward path of Fed Funds so it will not move exactly in lockstep with the realized Fed Funds.

Bottom line: interest rates are skewed to the downside and have significant asymmetry to move DOWN.
Where does this leave us with rates on the long end and the yield curve? The 2s10s curve is currently inverted a little less than 50bps:

If 2s can price in 50bps more of cuts into the end of 2024 as 2 cuts are realized by the Fed, then this can begin to push the curve to uninvert. We are unlikely to see a bear steepening at this point since the Treasury has shown they won’t conduct additional duration issuance above the markets expectations.

In sum, there is still some risk in getting long duration here due to the inversion of the yield curve but we are likely to see the long end move in lockstep with the short end during the back half of 2024. Additionally, once the curve uninverts, this will allow more capital to move out the duration risk curve. If these tensions with rates are clearly understood, the dynamics surrounding equities will also be abundantly clear.
Macro Implications For Equities:
Equity returns are driven by their cash flow (reflected by earnings) function or valuation function. The cash flow function is driven by growth and inflation. The valuation function is driven by liquidity.
The earnings yield (white) on SPX continues to fall as the S&P500 rallies. This is moving in lockstep with credit spreads (blue). The key tension to note is the divergence that has taken place between the SPX earnings yield (white) and the 10 year interest rate (orange).

While this spread is wide, it reflects the macro tensions that exist right now. Growth in the economy remains strong and investors know credit risk remains low based on the current macro environment. This is reflected in the strength of earnings expectations (blue) and low credit risk.

Bottom line for equities: we are at the beginning of a cutting cycle where there are not clear signs of credit risk. Quality growth tech is the greatest beneficiary to lower interest rates and they are the largest weighting in the S&P500 index. Equities remain skewed to the upside and any pullback is likely to function as a buying opportunity.
Conclusion:
The current macro regime continues to be one of tensions where path dependency of the Fed must be taken into account. We are not at a cyclical extreme or approaching a macro inflection point which means the precision in identifying dispersion of growth and inflation is important. Overall, growth remains positive as risk assets rally and inflation risk is decreasing which will provide support to bonds.
And we have to end with a Pepe :)

It’s all spx
Does the debt-to-asset/equity charts include financials? Would be interested to see one without financials.