

Macro Regime Tracker: 3-6-2025 (FREE) - ES Strategy Update
Macro regime and risk assets qualified clearly

Macro Regime Tracker (Daily Systematic Strategies & Models)
The Macro Regime Tracker offers a daily lens on how shifts in growth, inflation, and liquidity affect short-term risk and reward. Leveraging machine learning and cross-asset data, it identifies macro changes and their impact on market positioning.
The launch video for the Macro Regime Tracker is here: Link
Macro Regime Tracker Index:
Macro Regime Context
Macro Tear Sheets: Equities, Fixed Income, FX, Crypto, and Commodities
Macro Regime Dashboard: Excel spreadsheet for economic data and interest rates
Growth and Inflation Regime Tracker
Fixed Income and Credit Model
Equity Sector Model
Machine Learning Strategies and Models
Macro Regime Context:
We are at such a critical place in macro right now because of the extent of mispricing in the markets. Due to the nature of the environment we are in, I am making today’s full regime tracker FREE because it contextualizes the next steps we are likely to see.
First, I noted for subscribers that the pricing of the bond market was unrealistic since the conditions for an imminent recession do not exist right now. As a result, the Z5Z6 steepener had positive optionality to the upside and was a key signal to watch (link). Since this time, the curve has steepened from the lows. These curve expressions have greater optimality in these types of environments.

Second, I noted that there is limited upside in the Z5 SOFR contract because it is already pricing 75bps of cuts for 2025. While tomorrow's NFP print will be important, we are likely in the process of making a short-term top here. This is directly connected to the situation in equities.

We are at a critical implied volatility premium in SPX and in the process of making a bottom. However, incrementally managing this is THE KEY for the next 10 days. The ES strategy is now skewed to the upside and is published every day. You can find the most recent trade signals at the bottom of this report in the Machine Learning Strategies and Models section:

The headlines taking place right now are taking peoples attention away from the macro constraints that exist. The tariff dynamics are clearly accepted by the market, given the wider ranges and implied volatility premiums. Unless an actual growth shock takes place, the implied vol premium in equities will mechanically unwind and push equities higher (at the very least on a short-term basis).
*TRUMP: GLOBALISTS ARE BEHIND STOCK SELL-OFF
*TRUMP SIGNS ORDER MODIFYING 25% TARIFFS ON CANADA AND MEXICO
*BESSENT: US WILL LOOK AT EU'S 'MASSIVE' FINES ON US TECH FIRMS
*BESSENT: I'M NOT WORRIED ABOUT INFLATION, ACROSS CONTINUUM
Other Key Ideas:
Today's ECB rate cut coincides notably with rising inflation expectations and a strategic pivot towards increased fiscal spending from the bloc's central bank. This evolving landscape may soon open fresh trading opportunities, particularly in short-end rates.
In the US, internal models indicate that, although growth continues to slow, an outright collapse isn't imminent. The curve (2s10s) steepening persists as the sell off continued in longer-duration bonds (>10yr)
Fed speak had limited market impact today. Fed Governor Waller highlighted that markets aren't yet signaling substantial long-term inflation concerns and underscored the need for more data before confirming any sustained economic softness, maintaining that current policy remains in restrictive territory. Investors should remain vigilant as these themes unfold.
*WALLER: MARKETS NOT PRICING IN ANY SERIOUS LONG-TERM INFLATION
*WALLER: HAVE TO WAIT TO SEE IF SOFT DATA WEAKNESS CONTINUES
*FED'S WALLER: I BELIEVE WE'RE IN RESTRICTIVE TERRITORY
Macro Tear Sheets: Equities, Fixed Income, FX, Crypto, and Commodities
Macro Regime Dashboard: Excel spreadsheet for economic data and interest rates
Growth and Inflation Regime Tracker:
The Macro Regime Model first provides a real-time view of growth and inflation dynamics, then directly connects these insights to upcoming catalysts and the statistical measures that gauge their impact on asset prices.
(I am taking the paywall off for today, but I will be launching additional models and alpha generation tools over the weekend and next week. This would be a great time to do a 7-day free trial so you can review everything with zero downside: LINK)
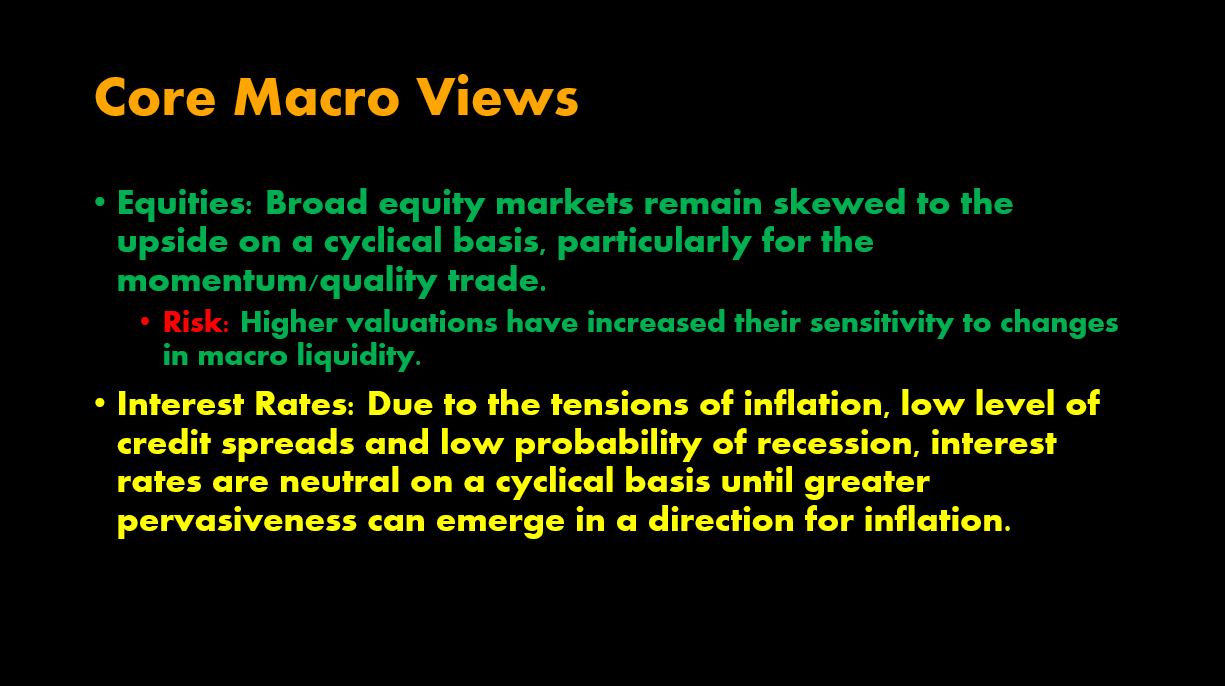
(Core macro views are systematically laid out in the monthly macro reports)


The macro regime model has transitioned from “rising inflation, rising growth” to “rising inflation, slowing growth.” We anticipate inflation will moderate toward the midpoint. The apparent dip in growth is more a result of overextrapolating current account trends than any significant deterioration in the labor market.

Over the short term, recent price action is testing the elevated inflation expectations implied by inflation swaps. Current pricing dynamics are increasingly volatile, influenced heavily by conflicting signals from resilient economic growth data, escalating tariff threats, and limited Fed speak. These factors are collectively intensifying the uncertainty in inflation swap levels.
The macro regime model reflects this complexity. This volatility highlights a challenging environment where the market continues to grapple with mixed signals from economic resilience, tariff-induced inflationary pressures, and minimal guidance from Federal Reserve policymakers.
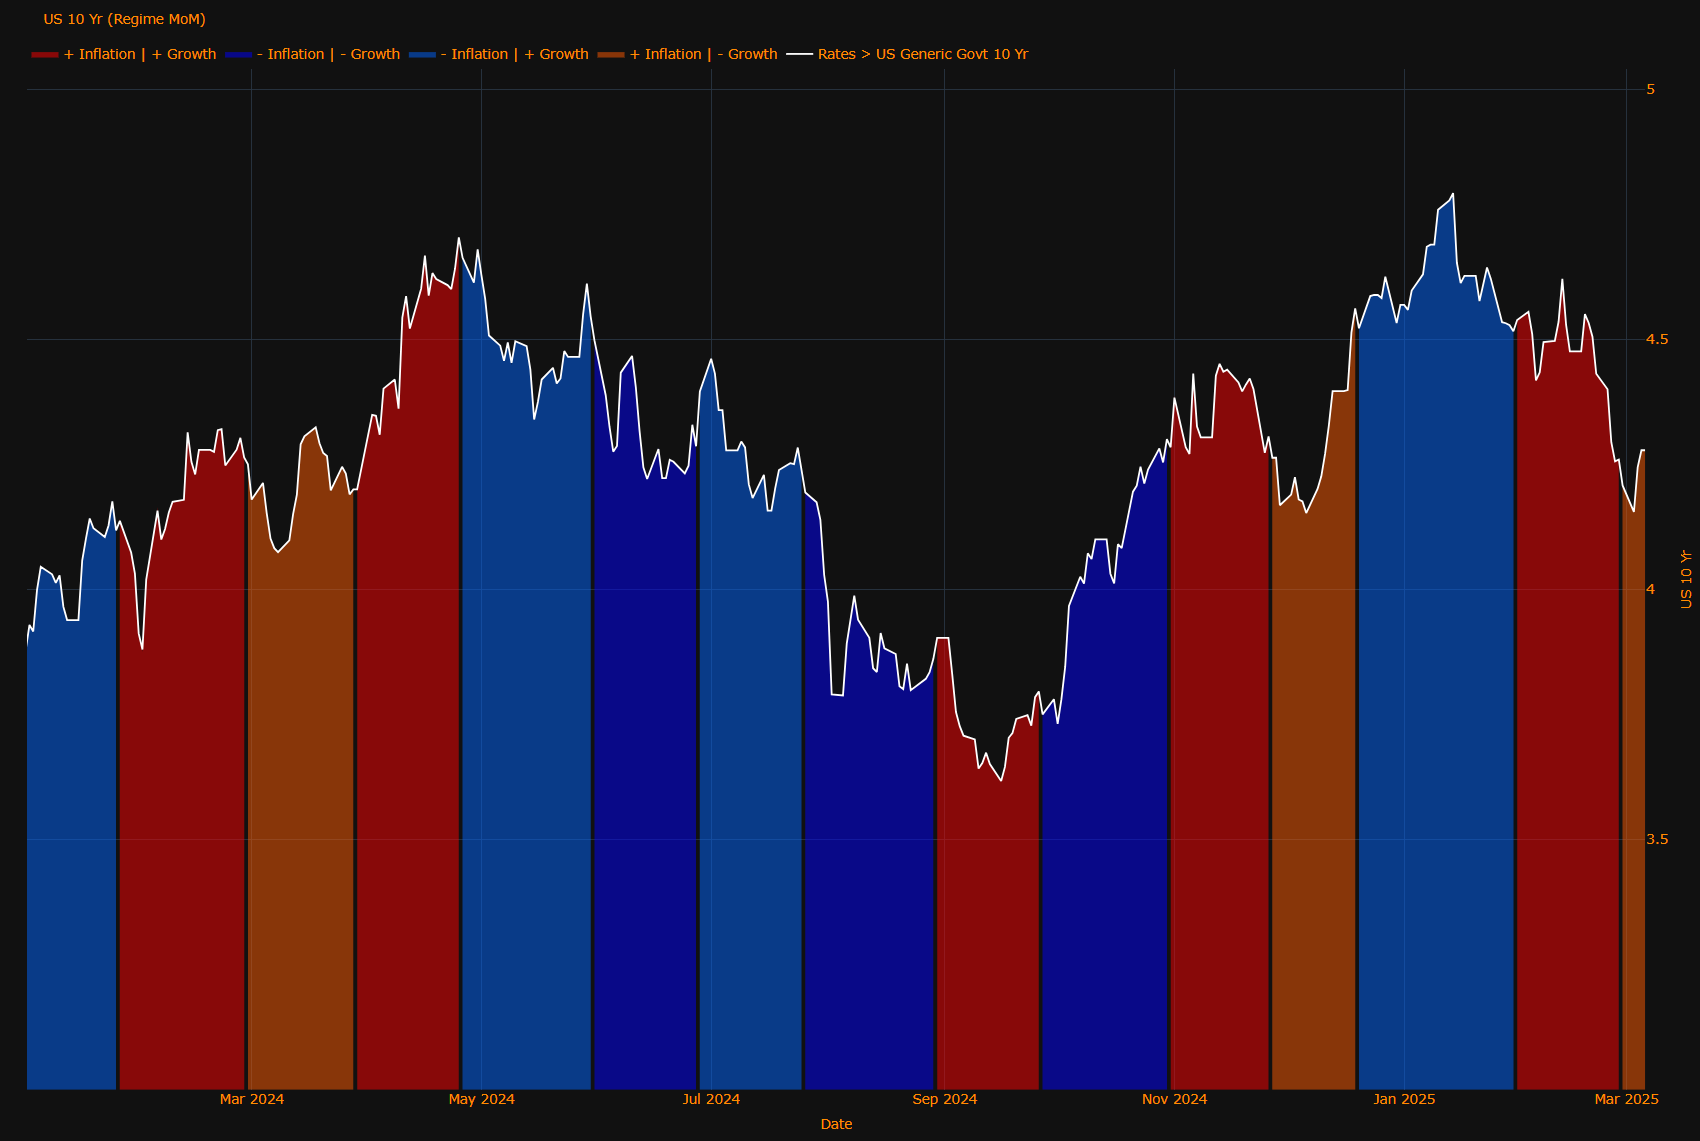
The 10-year appears to be forming a bottom as the forward curve prices in rate cuts under the current regime, and growth concerns continue to ease.
All major GDP nowcasts have undergone significant revisions. As additional data is incorporated into the models, we expect the Atlanta Fed's forecast to gradually align more closely with our projection (green line). The current negative reading from the Atlanta Fed Nowcast is not overly alarming, considering intra-quarter data already suggests an evident slowdown in economic activity. Our outlook remains consistent, forecasting a continued downward trajectory for GDP through the second quarter of 2025.
Economic surprise indices continue rolling over marginally as we move into the NFP print this coming week. Interestingly, we have seen a bounce in the CITI index. This is a result of the data-heavy week:
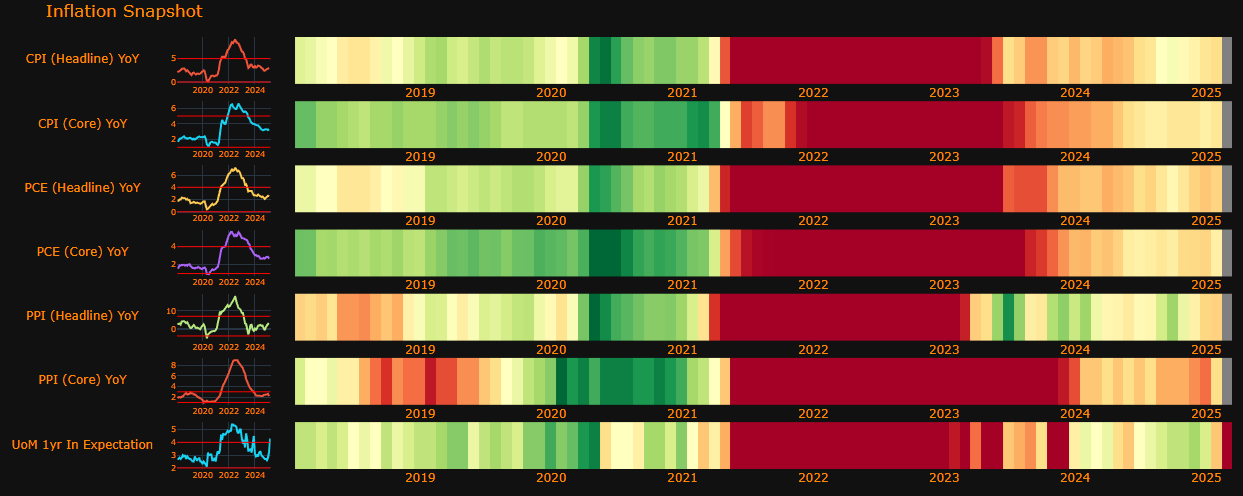
This is taking place as inflation has much less downward momentum compared to 2023:
The market is focused on labor this week, so below is a barometer for key labor measures. We are not seeing an imminent unwind taking place.
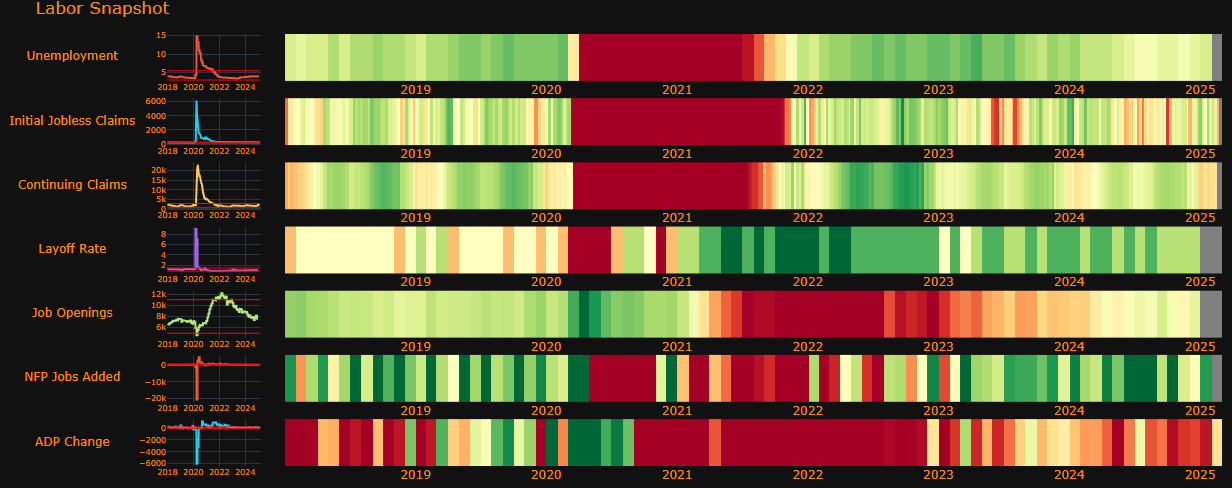
The economic data points above contextualize HOW we are likely to see data prints move markets this week.

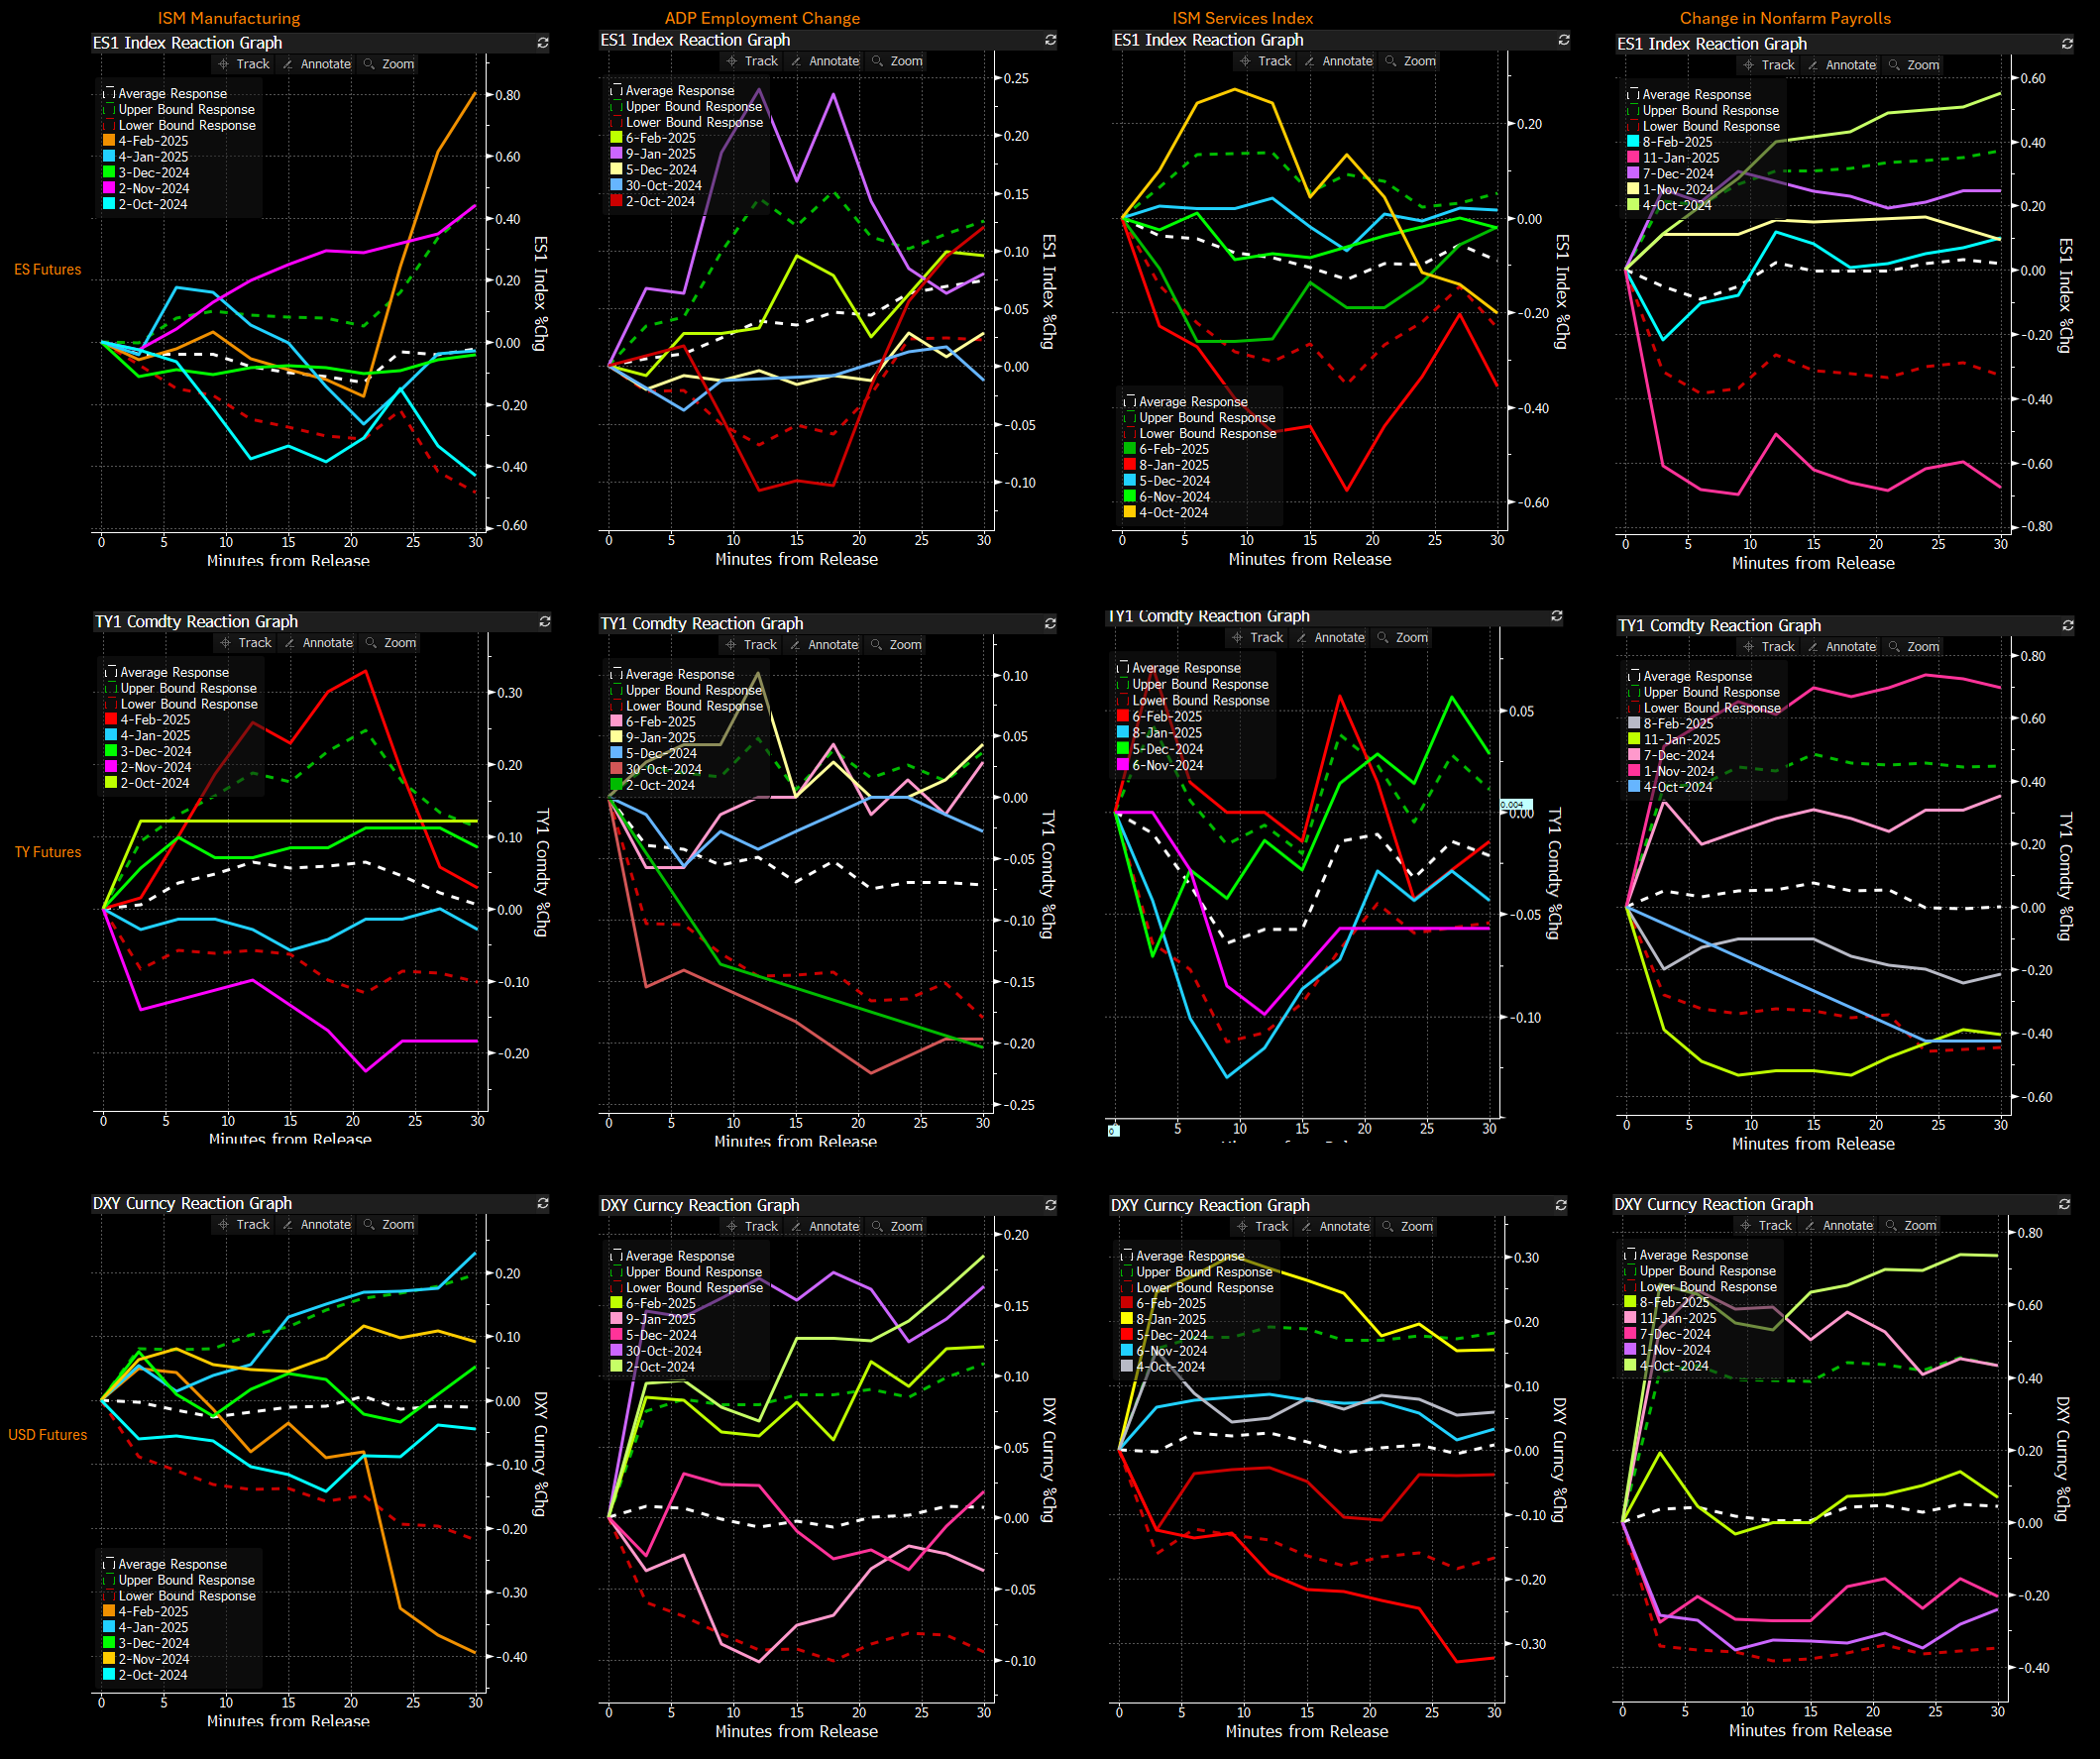
Ranges for price action through catalyst continue to be tight with the exception of the NFP on Friday. Any surprise to the extremes of the expected prints that pertain to growth or economic environment will elicit a larger move. The market will be focused on NFP Payrolls. (The matrix below is the implied ranges for data prints this week as well as previous price action responses):
Fixed Income and Credit Model:
The Fixed Income and Credit Model first provides a real-time view of yield curve regimes and directly connects them to changes in the credit market.
Bull flattening has generally persisted over the past month, supported by ongoing inflation concerns and uncertainties surrounding economic growth related to President Trump's policies. Year-to-date, the yield curve has flattened modestly by approximately -1bp, while it has steepened by roughly +9.6bps over the past four weeks. Recent steepening has notably intensified, primarily due to a pronounced rise in 10-year yields, which increased by +17bps over just three days. This move aligns with a global trend of rising longer-end yields across various markets, suggesting broader market dynamics at play beyond domestic factors alone.

The 2s10s yield curve experienced further bull steepening today, evident in both the 1-day and 20-day lookbacks. Political developments, economic policies, and growth concerns have become the primary focus, with inflation pressures beginning to recede in importance. Beneath the headline moves, significant uncertainty around debt dynamics continues to drive day-to-day volatility. These intraday shifts in the curve are particularly important to watch alongside equities, given the recent short-term flip to a negative stock-bond correlation.

The 2s10s yield curve shifted to a bull steepening environment today, evident across both 1-day and 20-day periods. Political developments, economic policies, and growth concerns have come to the forefront, overshadowing inflation considerations. This heightened uncertainty is reflected in credit markets, as illustrated by recent movements in the US CDS Index. Despite broader volatility, current CDS levels suggest caution rather than systemic distress, highlighting that uncertainty itself is contributing to further uncertainty. (Chart is the curve regimes in 2s10s in the colors with the outright value as the CDX index).

Credit spreads remain comparatively low in a cyclical context but are gradually and consistently widening. Tomorrow's Non-Farm Payroll (NFP) report will be closely monitored, particularly regarding the credit market's response to forward rate movements. A scenario where the yield curve shifts towards bear steepening alongside tightening credit spreads could notably bolster equity markets.

Credit spreads have shifted only marginally, indicating limited signs of heightened market stress.

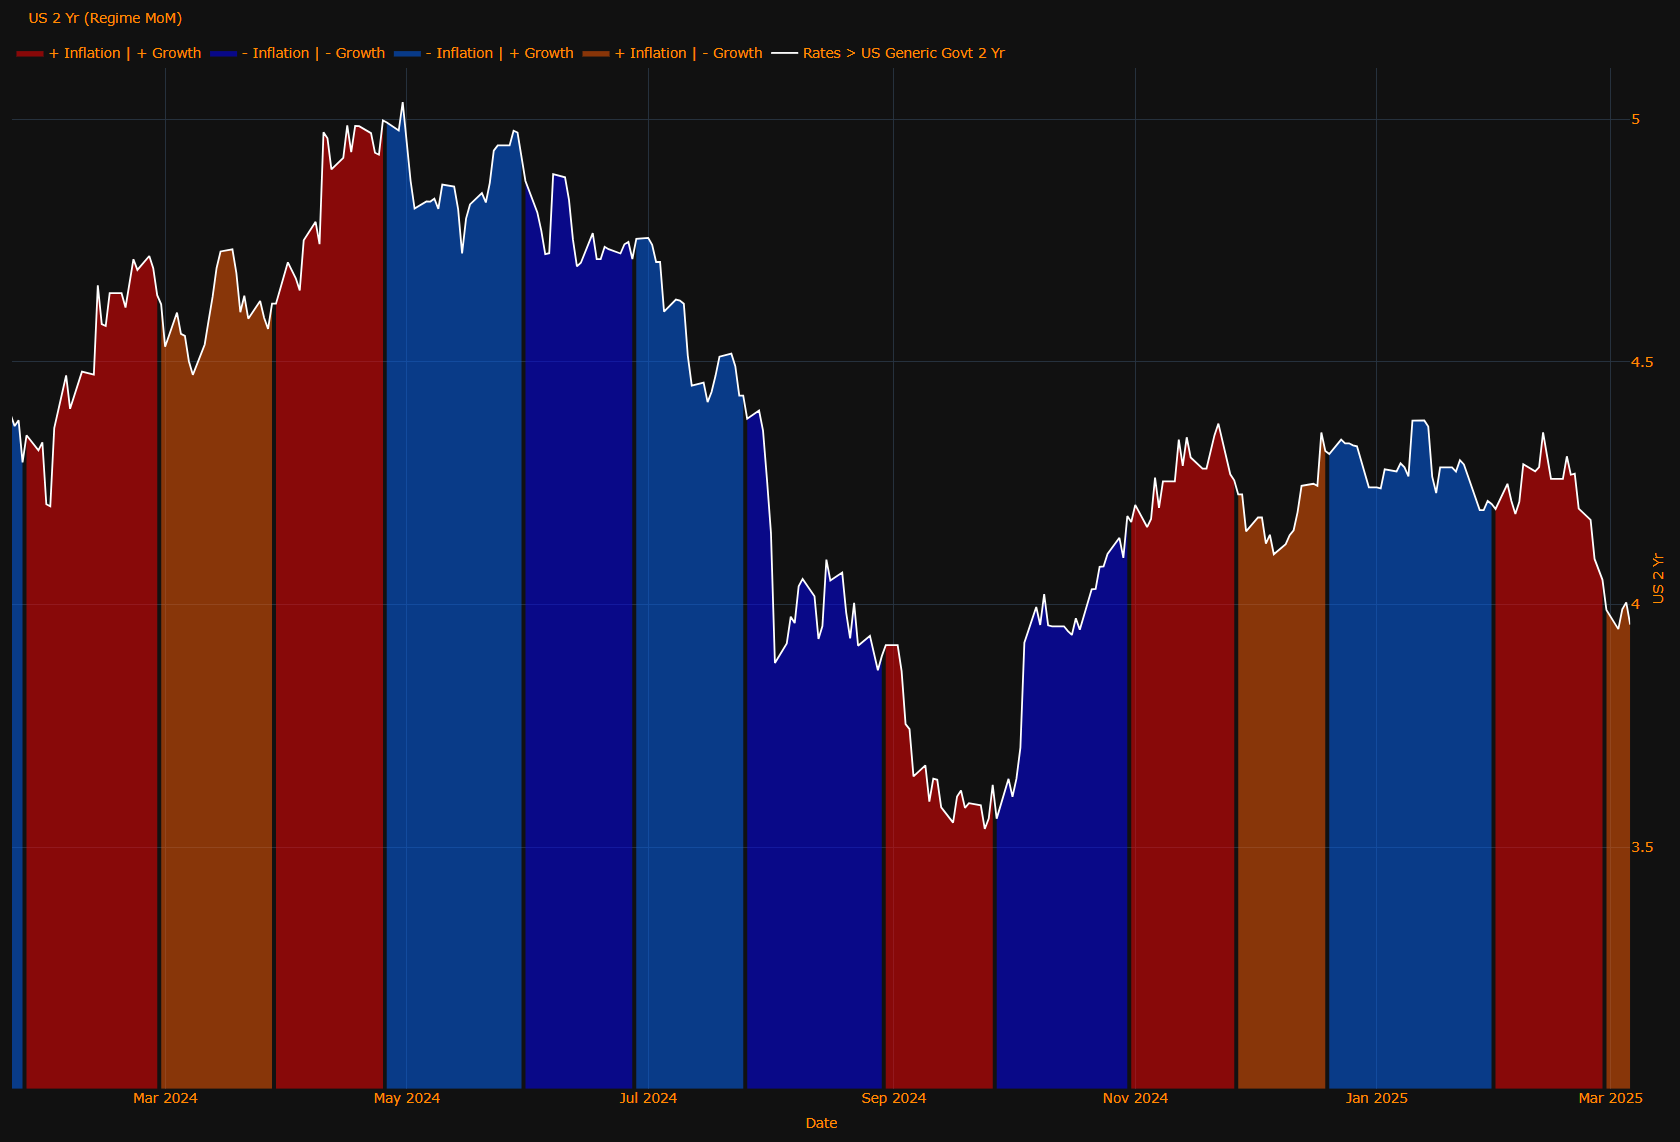
Looking at the short end of the US yield curve, the market is currently pricing in 75bps of rate cuts for 2025, with an additional 13bps expected in the first half of 2026. The majority of these cuts are anticipated in the second half of 2025, aligning with themes of declining inflation, a weakening labor market, and moderating economic growth. Tomorrow's Non-Farm Payroll report will be crucial in shaping this outlook.
Additionally, ongoing noise from tariffs and shifting political dynamics is complicating growth forecasts. Given current information, we see growth moderating rather than collapsing, and inflation pressures have not yet fully dissipated. As such, we believe the 75bps of anticipated rate cuts for the year presents an attractive risk-reward scenario.

Equity Sector Model:
The Equity Model aggregates attribution analysis, volatility premiums, drivers, and market positioning into a statistically robust machine learning framework to quantify skew. By merging these factors, it clarifies near-term equity risk reward.
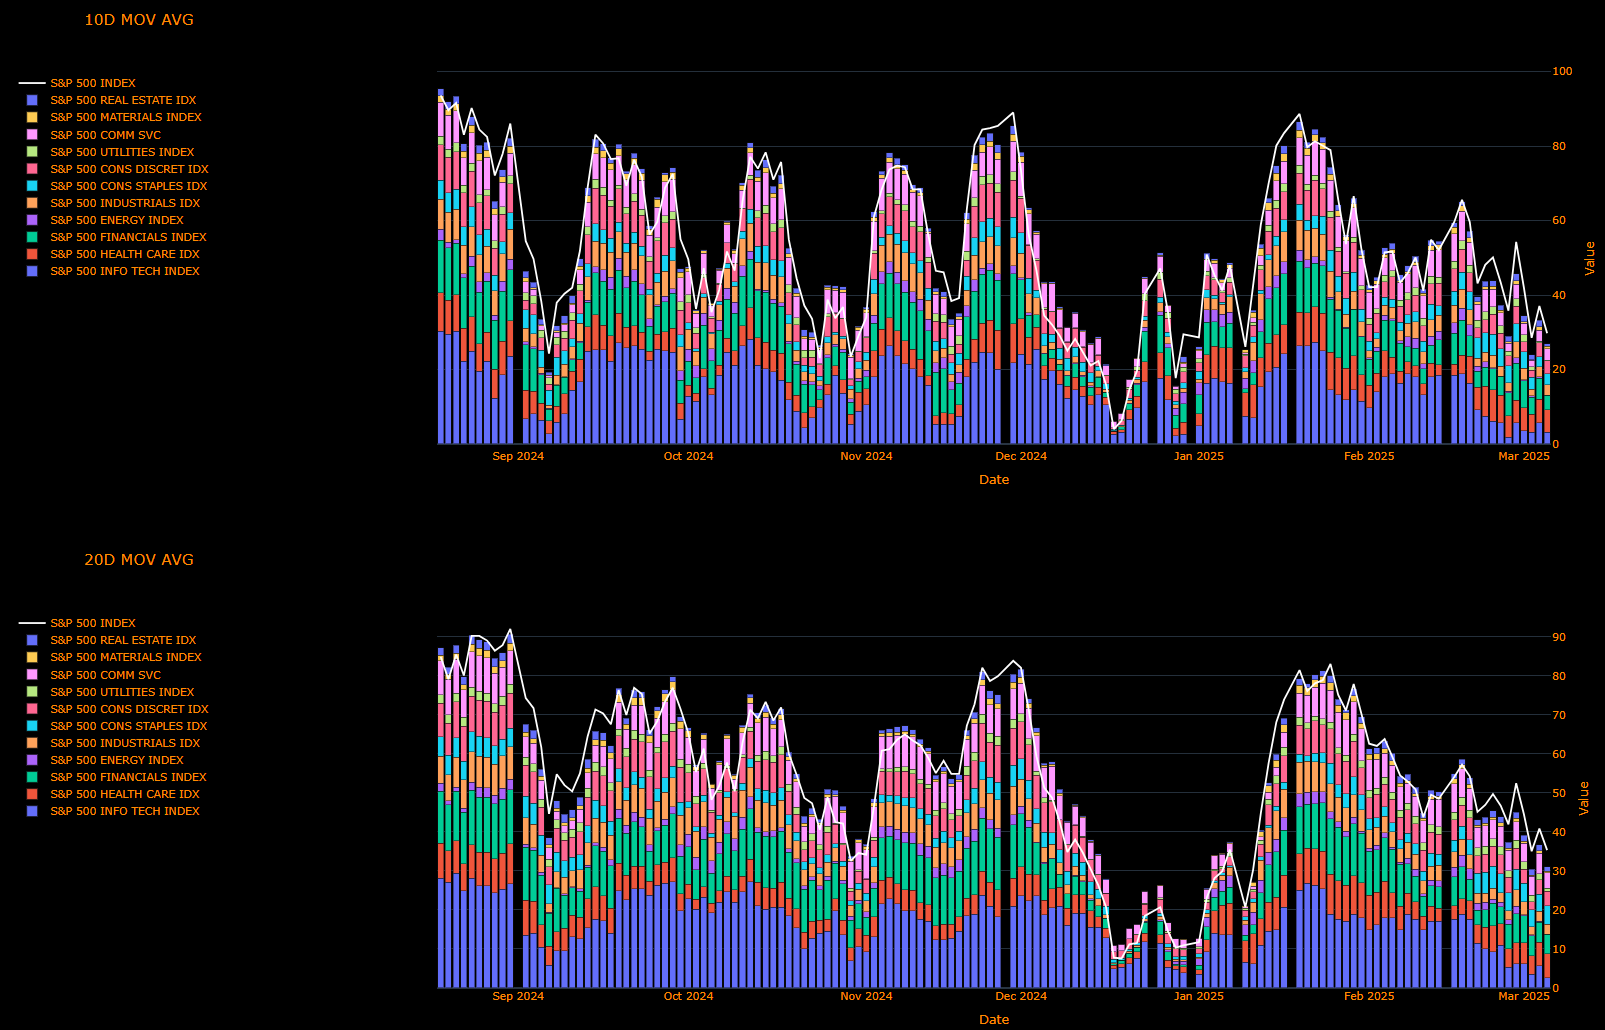
Based on the “Weighted Return Contribution to Index” data provided, the S&P 500 declined by 0.51% overall. Information Technology was the largest detractor (-0.19%), followed by Consumer Discretionary (-0.13%), Communication Services (-0.09%), Financials (-0.09%), Industrials (-0.09%), Real Estate (-0.05%), Utilities (-0.03%), and Health Care (-0.00%). Consumer Staples slightly contributed positively (+0.01%), while Energy (+0.03%) and Materials (+0.00%) were essentially flat or marginally positive.

The S&P 500 finished the day down 0.51%, with Real Estate (-2.10%), Consumer Discretionary (-1.26%), and Utilities (-1.23%) sectors leading the declines. Communication Services (-0.93%), Financials (-0.65%), and Information Technology (-0.62%) also weighed heavily on the index. Energy (+0.90%) and Consumer Staples (+0.23%) were the only sectors posting gains. Markets were pressured by ongoing concerns about global growth and persistent trade uncertainty, this didn’t help matters either

Breadth on the short measure appears to have found a base albeit at an extreme level for most sectors, we will be watching these closely for shorter term setups in sectors and single name equities.


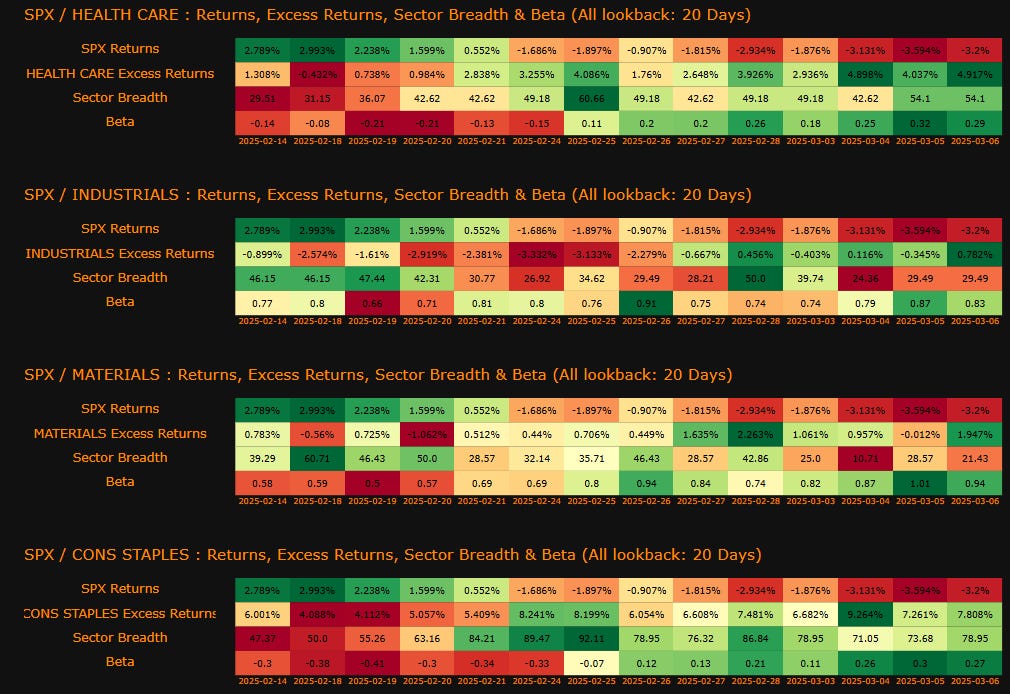
Reviewing the 20-day rolling heatmaps through 3/6/25 indicates ongoing pressure in equity markets, with negative returns and excess returns across most sectors.
Technology: Persistently underperforming, reflecting investor caution around high valuations, growth sustainability, and ongoing tariff uncertainties.
Consumer Discretionary: Facing notable weakness, indicating growing investor concerns about consumer spending and broader economic health.
Real Estate: Showing notable strength with positive excess returns, reflecting investor preference for stability and yield in the current risk-off environment.
Utilities: Recently weakened significantly, suggesting diminished appeal even among traditionally defensive sectors, reflecting broader cautious sentiment.
Communication Services & Financials: Experiencing significant negative returns, consistent with growing market worries about economic outlook and profitability pressures.
Energy & Consumer Staples: Relatively resilient, showing modest positive excess returns, indicating mild defensive positioning amid the broader sell-off.
Sector Breadth: Consistently weak across the board, highlighting that the current sell-off is broad-based rather than isolated to specific sectors or industries.
Beta readings: Elevated beta values in multiple sectors emphasize heightened market volatility and sensitivity to broader macro developments, including tariff headlines and growth trajectory concerns.
In summary, investor sentiment remains cautious, driven by ongoing uncertainties around growth, trade policy, and macroeconomic stability, with real estate providing a notable exception as investors seek stability.


The risk premias of Mag7 display how the specific company is being priced relative to the sector, index, and 10 year nominal rate.


The first week of March is quiet.

Implied volatility premiums continued extending last week's rise, edging deeper into short-term extremes and driving up hedging costs. They now appear to have settled somewhat, remaining elevated.

Machine Learning Strategies and Models
The Machine Learning Model fuses short-term quantitative rigor with macro drivers and positioning data, providing a real-time gauge of market risk and reward. By leveraging cross-asset flows, it pinpoints regime shifts and quantifies their near-term impact.
The most important thing you can do in macro is have quantitative tools that align highly technical factors with the power of discretionary decision-making. The ES strategy synthesizes the macro driver in connection with momentum and mean reversion dynamics as they are occurring across different timeframes. If you don’t align your view with the timeframe you are trading, then it will negatively impact your ability to execute trades and manage risk. This is exactly why I lay out the big picture views and provide my internal models for how these views are incrementally developing across different timeframes.
The current model below is for ES on a short-term basis (48 hours). As of today, I am adding a higher timeframe skew for ES (5 days). These are critical to monitor every day because they synthesize all the macro factors and align them with short-term statistical significance that is dynamically unfolding. These strategies will be expanded across Gold, Bitcoin, bonds, and FX for paid subscribers in the coming weeks.
Notice that bearish trades in ES have been running as we have pushed through the “technical level” of 5,800. As I have said many times, technical levels are meant to be tested, not a place for stops. We are now beginning to shift but still need to manage risk and these wider ranges dynamically.
Equity Strategies have flipped bullish on both time horizons. If positioning or macro factors change, the strategies will adapt to these changes.
ES: BULLISH skew for the next 48 hours
ES: BULLISH skew for next 5 days

ES 2 Day Data

Backtesting (out-of-sample testing) Results:

ES 5 Day Data

Backtesting (out-of-sample testing) Results:

Final Note:
If we see any type of aggressive repricing in bonds here, crude oil is likely to rally up to the $71 level or higher, given the extent of the move down that has occurred.

Bitcoin is likely to remain ABOVE 80k. However, for a durable rally and retracement back up to 100k, we need to see it outperform SPX on the upside. If you are trading Bitcoin to the upside here, watching the ES strategy will be critical.

We don’t know how the jobs number is going to come out tomorrow, but there is clearly excessive focus on it. When we zoom out and think about WHERE we are, it is important to remember that credit spreads remain incredibly low. Even if the next stage of the cycle is a recession, it is going to take a considerably amount of time to get growth and credit spreads to a level where a true risk-off move takes place. This doesn’t mean positioning can’t swing prices around on growth concerns, but this is very different than a 2008-like recessionary environment.

I am in the process of writing the next macroeconomic report, which will pull together all of these dynamics and directly connect them to how asset prices are likely to move over the next 90 days. Keep an eye out for the macro report and new strategies being launched over the next 7 days.
Thanks
As always, a Pepe for the culture.

The information on this website/Substack is for information purposes only. It is believed to be reliable, but Capital Flows does not warrant its completeness or accuracy. The information on the website/Substack is not intended as an offer or solicitation for the purchase of stock or any financial instrument. The information and materials contained in these pages and the terms, conditions and descriptions that appear, are subject to change without notice. Unauthorized use of Capital Flows websites and systems including but not limited to data scraping, unauthorized entry into Capital Flows systems, misuse of passwords, or misuse of any information posted on a site is strictly prohibited. Your eligibility for particular services is subject to final determination by Capital Flows and/or its affiliates. Investment services are not bank deposits or insured by the FDIC or other entity and are subject to investment risks, including possible loss of principal amount invested. Your use of any information which is proprietary to Capital Flows or a third-party information provider shall only be used on individual devices without any right to redistribute, upload, export, copy, or otherwise transfer the information to any centralized interdepartmental or shared device, directory, database or other repository nor to otherwise make it available to any other entity/person/third party, without the prior written consent of Capital Flows.
This is art not just research
For your 2-day ES strategy, Do you open a 1-lot trade every day and hold for 2 days regardless of next day's signal? So there is sometimes overlap of bull/bear skew?