

Macro Regime Tracker: Bitcoin Melt UP
Macro regime and risk assets qualified clearly

The Macro Regime Tracker offers a daily lens on how shifts in growth, inflation, and liquidity affect short-term risk and reward. Leveraging machine learning, AI, and cross-asset data, it identifies macro changes and their impact on market positioning.
Macro Regime Tracker Index:
Macro Regime Context
Macro Tear Sheets: Equities, Fixed Income, FX, Crypto, and Commodities
Macro Regime Dashboard: Excel spreadsheet for economic data and interest rates
Growth, Inflation, Fixed Income, Credit, and Equities Regime Tracker
AI and Machine Learning Strategies - Macro Regime and Positioning Premiums Strategies: S&P 500, 2-Year Interest Rates, Gold, and Bitcoin
Macro Regime Context:
I recorded a video today explaining HOW to think about the price levels of Bitcoin as they related to macro flows. (See the report I wrote on the evolving market structure of Bitcoin HERE)
This directly ties in with the macro end game breakdown I provided here:
We continue to move in lockstep with the report I published yesterday:
Alpha Report: Interest Rates and the labor market

I have laid out the macro context here: (please review this for the comments below!)
The JOLTS print came in above expectations yesterday on a MoM basis:

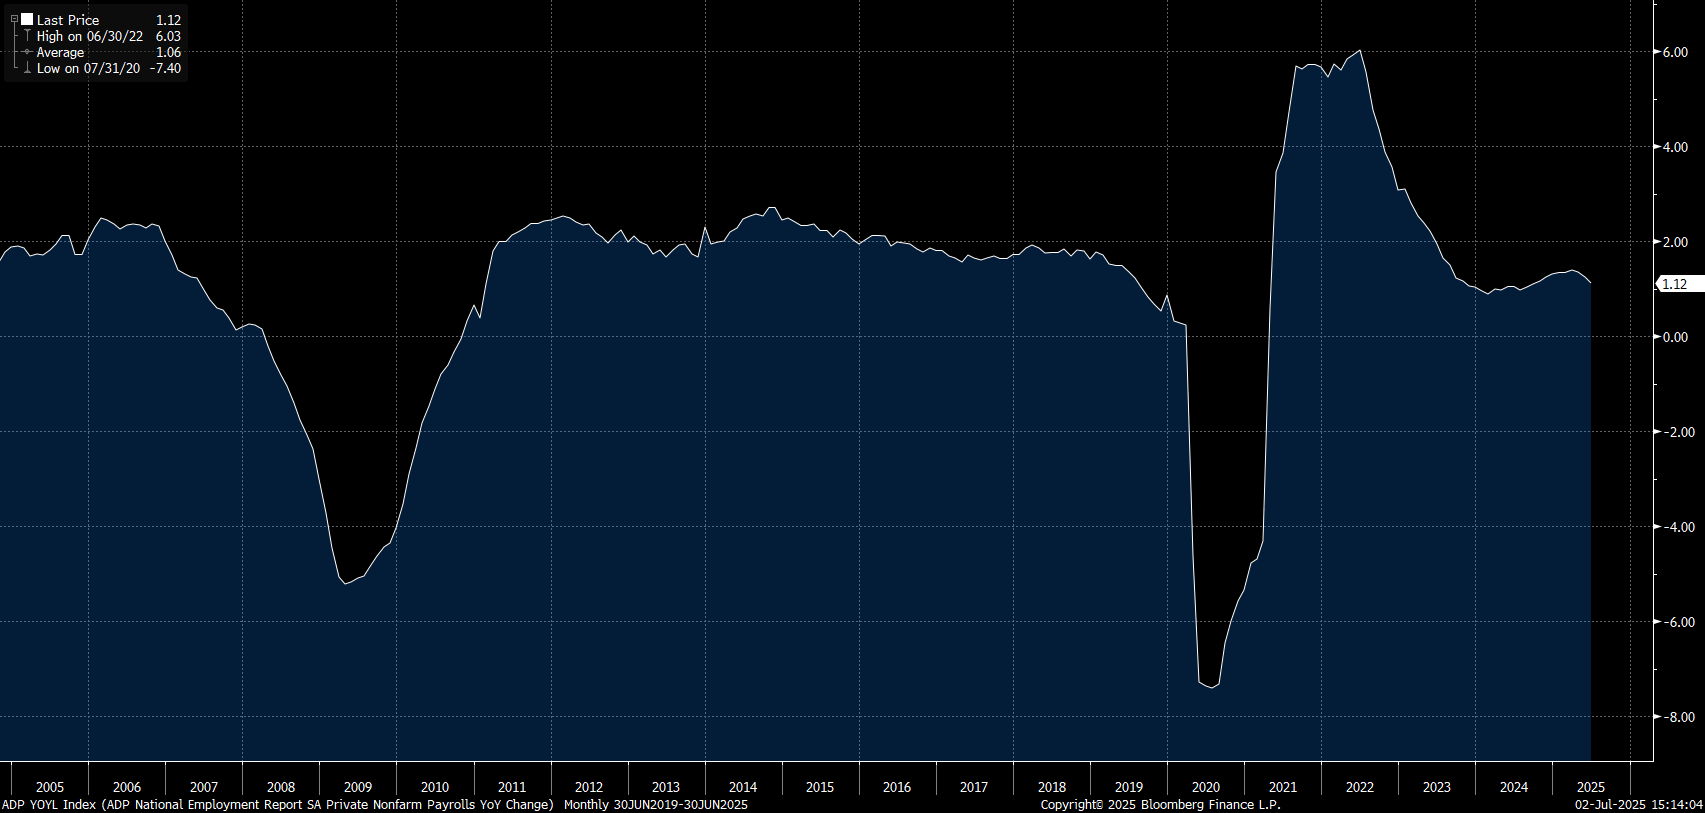
And ADP came in below expectations today showing a MoM contraction. This is very important to note because marginal weakening in the labor market is always key watch.

This MoM print is taking place in the larger YoY trend of elevated growth with fairly significant cuts being priced in the forward curve and credit spreads almost at cycle lows.
The NFP print tomorrow will be key for additional clarity. Consensus is converging around 106k:

I will lay out these dynamics further in a report for paid subscribers. For now, you can review all of the systematic models below.
Main Developments In Macro
US Macro + Fed Policy
Fed’s Barkin: No urgency to change policy at the moment; incoming data will be key before July meeting
Barkin: Economy still solid, consumers frustrated by high prices but still spending
Barkin: Businesses are holding off on investment, not cutting back
Richmond Fed President Tom Barkin appears on Fox Business
ADP US June Private Employment falls 33K; est. +98K
→ Major downside surprise, adds weight to September cut caseUS MBA Mortgage Applications Index rose 2.7% last week
→ Suggests housing demand holding despite broader fragility
Trade Policy + Geopolitics
Trump: Trade deal made with Vietnam
Trump: Vietnam will pay 20% tariff on US imports, 40% on transshipping
Trump: Vietnam to give US total market access; US imports into Vietnam at zero tariff
→ Suggests effort to shift supply chains and contain China indirectlyUS stock futures steady as tariff deadline nears: Macro Squawk
Corporate + Structural Trends
Microsoft to cut 9,000 workers in second wave of layoffs
Microsoft revamps sales unit to focus more on AI — Insider
Oracle, OpenAI deal expands Stargate project footprint in the US
OpenAI’s plan forms part of Oracle’s $30B US cloud infrastructure deal
→ Underlines ongoing reshoring and strategic digital capex boomDatadog set to replace Juniper Networks in S&P 500
→ Reflects sector rotation and AI-driven rebalancing
Macro Tear Sheets: Equities, Stock/Bond Correlation, Fixed Income, FX, Crypto, and Commodities
Macro Regime Dashboard: Excel spreadsheet for economic data, interest rates, and real estate.
Momentum and Mean Reversion Models: Equities, Commodities, Fixed Income, and Currencies
You can find the educational primer and video explanation of these models here: LINK
Here is a summary of all models and their directional strengths:

Growth, Inflation, Fixed Income, Credit, and Equities Regime Tracker
The Macro Regime Model offers a real-time view of growth, inflation, and yield curve dynamics, integrating these with credit market shifts, equity risk premiums, and positioning data. It connects upcoming catalysts to statistical drivers of asset prices, creating a unified framework that quantifies skew and clarifies risk-reward across asset classes.
Key Points To Set The Context:
Here’s the updated S&P 500 Sector Wrap using the latest sector contribution and performance data, contextualized within Powell’s testimony, ongoing tariff uncertainty, and growing market fatigue near record highs:
S&P 500 Rises 0.51% as Tech Megacaps Reassert Leadership, Rotation Eases Into Jobs Print
The S&P 500 advanced 0.51% on Wednesday, reclaiming record territory as large-cap tech reasserted dominance amid a softer labor print and ongoing trade diplomacy. While breadth narrowed from earlier in the week, sector rotation steadied as energy and materials followed tech higher. The ADP payroll miss introduced fresh downside risk ahead of Friday’s NFP release, prompting a modest repricing of Fed expectations and boosting rate-sensitive names.
Sector Contribution Breakdown (Weighted Return to Index)
Information Technology (+0.46 pp) – Dominated leadership, led by semis and software. Microsoft and chipmakers rallied as AI-related momentum returned.
Consumer Discretionary (+0.04 pp) – Modest gains on strength in autos and e-commerce.
Communication Services (+0.04 pp) – Platform names rebounded following three-session underperformance.
Energy / Industrials / Materials (+0.02 pp each) – Supportive commodity backdrop and demand stability helped.
Real Estate (+0.01 pp) – Steady as long-end yields stabilized.
Financials (–0.03 pp) – Weighed by curve flattening and pullback in regionals.
Health Care (–0.05 pp) – Lagged on Centene’s warning; ACA uncertainty returned.
Utilities (–0.01 pp) – Defensive demand faded slightly on broader equity strength.
Consumer Staples (–0.00 pp) – Flat as rotation narrowed.
Sector Performance Breakdown (Unweighted Index Returns)
Information Technology (+1.39%) – Best performer; NVIDIA and cloud AI plays bounced strongly.
Materials (+0.97%) – Miners, chemicals outperformed on real asset bid.
Energy (+0.72%) – Crude’s rebound supported refiners and E&P names.
Consumer Discretionary (+0.43%) – Footwear and apparel rallied on Vietnam trade deal.
Communication Services (+0.37%), Industrials / Real Estate (+0.24% each) – Broad participation, but not leading.
Utilities (–0.27%), Financials (–0.21%), Health Care (–0.49%) – Defensive sectors underperformed; ACA-driven volatility and yield pressure weighed.
Consumer Staples (–0.02%) – Marginal loss amid fading rate catalyst.
Macro Overlay: Fed Eyes Labor, Tariff Clock Ticks, Tech Reclaims Spotlight
1. ADP Surprise Shifts Narrative Toward Weakness
Private-sector jobs unexpectedly fell by –33k in June, the first drop in two years. Wage growth moderated and service-sector hiring softened, feeding expectations that Friday’s NFP could underwhelm. Treasuries firmed modestly, and rate cut odds for September rose slightly.
2. Powell Still Cautious, But Market Pressures Mount
Chair Powell reiterated that cuts remain data-dependent, with tariffs adding complexity. While July is not ruled out, base case remains a September move. Markets continue to drift ahead of the Fed’s cautious tone, as downside data risks build.
3. Trump-Vietnam Deal Signals De-escalation, but Structure Unclear
The US reached a trade deal with Vietnam, including 20% tariffs on exports and 0% on US goods into Vietnam. While equities cheered the news, the lack of implementation details and enforcement ambiguity tempers optimism. Broader tariff policy remains in flux ahead of July 9.
4. Tech Rotates Back to the Forefront
Following three days of relative underperformance, big tech surged, reclaiming index leadership. This helped mask softness in health care and financials, with underlying breadth narrowing.
Final Word: Markets Climb, But Leadership Narrows and Macro Risks Linger
The S&P 500’s rally was powered almost entirely by tech megacaps and commodity-sensitive names, while defensives and rate-sensitive sectors cooled. ADP’s miss injects uncertainty ahead of Friday’s jobs report with the risk skew now tilted toward a softer labor print and an earlier Fed pivot. Trade optimism remains tentative, and Powell’s caution stands in contrast to market pricing


US IG Credit Wrap — Spreads Nudge to 50.18 bp as Caution Persists Despite Trade Optimism, Soft ADP Print
Current Spread: 50.18 bp | 5-Year Average: 62.82 bp
Investment-grade (IG) credit spreads tightened modestly to 50.18 bp, hovering just above post-pandemic lows despite intensifying macro crosscurrents. Credit remains well-anchored, benefiting from declining volatility and a carry-friendly backdrop, even as Fed expectations, trade diplomacy, and labor market signals begin to diverge.
Credit Context
< 60 bp: Stable, duration-friendly range supporting insurance and liability-driven investment (LDI) strategies.
60–70 bp: Neutral-to-cautious positioning recommended amid tariff uncertainties and macroeconomic volatility.
> 90 bp: Significant market distress currently unlikely without a major escalation in geopolitical or macroeconomic shocks.
Macro Overlay: Mixed Signals, Firm Anchoring
1. Powell Reinforces Flexibility, Market Hears Patience
Chair Powell reiterated that July is “not off the table,” but emphasized the need to “wait and learn more” about the tariff pass-through on inflation. With the Fed watching evolving labor and inflation data, the IG market sees Powell’s stance as reinforcing stability over surprise.
“We wouldn’t take any meeting off the table... but the prudent thing is to wait,” — Powell, ECB Forum.
Market pricing still favors a September cut as base case, but the dovish wing of the FOMC continues to gain traction, keeping rate volatility contained a key support for credit.
2. Labor Market Shows First Cracks
June’s ADP report showed a surprise –33k drop in private payrolls the first monthly decline in over two years. Services sectors led the decline, with particularly steep losses in professional services and healthcare. Wage growth also cooled.
→ Average payrolls growth (past 3 months): just 18.7k, slowest since early 2021.
While not definitive, the soft print increases conviction that labor demand is easing — especially as Challenger data flagged second-weakest hiring intentions since 2004.
3. Trade Diplomacy Moves Forward — But Asymmetry Lingers
The US and Vietnam struck a deal eliminating Vietnamese tariffs on US goods, while imposing 20% tariffs on Vietnamese exports and 40% on transshipped goods. It’s a clear win for US exporters and trade visibility, but adds complexity to global value chains.
The market is reacting positively to the clarity, but long-term enforcement and downstream pricing impacts remain uncertain.
Elsewhere, Canada’s reset with the US and EU's willingness to negotiate a 10% universal tariff framework continue to de-escalate broader trade risk.
4. Manufacturing Soft, Pricing Pressures Still Real
ISM Manufacturing Index rose to 49.0 in June still in contraction. New orders and employment both weakened, with employment now contracting for a fifth straight month. However, prices paid surged to 69.7, near two-year highs.
→ A signal that inflationary pipeline pressures remain, even as demand softens.
Credit investors see this as further justification for duration neutrality not enough to fade risk, but no clear reason to extend it aggressively either.
Final Word: Carry In, Conviction Out
At 50.18 bp, IG credit is pricing a stable if fragile backdrop strong enough to hold spreads near their cycle tights, but too mixed to justify a renewed leg tighter. Tariff developments, softer jobs data, and Powell’s tone all suggest policy easing is coming just not imminently.

Mag7 Model:
See the intro published for how to use the Mag7 models here: Link
Short-End Rates Wrap — Cuts Repriced Slightly Shallower, But Dovish Bias Intact at –128.5 bp Through Dec 2026
Markets trimmed expectations modestly but maintained a deep easing trajectory Wednesday, with OIS-implied cumulative rate cuts through December 2026 now totaling –128.5 basis points (vs –135.1 bp prior). The recalibration came amid firmer dollar trade, stabilizing yields, and Powell’s steady hand in Sintra. The Fed Chair kept July optionality alive while reinforcing a data-dependent framework. Meanwhile, a strong labor backdrop, de-escalating trade risks, and soft consumption data continue to justify the lower-for-longer glide — even if the pace wobbles.
OIS-Implied Easing Path
Front-End Expectations
03-Jul-25: 4.330% → No live risk
30-Jul-25: 4.267% (–6.3 bp) → ~25% cut probability → Optionality retained
17-Sep-25: 4.040% (–22.7 bp) → ~91% cut probability → September still locked as pivot
Year-End 2025 Outlook
10-Dec-25: 3.681% → –64.9 bp total cuts → 2–3 cuts priced by year-end
Full Easing Cycle
09-Dec-26: 3.045% → –128.5 bp → Market sees terminal rate below 3.10%, with cuts extending steadily into late 2026
Macro Overlay: Risk-On Equities, But Fed Path Still Dovish
1. Powell Sticks to Script, Keeps July in Play
At the ECB’s Sintra forum, Chair Powell reiterated a cautious tone: the Fed is watching incoming data and tariff effects, and July “is not off the table.” While he emphasized patience, he didn’t actively push back against easing expectations, keeping the September cut as base case and maintaining two-cut consensus for 2025.
“We're going meeting by meeting... We’re not taking any meeting off the table.”
2. ADP Print Shows Cracks Emerging in Labor Market
June’s ADP private payrolls unexpectedly fell –33K — the first decline in over two years. Services were the drag, shedding –66K jobs, notably in health care, education, and business services. While the Fed won't pivot solely on one print, it reinforces softening momentum and raises risks for Friday’s NFP.
“Reluctance to replace workers has turned to net losses,” said ADP’s Richardson.
3. Trade Risk Defused: Vietnam Deal Lifts Risk Sentiment
Trump’s surprise trade deal with Vietnam — including 0% tariffs for US goods and targeted 20–40% levies on Vietnamese transshipments — removed a key tail risk. Canada scrapped its digital services tax, and EU negotiators are close to accepting Trump’s 10% universal tariff with carve-outs. Powell called trade inflation “hard to model,” but the street is clearly unwinding worst-case pricing.
4. Consumer Slippage Validates Cut Path, Not Panic
May spending fell –0.3% m/m and income dropped –0.4%. The savings rate hit 4.5% — the lowest since the pandemic. While jobs data suggest households are still employed, they are increasingly fragile — giving cover for the Fed to cut even in the absence of a full-blown slowdown.
Final Word: Slight Trim, Same Trajectory
At –128.5 bp, the cumulative easing path remains historically aggressive, even with recent trimming. The July meeting has become a live-but-unlikely event, while September continues to anchor trader expectations. Inflation is not accelerating, trade risks are fading, and consumption is weakening.

Tactical Portfolio
Keep reading with a 7-day free trial
Subscribe to Capital Flows to keep reading this post and get 7 days of free access to the full post archives.