

Macro Regime Tracker: Bottom In Equities?
Macro regime and risk assets qualified clearly

Macro Regime Tracker:
The Macro Regime Tracker offers a daily lens on how shifts in growth, inflation, and liquidity affect short-term risk and reward. Leveraging machine learning, AI, and cross-asset data, it identifies macro changes and their impact on market positioning.
Macro Regime Tracker Index:
Macro Regime Context
Macro Tear Sheets: Equities, Fixed Income, FX, Crypto, and Commodities
Macro Regime Dashboard: Excel spreadsheet for economic data and interest rates
Growth, Inflation, Fixed Income, Credit, and Equities Regime Tracker
AI and Machine Learning Strategies - Macro Regime and Positioning Premiums Strategies: S&P 500, 2-Year Interest Rates, Gold, and Bitcoin
Macro Regime Context:
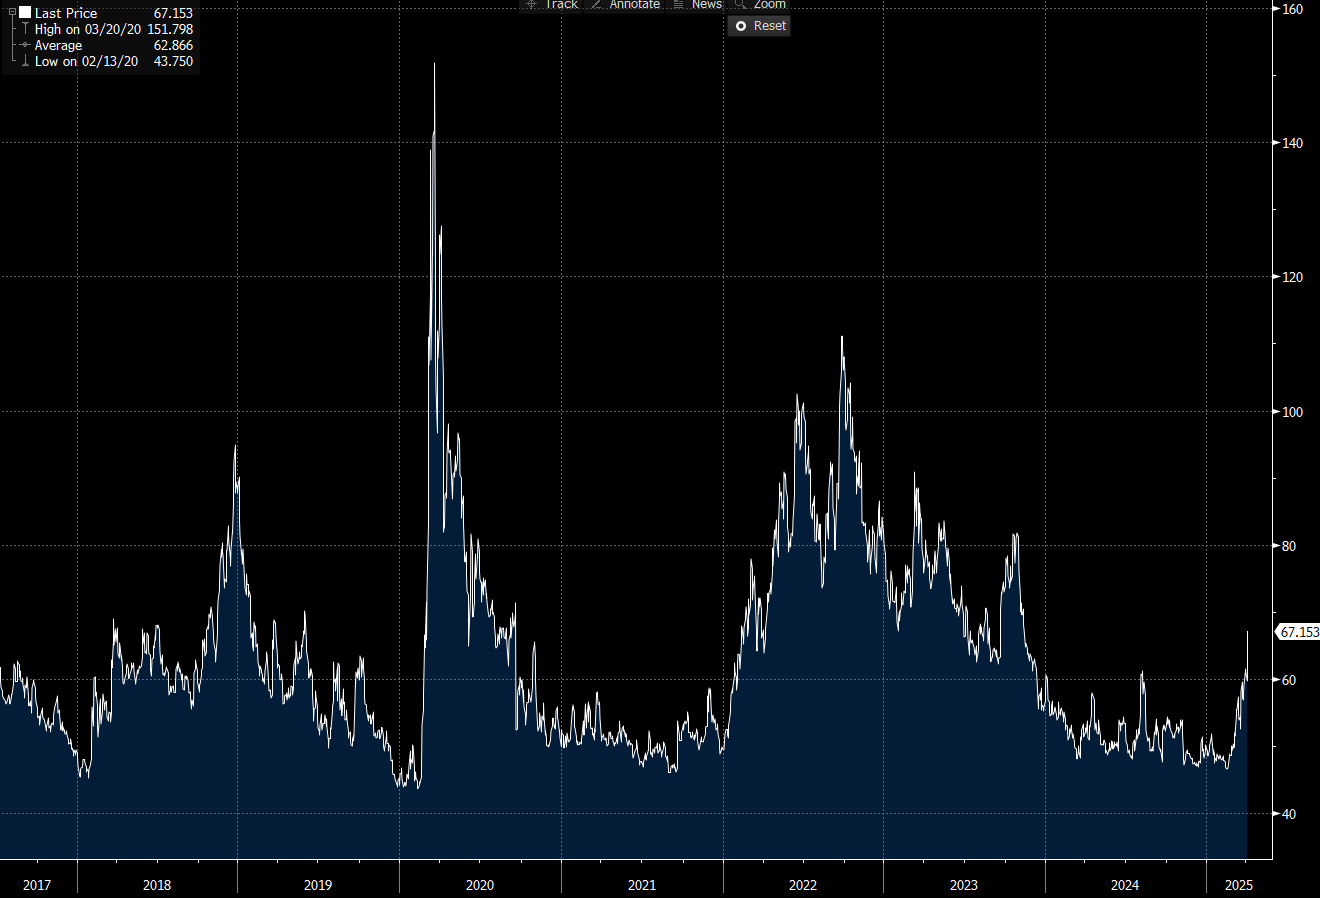
Brad is the expert on Chinese data and balance of payments flow. His point here illustrates how extreme Trump’s position is:
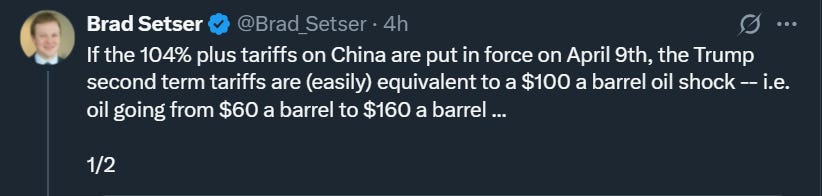

China is the world's largest exporter, while the United States is the largest importer. On one side, China weaponizes its balance of payments and currency to actively undermine the global order. On the other hand, the United States holds the global reserve currency—the foundation of international trade and finance. When global trade is disrupted, it jeopardizes the surplus of dollar liquidity that many countries have long depended on.

This is honestly why the actions of Trump seem almost out of place due to their extremity because their implications are quite literally the entire world of trade and finance. The more I look at the situation, the more I think that Trump and Bessent are creating a massive narrative to misdirect market participants.
Remember, equities have sold off due to the uncertainty surrounding these dynamics. Notice that earnings expectations have remained largely unchanged, and the primary driver to the downside has been the valuation component. Valuations are primarily connected to macro liquidity, which makes a lot of sense in the context of the liquidity implications above. (Chart is of Mag7 earnings and valuations):

In my view, it seems highly unlikely that the US will take both its deficit and trade balance to zero. Even if the US cut off all imports from China, the goods and services will just get routed through another country. It is impossible for the US to actually move into an isolationist stance. This was one of the primary dynamics I drew attention to in the macro report:
Comprehensive Macro Report: Geopolitics, The Risk In China, and The Carry Trade Unwind

The Monthly Macro Economic Report Is Below:
So the million dollar question is, why in the world are Trump and Bessent taking this approach when realistically it's highly unlikely that they will be able to actually cut off ties with the system of international trade and finance?
What if the drama between Powell and Trump is all an orchestrated narrative to keep the media focused on drama instead of looking at what all three of them (Trump, Powell, and Bessent) are accomplishing together? Is it possible that they are working together to create some tariff uncertainty that causes credit markets to slow and thereby put downward pressure on growth? The result of this would be ensuring inflation is really dead and growth is at a lower LEVEL so that interest rates can come down and secure cheaper financing for the government.

I don’t know if this is the case, but there are so many glaring questions that you have to stop and think, why are they all telling us to look in the same direction? IF Trump were to walk back even 50% of the statements about tariffs, the S&P500 would trade 400-500 points higher, and Bitcoin would push back to the 100k level.
I will dig into this further after covering the strategies.
Main Developments In Macro
*TRUMP: THERE IS NO INFLATION
*TRUMP REITERATES FED SHOULD CUT RATES
*TRUMP: CHINA RAISED ITS ALREADY `RIDICULOUSLY HIGH TARIFFS'
*HASSETT: MORE THAN 50 COUNTRIES NEGOTIATING ON TARIFFS
*HASSETT: TIME TO EASE OFF RHETORIC A BIT
*NAVARRO: TRUMP SEEKING CUTS TO TARIFFS, NON-TARIFF BARRIERS
*TRUMP SAYS IT ALL HAS TO CHANGE, ESPECIALLY WITH CHINA
*TRUMP THREATENS ADDITIONAL 50% TARIFFS ON CHINA
*EU CONSIDERING 25% TARIFF ON SOME US GOODS IN METALS DISPUTE
*TRUMP ON EU TARIFF RESPONSE: IT'S NOT ENOUGH
*TRUMP: EU 'SCREWING US' ON TRADE
*BESSENT: TRUMP HAD VERY, VERY PRODUCTIVE CALL WITH JAPAN PM
*BESSENT: LIKELY NO TRADE DEALS BEFORE APRIL 9
*BESSENT: OPTIMISTIC ABOUT TARIFF TALKS WITH `ALL' COUNTRIES
*FED'S GOOLSBEE SAYS HARD ECOOMIC DATA STILL PRETTY GOOD
*FED'S GOOLSBEE SAYS HARD ECOOMIC DATA STILL PRETTY GOOD
*NAVARRO: `GUARANTEE' NO RECESSION
*BESSENT: TRUMP WILL BE DIRECTLY INVOLVED IN JAPAN NEGOTIATIONS
*BESSENT: JAPAN WILL GET PRIORITY AS THEY CAME FORWARD QUICKLY
Macro Tear Sheets: Equities, Fixed Income, FX, Crypto, and Commodities
Macro Regime Dashboard: Excel spreadsheet for economic data and interest rates
Growth, Inflation, Fixed Income, Credit, and Equities Regime Tracker
The Macro Regime Model offers a real-time view of growth, inflation, and yield curve dynamics, integrating these with credit market shifts, equity risk premiums, and positioning data. It connects upcoming catalysts to statistical drivers of asset prices, creating a unified framework that quantifies skew and clarifies risk-reward across asset classes.
Key Points:
S&P 500 Intraday – Sharp Rebound Amid Easing Trade Concerns
The S&P 500 staged a powerful rally today, finishing up +3.31% and erasing a substantial portion of its recent losses. After days of escalating tariff headlines and systematic deleveraging, the market pivoted dramatically as whispers of potential negotiations (or at least a pause in hostilities) appeared to spark heavy short-covering and renewed risk appetite.
Unlike the previous “no place to hide” rout, today’s price action was a broad-based surge higher. Almost every sector contributed positively, led by:
Information Technology (+1.34%) – Tech roared back, fueling the lion’s share of the index return. This looks like a beta-led rebound, with investors once again allocating to growth-oriented names.
Communication Services (+0.39%) and Consumer Discretionary (+0.38%) – These cyclical, consumer-driven segments jumped as sentiment improved. Investors appear willing to look past near-term uncertainty for higher-return exposures.
Financials (+0.29%) – A major turnaround from yesterday’s selling. The sector benefited from improved credit-market sentiment and the possibility of a steadier macro outlook.
Health Care (+0.20%) and Industrials (+0.18%) – Moderate gains suggest a broad-based shift back into both defensives (Health Care) and economically sensitive sectors (Industrials).
Energy (+0.11%) – Up modestly, as improved risk sentiment lifted oil prices and energy equities together.
Utilities (+0.02%) and Materials (+0.02%) – Both saw small positive prints, reflecting that risk-on flows favored higher-beta names, but these segments still eked out gains.
Real Estate (-0.02%) – The lone laggard, essentially flat. Rising rates or rotation away from yield proxies may have kept a lid on REITs.
This turnaround underscores how sensitive markets remain to trade-related headlines. After several sessions of mechanical and relentless selling that felt very much like a systematic unwind, today’s action had the hallmarks of short-covering and opportunistic dip buying. Importantly, we did not see the “panic” behavior that often characterizes major turning points; rather, the market methodically bid up virtually everything except Real Estate.

S&P 500 Intraday – Full-Blown Reversal (Unweighted)
The S&P 500 finished the day up +3.31%, but the unweighted internals reveal an even more dramatic rebound beneath the surface. After days of mechanical, across-the-board selling, today’s action looked like a classic short-covering surge with investors piling back into risk.
Broad Cyclical Comeback – Hardly a Sector Left Behind
Information Technology (+4.58%) – Tech led the charge, suggesting a sudden re-risking in growth-oriented names that were heavily sold off in the recent unwind. This is textbook “beta grab” as traders scramble to regain exposure.
Communication Services (+4.18%) and Consumer Discretionary (+3.67%) – Surging on the back of improved sentiment, these consumer-driven, higher-beta sectors also benefited from renewed optimism.
Energy (+3.09%) – A sharp snapback, indicative of forced covering more than any fundamental shift in oil or gas markets.
Industrials (+2.19%) and Financials (+1.98%) – Deeply cyclical corners of the market reawakened, in line with the broader risk-on pivot.
Health Care (+1.75%) and Consumer Staples (+1.42%) – Defensive sectors participated solidly in the rebound, reinforcing that the move was broad, not merely sector-specific.
Utilities (+0.70%) and Materials (+0.82%) – Both modestly higher, confirming the marketwide lift.
Real Estate (-0.88%) – The only sector in the red. This may reflect ongoing sensitivity to rates or a rotation away from yield proxies, which suffered during the volatility spike.
From Liquidation to Short Squeeze
Unweighted Metrics Outperform – This was not a case of a few megacaps dragging the index higher; the rebound spanned nearly every sector.
No Place to Hide (From Buying) – The flip side of the prior session’s indiscriminate selling is today’s equally sweeping risk-on move, suggesting systematic flows reversed.
Orderly Yet Relentless – Much like the prior unwind, this rally appeared mechanical, pointing to forced short-covering and fast money flows rather than a fundamental shift in the macro picture.
Bottom Line
This powerful +3.31% surge underscores how quickly market dynamics can flip when the threat of deeper tariff escalation takes a back seat—however briefly. The unweighted data highlights that nearly every pocket of the market participated, indicating this rally is more than just a large-cap relief bounce. From a macro perspective, volatility remains high; any renewed trade antagonism or macro shock could reignite selling.

S&P 500 Sector Breadth – Weakness Remains
Even though today's price action delivered a notable bounce, the underlying breadth tells a different story. The majority of stocks remain well below key technical levels, meaning that despite the short-term rally, the market remains extremely weak. This disparity suggests that today's bounce may be more of a temporary rebound rather than a broad-based recovery, as the widespread underlying weakness indicates that risk remains pervasive across the board.

Credit Risk Surges Again – Reinforcing Systemic Macro Stress
Credit markets are sending an unmistakable warning sign. After breaking decisively above the key 62.9 threshold yesterday, credit risk just surged higher to 75.28, marking new multi-year high. This renewed spike underscores that the repricing isn’t idiosyncratic to a handful of issuers; it’s a broad-based, systemic move mirroring the heightened risk signals in equities and rates.
The velocity of this latest jump shatters any lingering notion that credit might remain insulated. Instead, it confirms that credit is now fully aligned with the broader risk-off narrative, amplifying the potential for negative feedback loops.
STIR Update – Market Reprices Rapid Cuts, But Fed Unlikely to Blink on Equities Alone
After a brief spell of panic drove implied cuts as high as 29bps for the May FOMC meeting (and nearly 35bps in June), calmer heads have prevailed, pulling those expectations back to 11bps and 23bps, respectively. Even so, roughly 96bps of total easing is now priced in through year-end, still a significant dovish swing in a short time.
From a trading perspective, we’re looking to fade these extremes in the very front end. Levels above 95.82 in the May Fed Funds contract and 96.12 in July offer a more attractive risk/reward setup for those expecting the market’s worst-case scenario to ease off. The key theme remains that the Fed won’t step in just to cushion an equity-market correction: it would likely take clear signs of credit stress or a genuine liquidity event to force a pivot, especially with inflation still elevated. Consequently, we remain comfortable fading the most aggressive rate-cut bets under current conditions.

While we sat tight today, we are stalking a number of trader both domestic and abroad. All tactical trades will be published and announced via the Chat room.

Our internal notes will continue to be laid out in the chat function

Macro Regime and Positioning Premiums - Strategies:
As of market close, the strategies have updated, and here are the new directional skews. I want to walk you through the logic for WHY these are this way so you can understand HOW to think about markets.
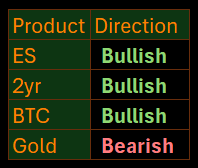
Equities (ES)
==================================================
Technical Levels for ES1 Index (Date: 2025-04-08)
==================================================
Daily Range: 133.63
Resistance Levels (Above Open):
------------------------------
R5: 5301.10 | Offset: +174.60
R4: 5267.78 | Offset: +141.28
R3: 5208.42 | Offset: + 81.92 *
R2: 5182.58 | Offset: + 56.08 *
R1: 5166.67 | Offset: + 40.17 *
------------------------------
Open Price: 5126.50
------------------------------
Support Levels (Below Open):
------------------------------
S1: 5124.92 | Offset: - 1.58 *
S2: 5099.08 | Offset: - 27.42 *
S3: 5083.17 | Offset: - 43.33 *
S4: 4951.90 | Offset: -174.60
S5: 4671.21 | Offset: -455.29
==================================================
* Denotes intraday level, likely tested
(In the top panel, the total impulse of macro drivers and positioning is illustrated in its strength. The greater the strength in the move, the higher the probability and amplitude of the move that is likely to take place. The bottom panel illustrates if the skew is either bullish or bearish probability.)
Notice that the ES strategy has flipped positive

(The next three charts show the underlying contribution for the Total Macro and Positioning Drivers in the chart above. These allow you to see the WHY behind moves.)
(The Equity Risk Premium contribution aggregates major macro factors and the strength of factors driving equity risk premiums. In the same manner, the higher the contribution moves, the more strength the drivers have in pushing the index in a specific direction.)
(The Positioning Premium Driver contribution identifies HOW the drivers of positioning are contributing to equity returns. In the same manner, the higher the contribution moves, the more strength the drivers have in pushing the index in a specific direction.)
Positioning has flipped back to marginally positive in its force on ES, which means the forced unwind has lost some strength.

(The Growth Risk Premium Driver contribution identifies HOW the drivers of growth are contributing to equity returns. In the same manner, the higher the contribution moves, the more strength the drivers have in pushing the index in a specific direction.)
The growth risk premia has flipped positive, though which is important to note because we aren’t seeing a complete collapse in growth yet. This might happen, but we need to time our actions correctly.

On net, the ES model has flipped marginally positive for a bullish directional skew.
2-Year Interest Rate
==================================================
Technical Levels for USGG2YR Index (Date: 2025-04-08)
==================================================
Daily Range: 0.13
Resistance Levels (Above Open):
------------------------------
R5: 3.82 | Offset: + 0.06 *
R4: 3.79 | Offset: + 0.03 *
R3: 3.77 | Offset: + 0.02 *
R2: 3.76 | Offset: + 0.01 *
R1: 3.76 | Offset: + 0.01 *
------------------------------
Open Price: 3.75
------------------------------
Support Levels (Below Open):
------------------------------
S1: 3.73 | Offset: - 0.02 *
S2: 3.72 | Offset: - 0.04 *
S3: 3.71 | Offset: - 0.05 *
S4: 3.62 | Offset: - 0.13
S5: 3.47 | Offset: - 0.29
==================================================
* Denotes intraday level, likely tested
(In the top panel, the total impulse of macro drivers and positioning is illustrated in its strength. The greater the strength in the move, the higher the probability and amplitude of the move that is likely to take place. The bottom panel illustrates if the skew is either bullish or bearish probability.)
The bullish skew in ES is overlapping with a bullish skew in the 2-year interest rate:

(The Inflation Risk Premium Driver contribution identifies HOW the drivers of inflation expectations are contributing to 2-year returns. In the same manner, the higher the contribution moves, the more strength the drivers have in pushing rates in a specific direction.)

(The Commodity Premium Driver contribution identifies HOW the drivers of commodities are contributing to 2-year returns. In the same manner, the higher the contribution moves, the more strength the drivers have in pushing rates in a specific direction.)
(The Growth Risk Premium Driver contribution identifies HOW the drivers of growth are contributing to 2-year returns. In the same manner, the higher the contribution moves, the more strength the drivers have in pushing rates in a specific direction.)

Gold
==================================================
Technical Levels for GC1 Comdty (Date: 2025-04-07)
==================================================
Daily Range: 36.62
Resistance Levels (Above Open):
------------------------------
R5: 3063.78 | Offset: + 47.38
R4: 3045.90 | Offset: + 29.50 *
R3: 3032.43 | Offset: + 16.03 *
R2: 3026.24 | Offset: + 9.84 *
R1: 3018.17 | Offset: + 1.77 *
------------------------------
Open Price: 3016.40
------------------------------
Support Levels (Below Open):
------------------------------
S1: 2956.11 | Offset: - 60.29
S2: 2917.07 | Offset: - 99.33
S3: 2883.74 | Offset: -132.66
S4: 2882.83 | Offset: -133.57
S5: 2815.97 | Offset: -200.43
==================================================
* Denotes intraday level, likely tested
In the top panel, the total impulse of macro drivers and positioning is illustrated in its strength. The greater the strength in the move, the higher the probability and amplitude of the move that is likely to take place. The bottom panel illustrates if the skew is either bullish or bearish probability.
The skew for gold has flipped marginally negative but the impulse to the downside isn’t significant yet:

(The US Macro Liquidity Driver contribution identifies HOW the drivers of US liquidity are contributing to the returns of Gold. In the same manner, the higher the contribution moves, the more strength the drivers have in pushing gold in a specific direction.)

(The Gold Risk Premium Driver contribution identifies HOW the risk premium of gold is contributing to returns. In the same manner, the higher the contribution moves, the more strength the drivers have in pushing gold in a specific direction.)

(The Dollar Liquidity Driver contribution identifies HOW the drivers of dollar liquidity are contributing to the returns of Gold. In the same manner, the higher the contribution moves, the more strength the drivers have in pushing gold in a specific direction.)

The Global Liquidity Driver contribution identifies HOW the drivers of global liquidity are contributing to the returns of Gold. In the same manner, the higher the contribution moves, the more strength the drivers have in pushing gold in a specific direction.

Bitcoin
==================================================
Technical Levels for XBTUSD Curncy (Date: 2025-04-08)
==================================================
Daily Range: 1720.06
Resistance Levels (Above Open):
------------------------------
R5: 81744.19 | Offset: +2820.23
R4: 81605.29 | Offset: +2681.33
R3: 80895.69 | Offset: +1971.73
R2: 80418.94 | Offset: +1494.98 *
R1: 80084.20 | Offset: +1160.24 *
------------------------------
Open Price: 78923.96
------------------------------
Support Levels (Below Open):
------------------------------
S1: 78563.11 | Offset: -360.85 *
S2: 77853.51 | Offset: -1070.45 *
S3: 77042.02 | Offset: -1881.94
S4: 75432.54 | Offset: -3491.42
S5: 74710.98 | Offset: -4212.98
==================================================
* Denotes intraday level, likely tested
In the top panel, the total impulse of macro drivers and positioning is illustrated in its strength. The greater the strength in the move, the higher the probability and amplitude of the move that is likely to take place. The bottom panel illustrates if the skew is either bullish or bearish probability.
The skew for Bitcoin is bullish based on the underlying macro drivers. This overlaps with the bullish skew in ES:

(The US Macro Liquidity Driver contribution identifies HOW the drivers of US liquidity are contributing to the returns of Bitcoin. In the same manner, the higher the contribution moves, the more strength the drivers have in pushing Bitcoin in a specific direction.)

(The Bitcoin Risk Premium Driver contribution identifies HOW the risk premium of Bitcoin is contributing to returns. In the same manner, the higher the contribution moves, the more strength the drivers have in pushing the Bitcoin in a specific direction.)

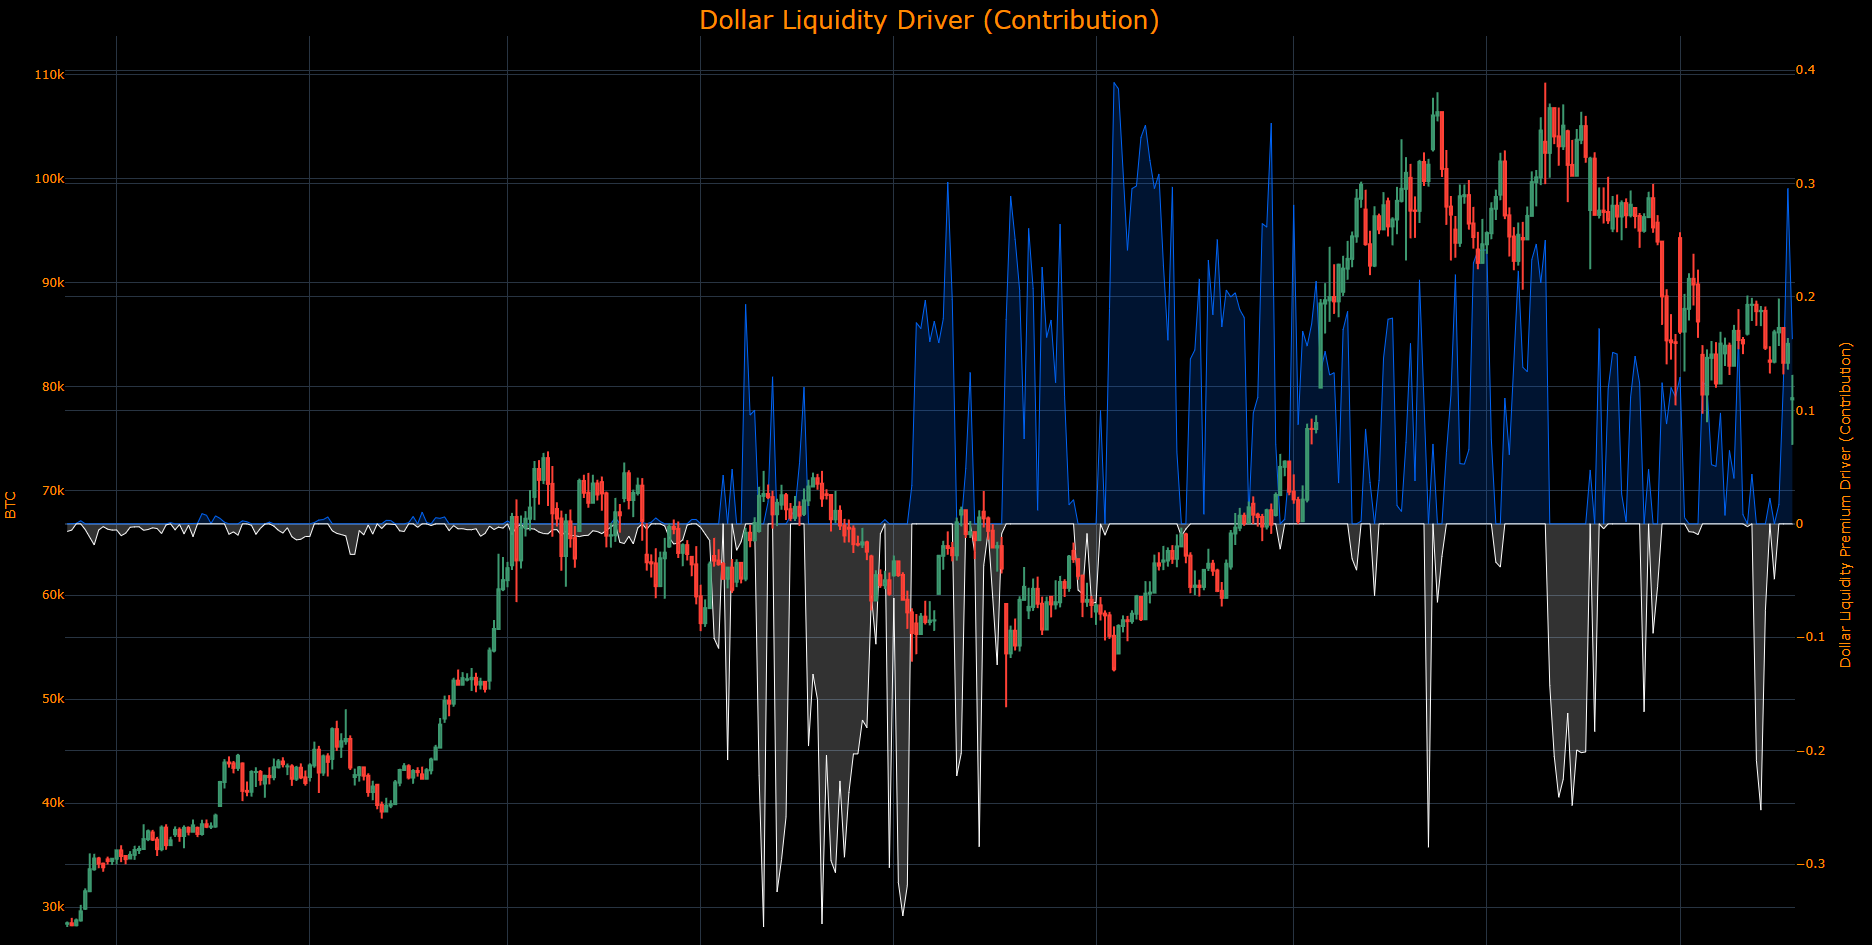
(The Dollar Liquidity Driver contribution identifies HOW the drivers of dollar liquidity are contributing to the returns of Bitcoin. In the same manner, the higher the contribution moves, the more strength the drivers have in pushing Bitcoin in a specific direction.)
(The Global Liquidity Driver contribution identifies HOW the drivers of global liquidity are contributing to the returns of Bitcoin. In the same manner, the higher the contribution moves, the more strength the drivers have in pushing Bitcoin in a specific direction.)

Final Note:
The strength for the bullish ES trigger is increasing marginally as the charts above show. This is overlapping with the 2 year rate beginning to skew to the upside as well.
In my view, the downside for ES is decreasing significantly on a short-term basis. There has been such a significant amount of uncertainty priced based on the tariff news and especially the most recent China news that’s unrealistic. The price action today illustrates these drivers with the gap down and then retracement to being green on the day. Even when the White House called the tariff rumors “fake news”, ES held its strength and rallied into the close.

This overlapped with ZT trading down all day:

The same is true with ZN. ZN actually sold off more than ZT to cause the curve to steepen. This is not the type of price action you see during a recession.

It is clear that this administration is HORRIBLE at communicating but this just came across the tape and if its true, then Bessent is likely aware some credit deals are falling through and they need to be careful about causing an entire collapse through day after day gaps down in ES.

While we need to be careful, the developments in information and the models quantifying the macro drivers are beginning to skew ES to the upside and bonds to the downside on a short-term basis. We are most certainly not moving back into a “normal regime,” but the positioning signals and macro drivers are clear. The ranges are wider, so being nimble is still key.
As always, a Pepe for the culture:


The information on this website/Substack is for information purposes only. It is believed to be reliable, but Capital Flows does not warrant its completeness or accuracy. The information on the website/Substack is not intended as an offer or solicitation for the purchase of stock or any financial instrument. The information and materials contained in these pages and the terms, conditions and descriptions that appear, are subject to change without notice. Unauthorized use of Capital Flows websites and systems including but not limited to data scraping, unauthorized entry into Capital Flows systems, misuse of passwords, or misuse of any information posted on a site is strictly prohibited. Your eligibility for particular services is subject to final determination by Capital Flows and/or its affiliates. Investment services are not bank deposits or insured by the FDIC or other entity and are subject to investment risks, including possible loss of principal amount invested. Your use of any information which is proprietary to Capital Flows or a third-party information provider shall only be used on individual devices without any right to redistribute, upload, export, copy, or otherwise transfer the information to any centralized interdepartmental or shared device, directory, database or other repository nor to otherwise make it available to any other entity/person/third party, without the prior written consent of Capital Flows.
OPEC increases aupply day after Trump was at LIV. Saudia Arabia pushed for supply increase publicly. So, i think its fair tonsay they are going after rates.
Great read!