

Macro Regime Tracker: China and the yuan risk
Macro regime and risk assets qualified clearly

Macro Regime Tracker:
The Macro Regime Tracker offers a daily lens on how shifts in growth, inflation, and liquidity affect short-term risk and reward. Leveraging machine learning, AI, and cross-asset data, it identifies macro changes and their impact on market positioning.
Macro Regime Tracker Index:
Macro Regime Context
Macro Tear Sheets: Equities, Fixed Income, FX, Crypto, and Commodities
Macro Regime Dashboard: Excel spreadsheet for economic data and interest rates
Growth, Inflation, Fixed Income, Credit, and Equities Regime Tracker
AI and Machine Learning Strategies - Macro Regime and Positioning Premiums Strategies: S&P 500, 2-Year Interest Rates, Gold, and Bitcoin
Macro Regime Context:
We have seen some important developments with the tariffs on China today that caused equities to sell off. I laid this out in the intraday update:
Intraday Update: Risks In China With The Yuan

As I laid out in yesterday’s article (link), these tariffs on China create an environment that is highly unrealistic for China. Remember, China manages its currency in order to maintain its stance in the impossible trinity.
As I have drawn attention to in yesterday’s note (link), this action of 104% is so extreme that it almost seems like misdirection or a negotiating tactic. Intraday, the dollar made a significant rally against the Yuan as the news came out indicating the source of selling pressure in equities.

Main Developments In Macro
*BESSENT: UP TO 7O COUNTRIES ASK TO NEGOTIATE
*BESSENT: SOLID PROPOSALS ON TARIFFS MAY LEAD TO GOOD DEALS
*BESSENT: COUNTRIES THAT DIDN'T ESCALATE WILL GET TALKS PRIORITY
*CHINA HAS AMPLE POLICY TOOLS TO OFFSET EXTERNAL IMPACTS:PREMIER
*TRUMP: 'THINGS ARE LOOKING GOOD' ON S. KOREA
*TRUMP: WE ARE WAITING FOR CALL FROM CHINA, 'IT WILL HAPPEN'
*HASSETT: MARKETS MOVE UP, MARKETS MOVE DOWN
*LEAVITT: 104% LEVY ON CHINA IMPORTS INTO THE US BEGINS TOMORROW
*LEAVITT: 'RECIPROCAL TARIFFS' WILL CONTINUE TO GO INTO EFFECT
*LEAVITT: IF CHINA MAKES A DEAL TRUMP WILL BE 'GRACIOUS'
*TRUMP: WE NEED MORE THAN DOUBLE THE ELECTRICITY WE HAVE NOW
*TRUMP: SIGNED ACTION THIS AFTERNOON TO STREGTHEN ELECTRIC GRID
*TRUMP: WILL PUSH HARD TO GET LARGE SCALE SPENDING CUTS DONE
Macro Tear Sheets: Equities, Fixed Income, FX, Crypto, and Commodities
Macro Regime Dashboard: Excel spreadsheet for economic data and interest rates
An Important Note: Starting Friday, all of the strategies and in-depth commentary will be reserved for paid subscribers and behind the paywall. I have made them public this week so you can get a handle on them and understand the value they add. The mapping of the underlying macro drivers and positioning drivers are not even provided by the best investment banks in the world. We will continue to invest in the highest quality models and strategies that merge the new developments in AI and Machine Learning. If you are an early subscriber, you can lock in the current price of $150 a month for all of the future upside. The best is yet to come!
Growth, Inflation, Fixed Income, Credit, and Equities Regime Tracker
The Macro Regime Model offers a real-time view of growth, inflation, and yield curve dynamics, integrating these with credit market shifts, equity risk premiums, and positioning data. It connects upcoming catalysts to statistical drivers of asset prices, creating a unified framework that quantifies skew and clarifies risk-reward across asset classes.
Key Points:
S&P 500 Intraday – Deep Slide as Tariff Angst Escalates
The S&P 500 plunged -4.80% today in a dramatic reversal of yesterday’s optimism, as renewed fears over the US-China trade war and looming reciprocal tariffs rattled risk assets across the board. Hopes of a de-escalation faded rapidly as confirmation came that 104% tariffs would be imposed on a wide swath of Chinese imports. What followed was a brutal, cross-asset unwind driven by global growth fears, risk-aversion, and a re-rating of equity risk premia.
Unlike yesterday’s broad-based rebound, today’s selloff was led decisively by the Information Technology sector, which contributed the most to the downside:
Sector Performance Breakdown
Information Technology (-1.70%) – The epicenter of the selloff. Heavily-weighted tech names saw aggressive selling as traders rotated away from growth. A classic example of high-beta fragility during macro uncertainty.
Consumer Discretionary (-0.62%) – Tariff exposure and cyclical sensitivity made this sector particularly vulnerable, reflecting worries about demand destruction and weakened consumer confidence.
Financials (-0.48%) – The yield curve steepened, but credit risk and equity weakness overwhelmed any rate benefit. Concerns about recession and funding pressures weighed on the group.
Communication Services (-0.43%) – Another growth-heavy sector hit hard amid widespread deleveraging.
Health Care (-0.36%) and Industrials (-0.31%) – Broad economic sensitivity drove these sectors lower, though losses were modest relative to tech.
Energy (-0.15%) – Oil’s 10% drop since Friday and weakness in product markets dragged the sector lower, despite geopolitical supply headlines.
Consumer Staples (-0.17%), Real Estate (-0.10%), Utilities (-0.06%), and Materials (-0.09%) – Defensive segments didn’t offer refuge, although losses were more muted. The “no place to hide” dynamic was back in force.
Analysis
The short-covering rally has been unwound, and positioning is again tilting defensive.
This time, risk-off flows are more fundamental than mechanical driven by recession fears, rising cross-asset correlations, and a breakdown in diversification (stocks and bonds both weaker).
Volatility has returned to historic levels, with four straight sessions of 5%+ trading ranges, a sign of systemic stress, not just noise.
Credit markets and inflation expectations are sending mixed signals to the Fed, leaving rate cut bets in place, but with growing questions about the efficacy of monetary policy in a trade-driven downturn.

S&P 500 Intraday – Full-Blown Reversal (Unweighted)
Broad-Based Selling as Tariff Shock Ripples Through Markets
The S&P 500 fell sharply by -4.80%, but the unweighted sector breakdown paints an even starker picture: virtually no area of the market was spared, with steep losses across every sector, from high-beta growth to defensive yield plays.
What began as an orderly repricing turned into a system-wide liquidation, as confirmation of 104% tariffs on Chinese goods and collapsing confidence in global growth triggered a wave of systematic selling.
Indiscriminate Selling Across All Sectors
Consumer Discretionary (-5.97%) – The hardest-hit group, reflecting fears of demand destruction and exposure to import-sensitive goods.
Information Technology (-5.87%) – High-beta growth names unwound sharply, reversing the prior day’s surge amid fears of slowing investment and trade friction.
Materials (-4.74%) – A proxy for global industrial activity, deeply affected by the tariff escalation.
Energy (-4.57%) – Continued collapse in oil demand expectations has now spilled over to the broader energy complex.
Communication Services (-4.50%) – Weakness in ad-based, discretionary, and media businesses was pronounced.
Real Estate (-4.26%) – Yield-sensitive REITs sold off alongside rising volatility and funding market stress.
Industrials (-3.70%) – Cyclical names dragged lower by the threat of global recession and weakened export channels.
Financials (-3.26%) – Despite curve steepening, macro stress and credit concerns weighed heavily.
Health Care (-3.18%) – Defensive in theory, but caught in broad-based deleveraging flows.
Consumer Staples (-2.73%) and Utilities (-2.34%) – Even classic defensives were dumped, showing how widespread the liquidation became.
From Short Squeeze to Full Liquidation
Yesterday’s short-covering rally gave way to a complete reversal as macro risks reasserted themselves.
The breadth of the selloff was total: the unweighted index dropped in near lockstep with the cap-weighted, confirming that this was no longer just about the mega caps.
This sort of “no place to hide” action is more typical of risk events tied to policy missteps or macro shocks, and today delivered both.
Key Takeaways
The rally was a trap, yesterday’s beta grab has been unwound and then some.
Volatility is sticky: four straight days of >5% intraday ranges underscore the mechanical nature of current flows, this is not valuation-driven selling.
The tariff shock is acting as a tax on global growth, with ripple effects from equities to bonds, currencies, and commodities.
Even defensive plays are failing, signaling that deleveraging is in charge now.

S&P 500 Sector Breadth – Weakness Remains
Across all three timeframes 10D, 20D, and 50D moving averages, today marks a notable contraction in breadth, confirming the indiscriminate nature of the latest selloff.

Credit Market Flashing Warning – Spreads Spike to 81 bps
Credit markets are decisively widening, with high-yield spreads breaking sharply higher to 81.05 bps, a level not seen since the regional bank stress in early 2023. The chart shows a clear breakout from the post-2023 compression range, and that breakout is gathering pace.
This move mirrors the equity volatility, the surge in cross-asset correlations, and recent panic signals in risk assets. Importantly, it’s happening in tandem with:
A yield curve steepening, but for the wrong reasons, reflecting funding concerns, not reflation.
A collapse in equity market breadth and growing evidence of deleveraging.
Liquidity stress building under the surface, with swap spreads in long-end SOFR nearing extreme levels.

Short-End Rates – Market Sharply Repricing Fed Easing Path
Markets have moved aggressively to price in front-loaded rate cuts, with 110.5 bps of total easing expected by year-end 2025 — and nearly half of that (45.7 bps) concentrated in just the next two FOMC meetings.
Key Pricing Levels
May 7: 78% chance of a 25 bp cut fully priced.
June 18: 104% of a 25 bp cut priced; i.e. a full cut plus a decent shot at a second.
By July 30: ~70 bps of easing expected, nearly three full cuts in just three meetings.
What the Curve Is Telling Us
Market sees policy urgency: The front-loading of cuts suggests investors are positioning for rapid deterioration in growth or financial conditions, rather than a smooth, data-driven easing path.
Pricing is consistent with escalating credit stress, tariff-driven stagflation, and rising cross-asset volatility.
Beyond July, the curve flattens, suggesting uncertainty or conditionality around how deep the easing cycle can go.
Macro Context & Risk Implications
The first cut is now “when,” not “if.” Any pause or hawkish lean in Fed communication (especially CPI) could provoke a sharp short-end re-steepening.
The next 3 meetings (April–July) are critical with 69.5 bps priced, this is where expectations are most vulnerable to being re-priced, either by sticky inflation or resilient labor markets.
If risk-off persists and equities, credit, and energy remain under pressure, the front-end could invert further as cut urgency intensifies.

While we sat tight today, we are stalking a number of trader both domestic and abroad. All tactical trades will be published and announced via the Chat room.

See the recent one here:
Our internal notes will continue to be laid out in the chat function

Macro Regime and Positioning Premiums - Strategies:
As of market close, the strategies have updated, and here are the new directional skews.
We are still seeing the ES strategy skew price to the upside. I will be weighing this against how much change take place through the Asia session due to the tariff risk.

Equities (ES)
==================================================
Technical Levels for ES1 Index
==================================================
Daily Range: 139.75
Resistance Levels (Above Open):
------------------------------
R5: 5210.38 | Offset: +204.12
R4: 5139.60 | Offset: +133.35 *
R3: 5072.67 | Offset: + 66.42 *
R2: 5043.58 | Offset: + 37.33 *
R1: 5006.92 | Offset: + 0.67 *
------------------------------
Open Price: 5006.25
------------------------------
Support Levels (Below Open):
------------------------------
S1: 4941.17 | Offset: - 65.08 *
S2: 4912.08 | Offset: - 94.17 *
S3: 4875.42 | Offset: -130.83 *
S4: 4802.12 | Offset: -204.12
S5: 4450.79 | Offset: -555.46
==================================================
* Denotes intraday level, likely tested
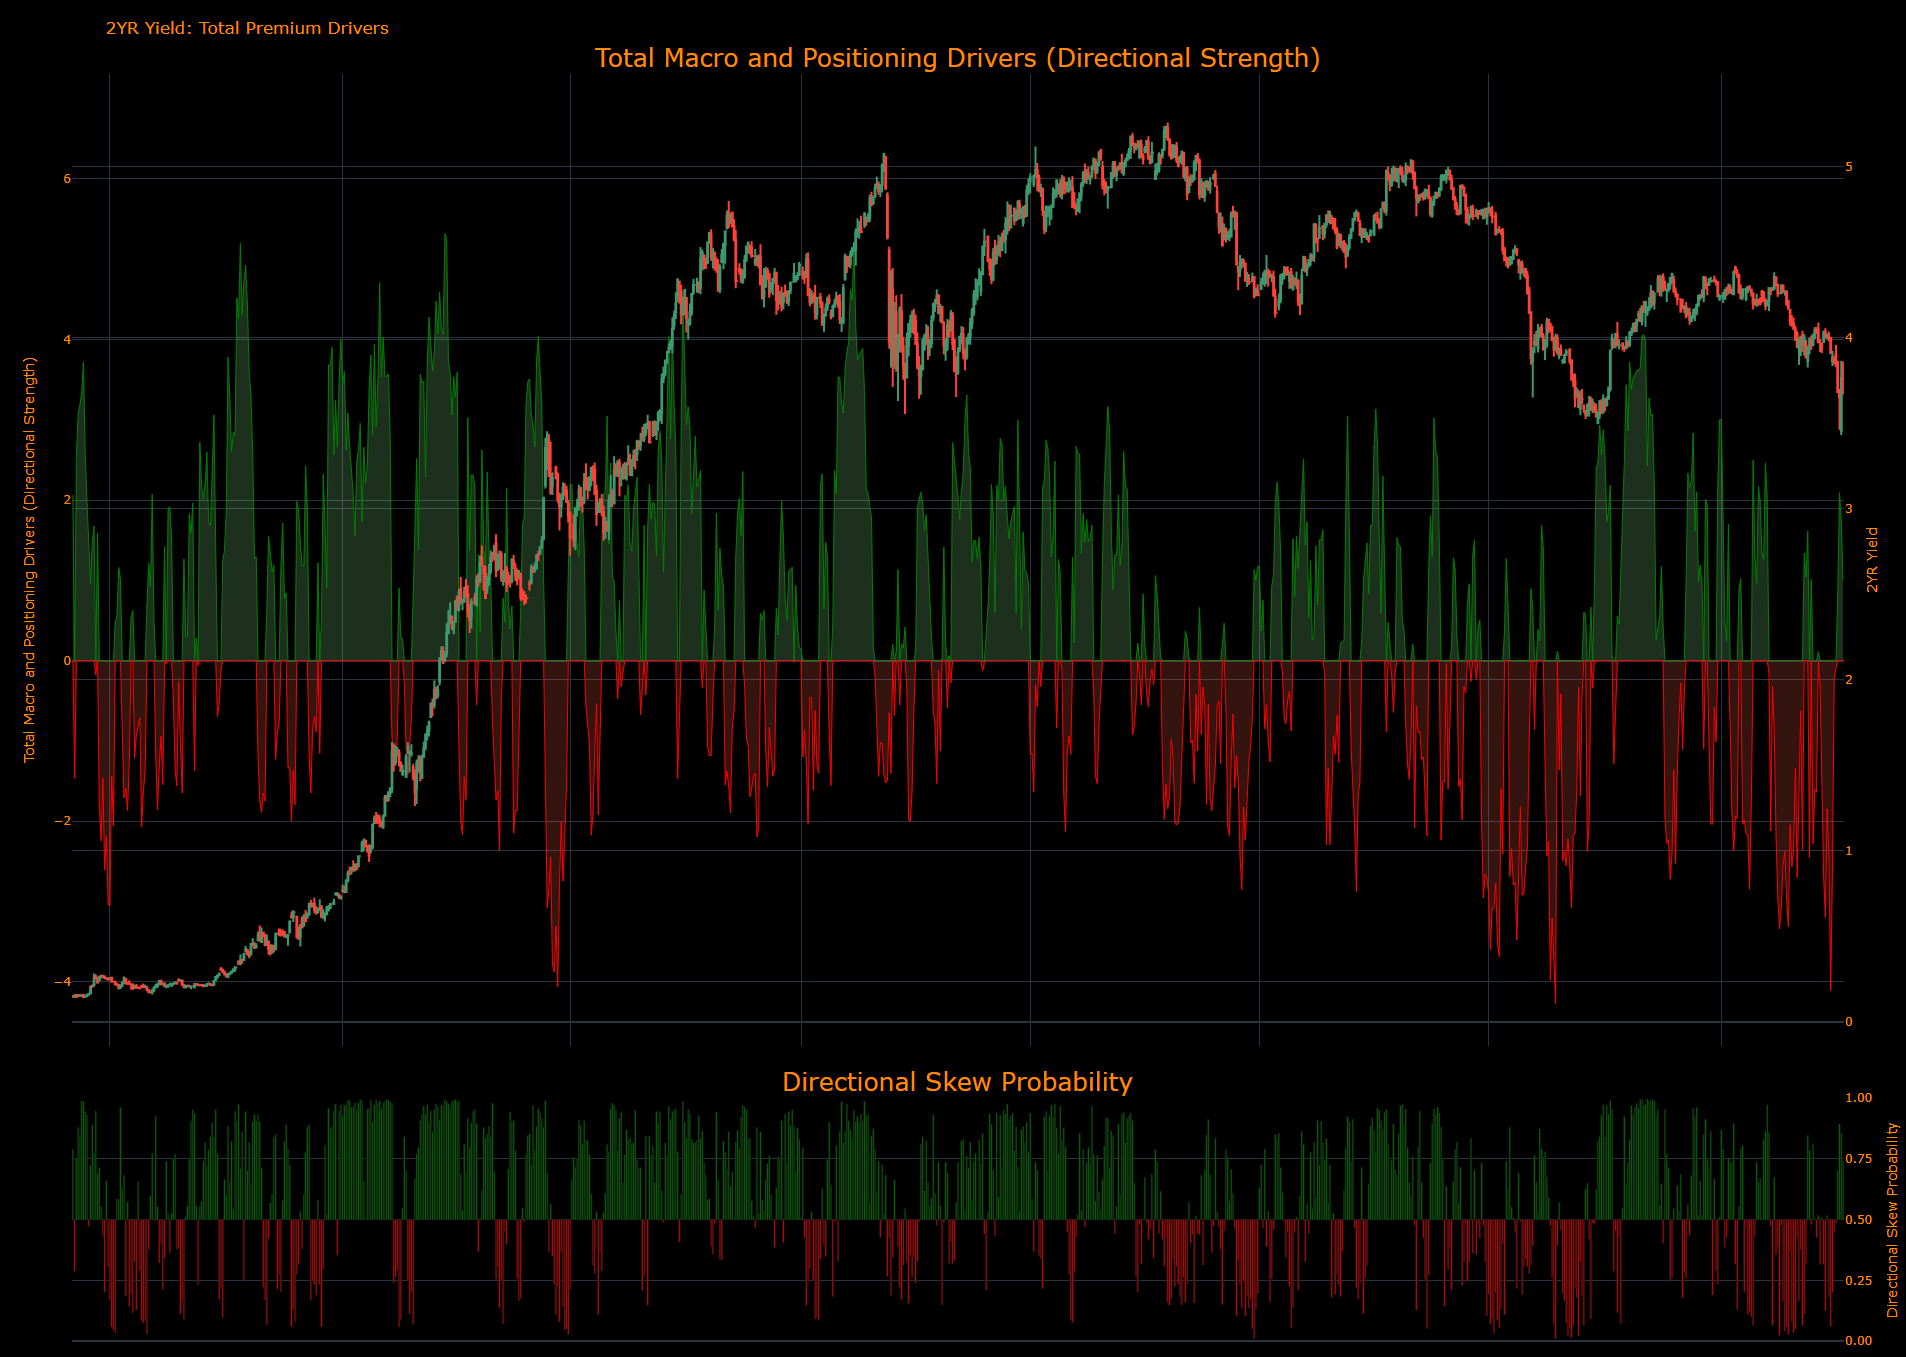
(In the top panel, the total impulse of macro drivers and positioning is illustrated in its strength. The greater the strength in the move, the higher the probability and amplitude of the move that is likely to take place. The bottom panel illustrates if the skew is either bullish or bearish probability.)
(The next three charts show the underlying contribution for the Total Macro and Positioning Drivers in the chart above. These allow you to see the WHY behind moves.)
(The Equity Risk Premium contribution aggregates major macro factors and the strength of factors driving equity risk premiums. In the same manner, the higher the contribution moves, the more strength the drivers have in pushing the index in a specific direction.)

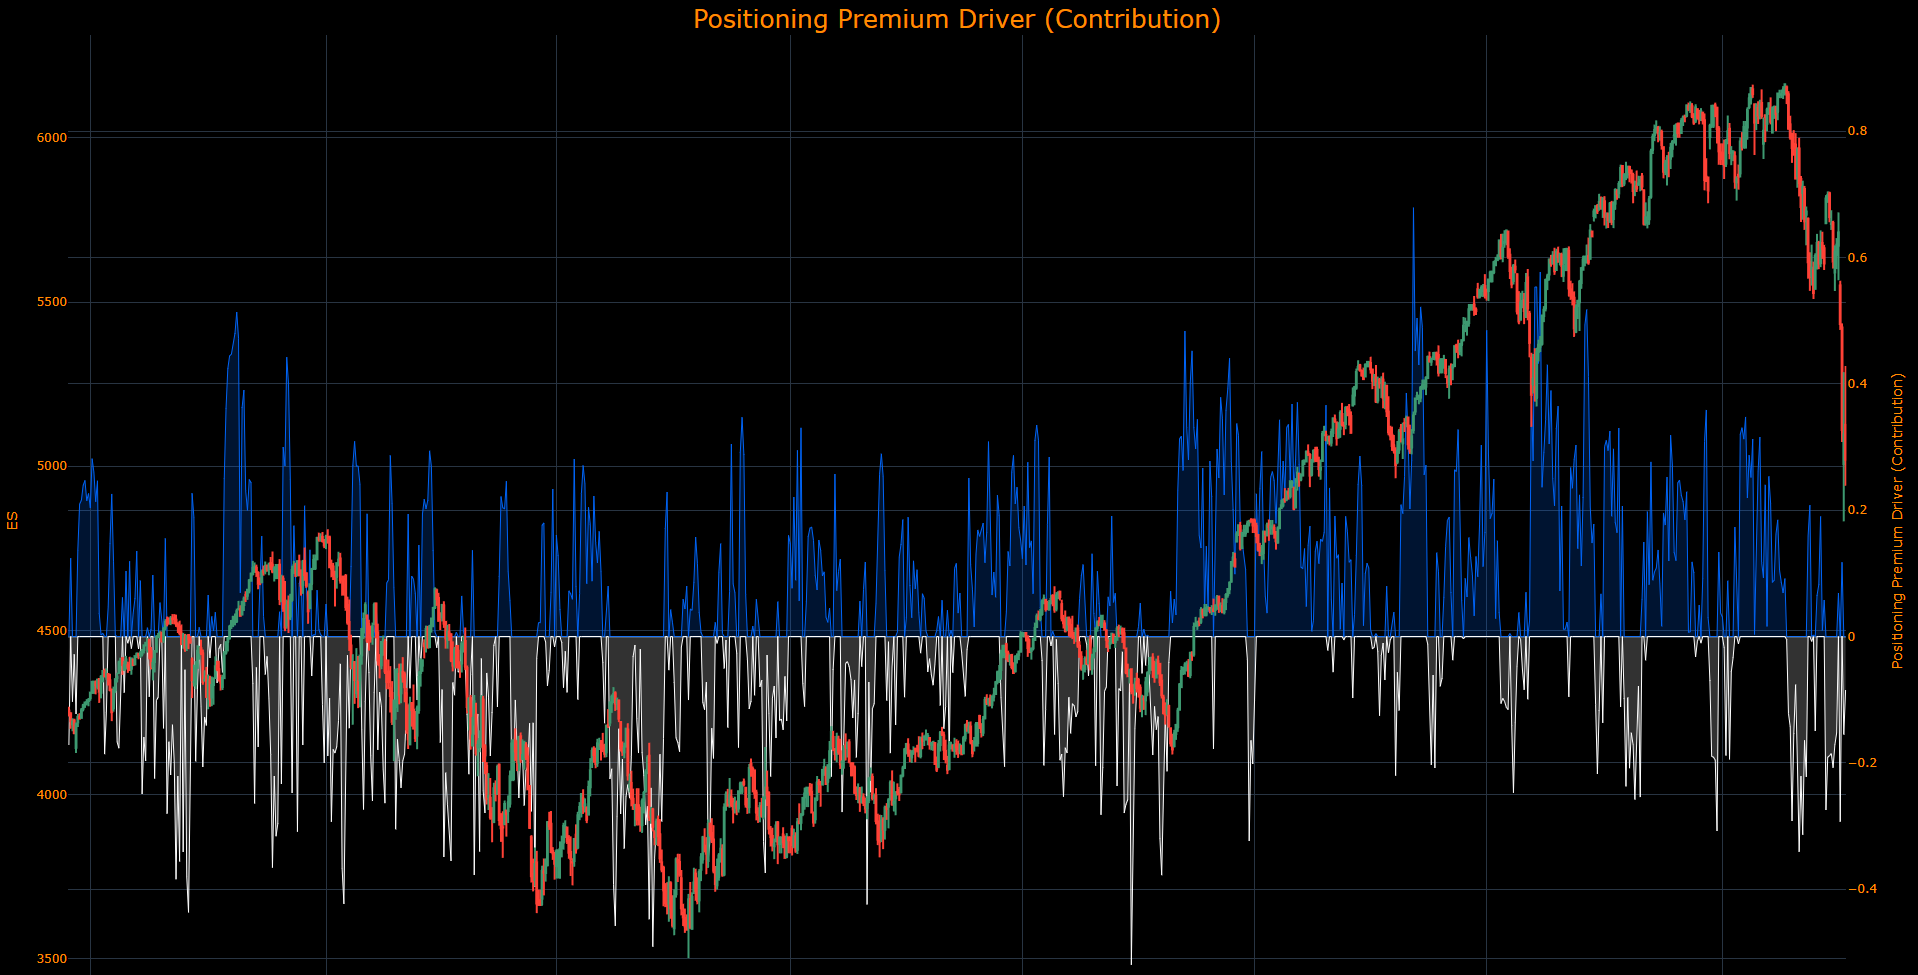
(The Positioning Premium Driver contribution identifies HOW the drivers of positioning are contributing to equity returns. In the same manner, the higher the contribution moves, the more strength the drivers have in pushing the index in a specific direction.)
(The Growth Risk Premium Driver contribution identifies HOW the drivers of growth are contributing to equity returns. In the same manner, the higher the contribution moves, the more strength the drivers have in pushing the index in a specific direction.)

2-Year Interest Rate
==================================================
Technical Levels for USGG2YR Index
==================================================
Daily Range: 0.12
Resistance Levels (Above Open):
------------------------------
R5: 3.90 | Offset: + 0.15
R4: 3.89 | Offset: + 0.13
R3: 3.84 | Offset: + 0.08 *
R2: 3.83 | Offset: + 0.08 *
R1: 3.81 | Offset: + 0.06 *
------------------------------
Open Price: 3.75
------------------------------
Support Levels (Below Open):
------------------------------
S1: 3.75 | Offset: - 0.00 *
S2: 3.64 | Offset: - 0.11 *
S3: 3.61 | Offset: - 0.15
S4: 3.56 | Offset: - 0.20
S5: 3.46 | Offset: - 0.30
==================================================
* Denotes intraday level, likely tested
(In the top panel, the total impulse of macro drivers and positioning is illustrated in its strength. The greater the strength in the move, the higher the probability and amplitude of the move that is likely to take place. The bottom panel illustrates if the skew is either bullish or bearish probability.)
The bullish skew in ES is overlapping with a bullish skew in the 2-year interest rate:
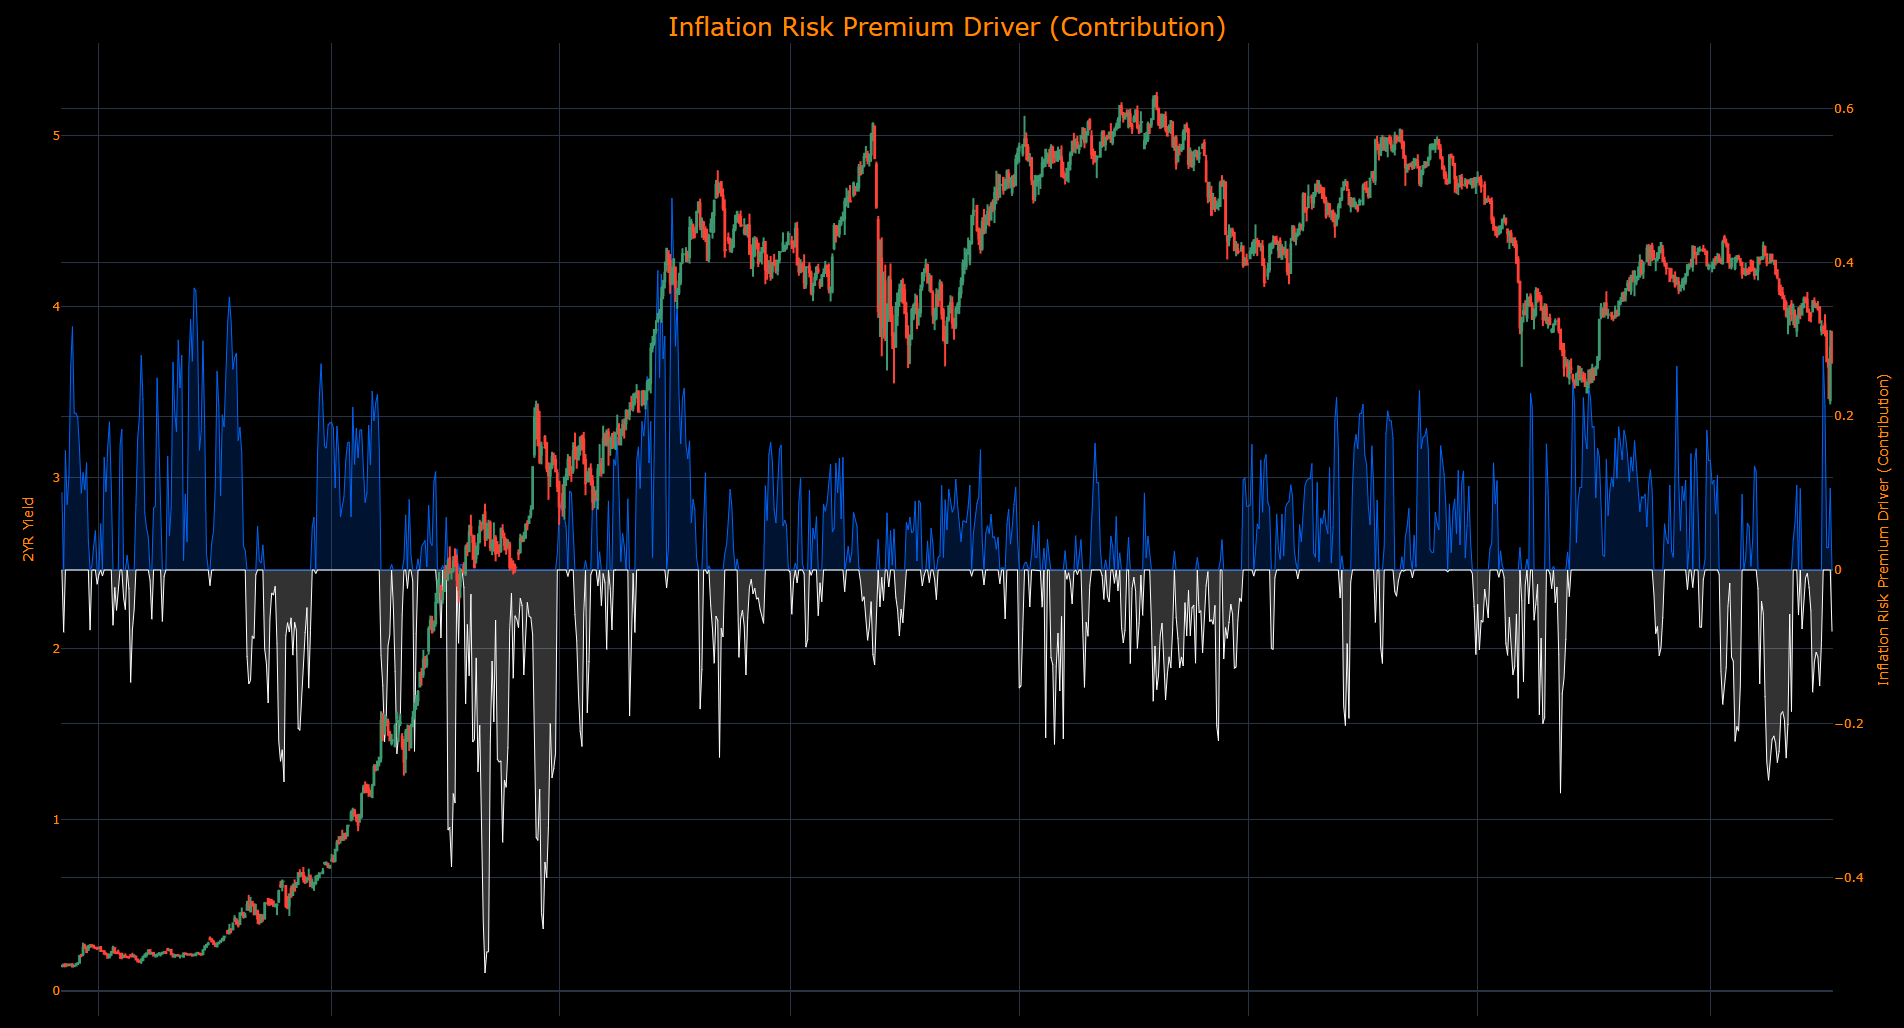
(The Inflation Risk Premium Driver contribution identifies HOW the drivers of inflation expectations are contributing to 2-year returns. In the same manner, the higher the contribution moves, the more strength the drivers have in pushing rates in a specific direction.)
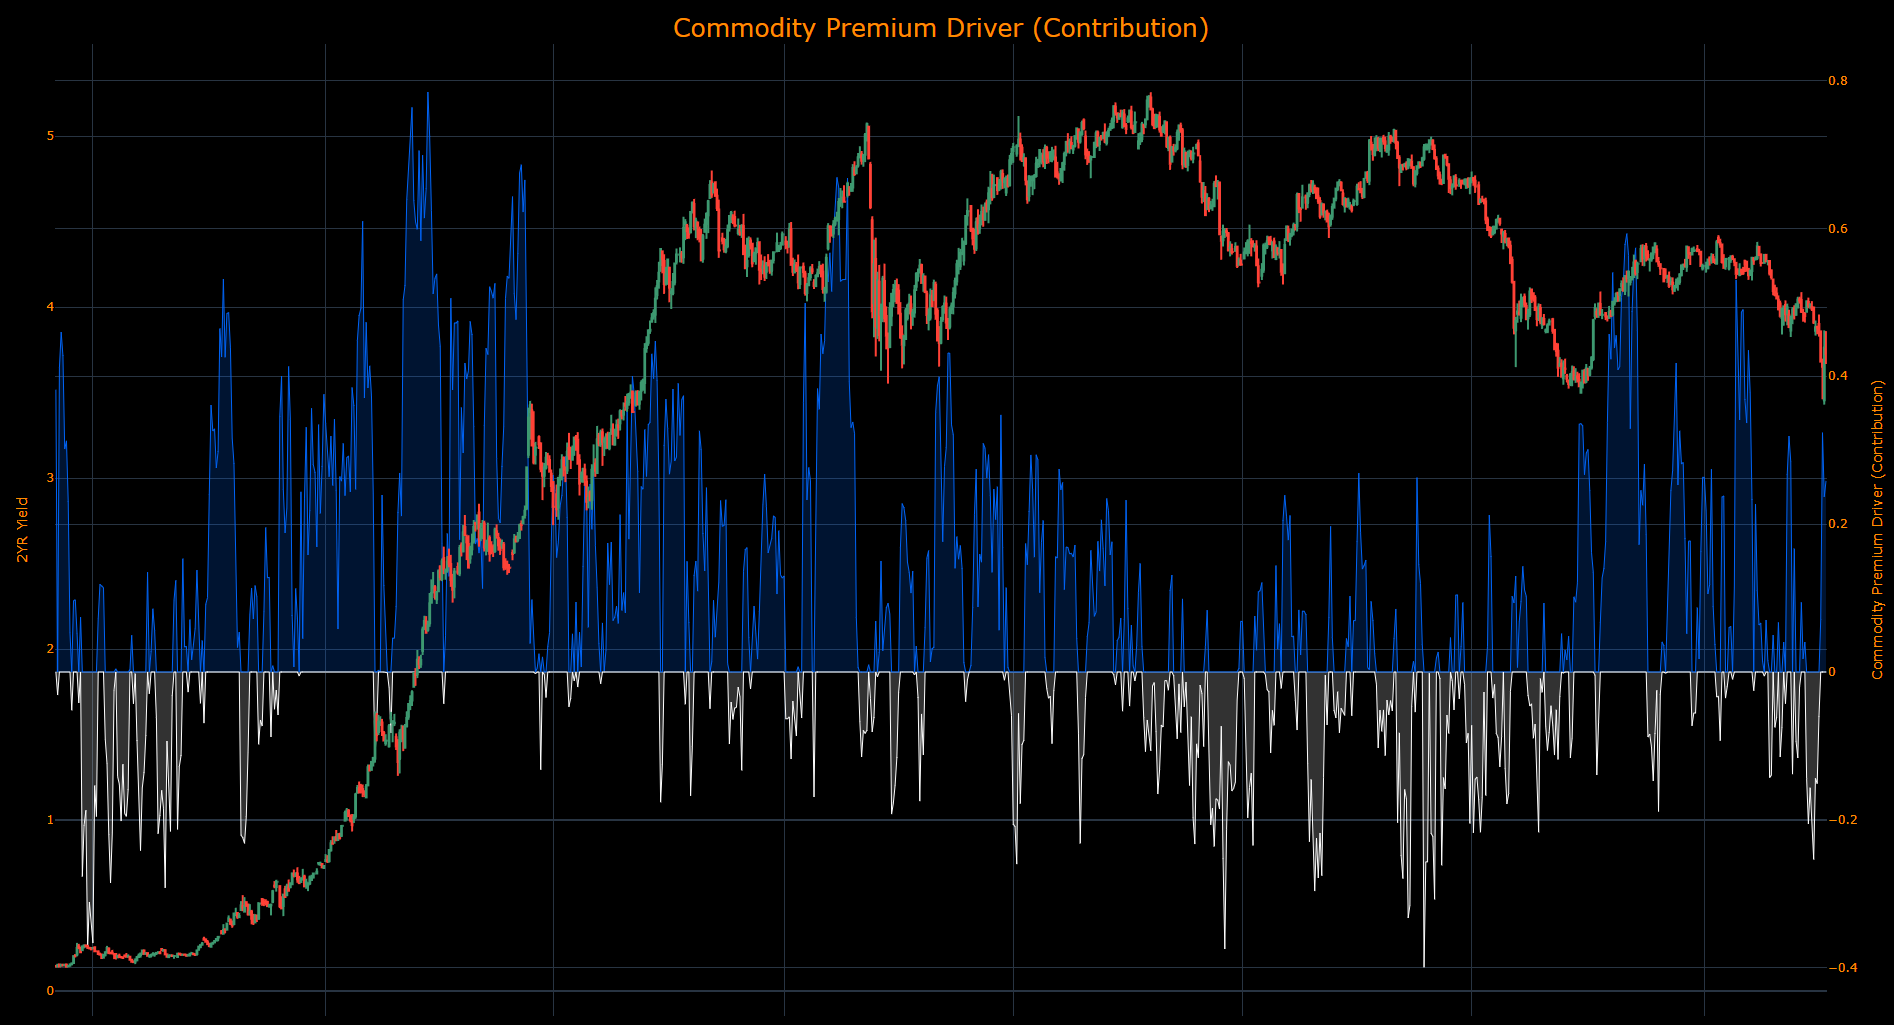
(The Commodity Premium Driver contribution identifies HOW the drivers of commodities are contributing to 2-year returns. In the same manner, the higher the contribution moves, the more strength the drivers have in pushing rates in a specific direction.)
(The Growth Risk Premium Driver contribution identifies HOW the drivers of growth are contributing to 2-year returns. In the same manner, the higher the contribution moves, the more strength the drivers have in pushing rates in a specific direction.)

Gold
==================================================
Technical Levels for GC1 Comdty
==================================================
Daily Range: 35.91
Resistance Levels (Above Open):
------------------------------
R5: 3031.81 | Offset: + 37.81
R4: 3026.60 | Offset: + 32.60 *
R3: 3020.73 | Offset: + 26.73 *
R2: 3011.09 | Offset: + 17.09 *
R1: 2997.50 | Offset: + 3.50 *
------------------------------
Open Price: 2994.00
------------------------------
Support Levels (Below Open):
------------------------------
S1: 2956.30 | Offset: - 37.70
S2: 2944.20 | Offset: - 49.80
S3: 2932.75 | Offset: - 61.25
S4: 2915.10 | Offset: - 78.90
S5: 2858.66 | Offset: -135.34
==================================================
* Denotes intraday level, likely tested
In the top panel, the total impulse of macro drivers and positioning is illustrated in its strength. The greater the strength in the move, the higher the probability and amplitude of the move that is likely to take place. The bottom panel illustrates if the skew is either bullish or bearish probability.
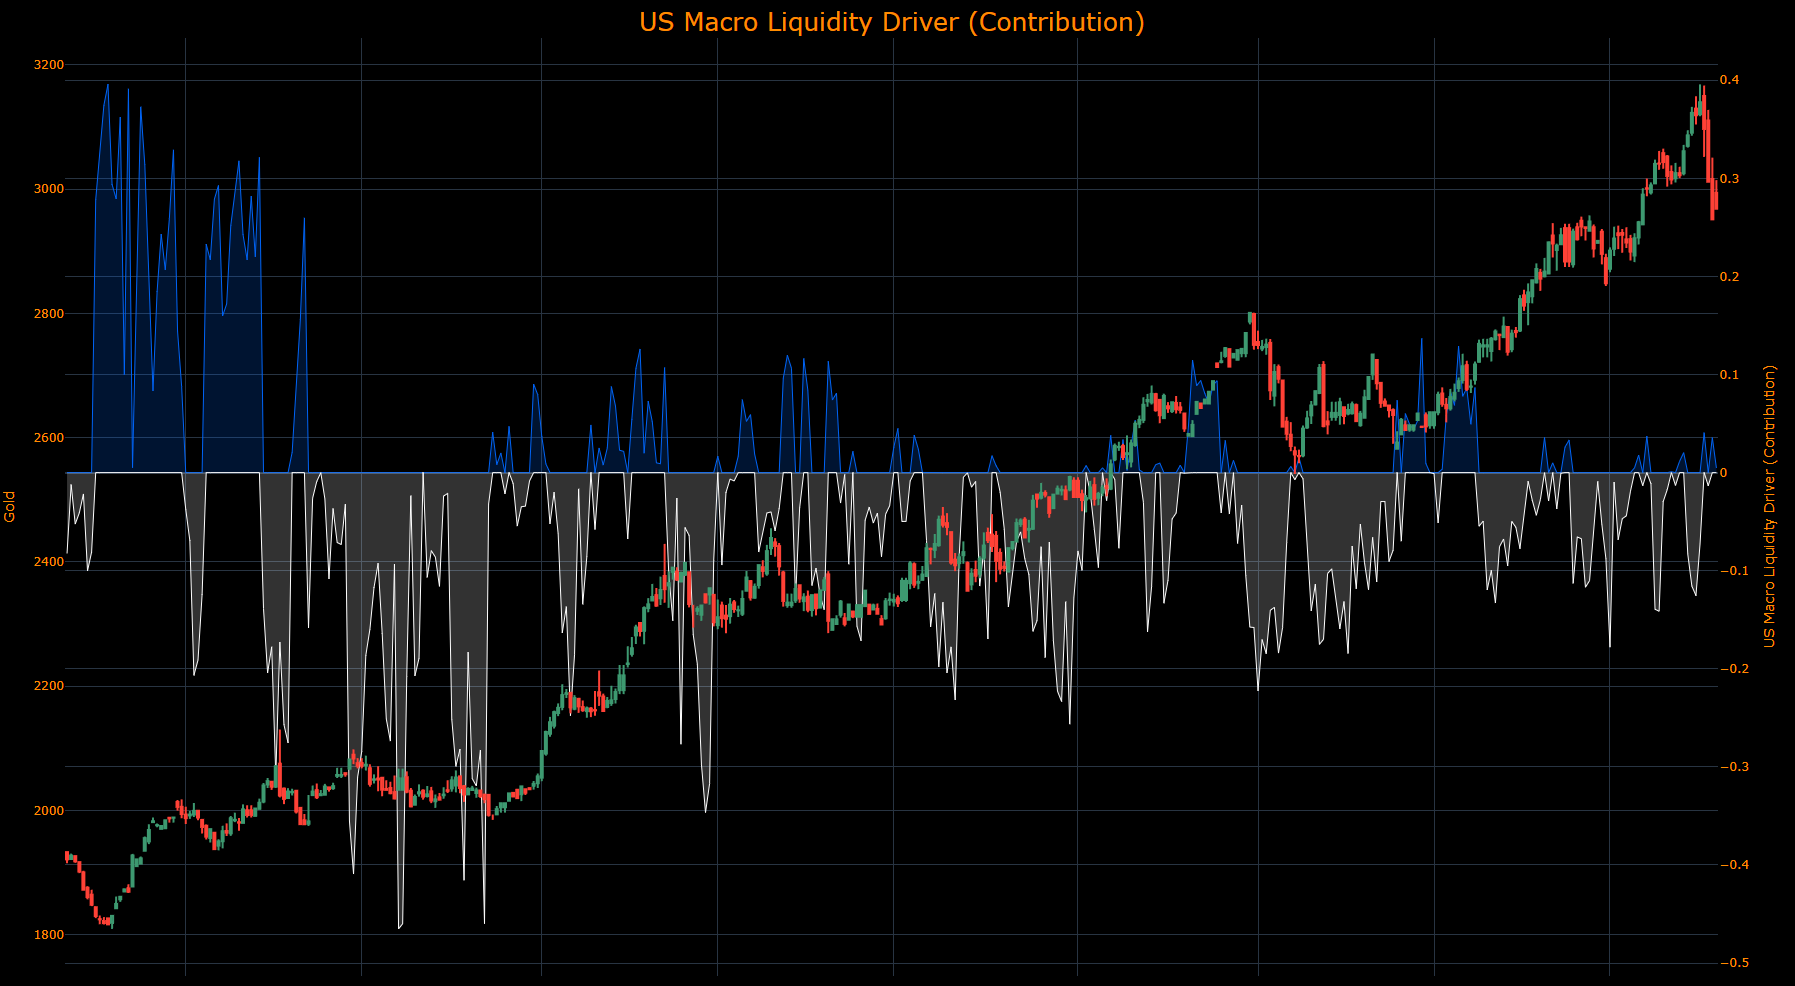
(The US Macro Liquidity Driver contribution identifies HOW the drivers of US liquidity are contributing to the returns of Gold. In the same manner, the higher the contribution moves, the more strength the drivers have in pushing gold in a specific direction.)
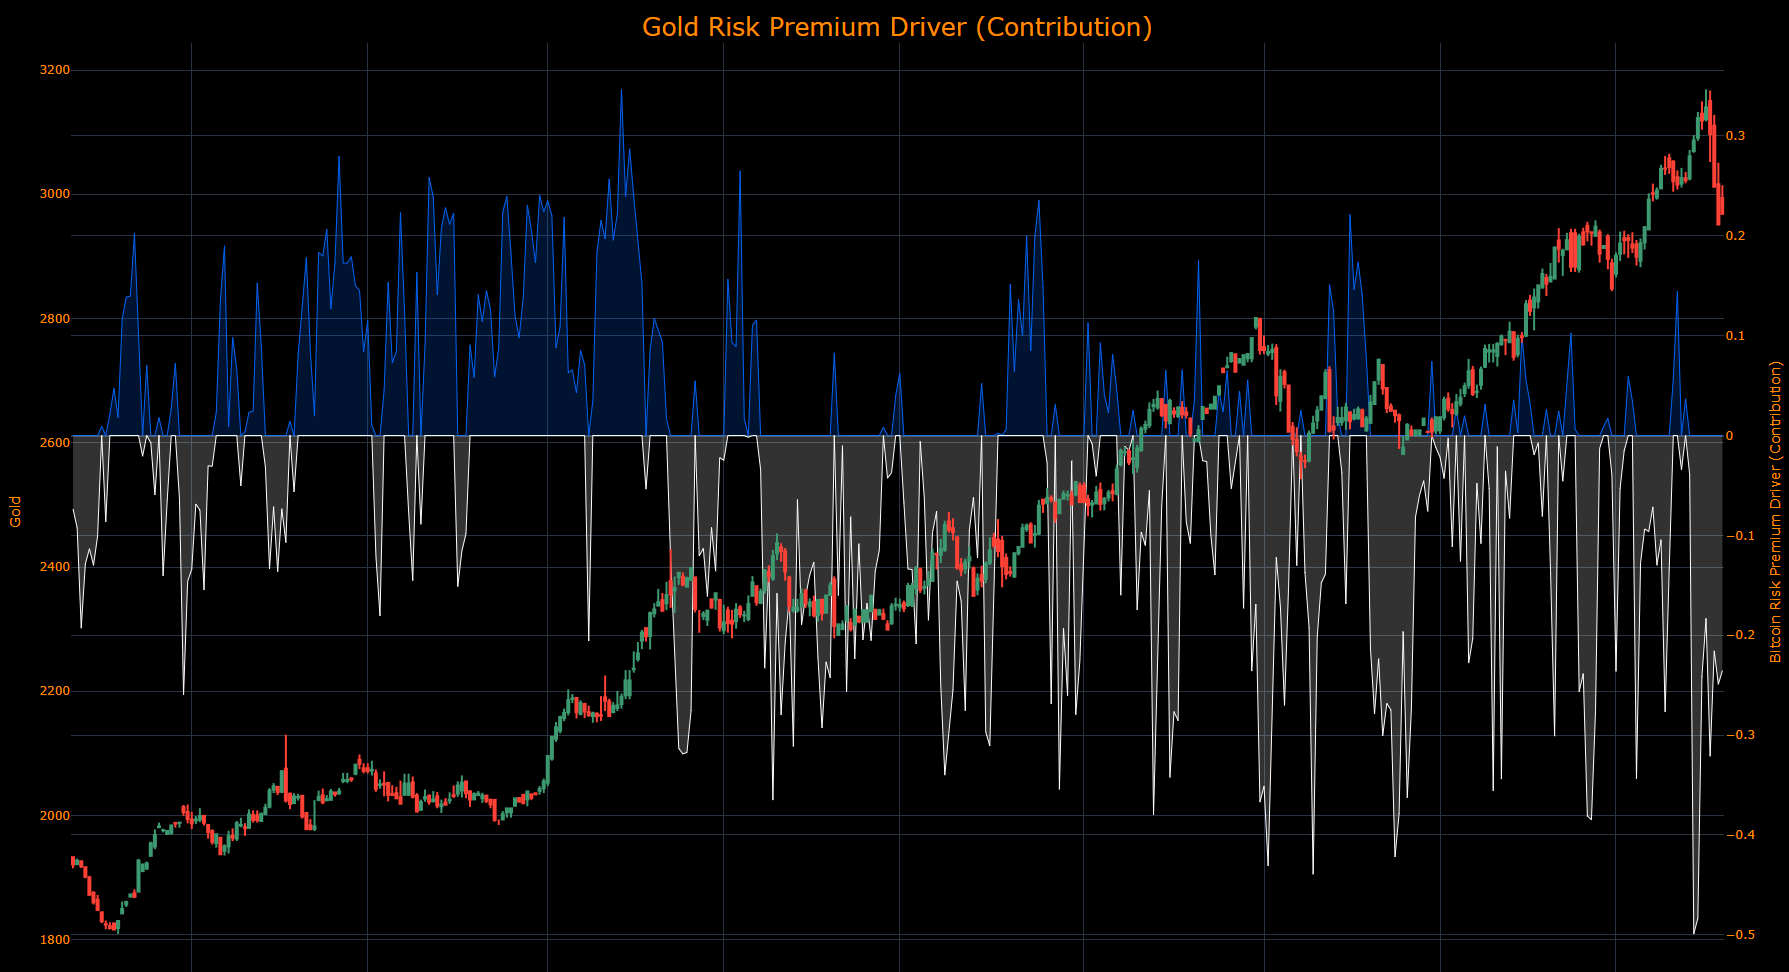
(The Gold Risk Premium Driver contribution identifies HOW the risk premium of gold is contributing to returns. In the same manner, the higher the contribution moves, the more strength the drivers have in pushing gold in a specific direction.)
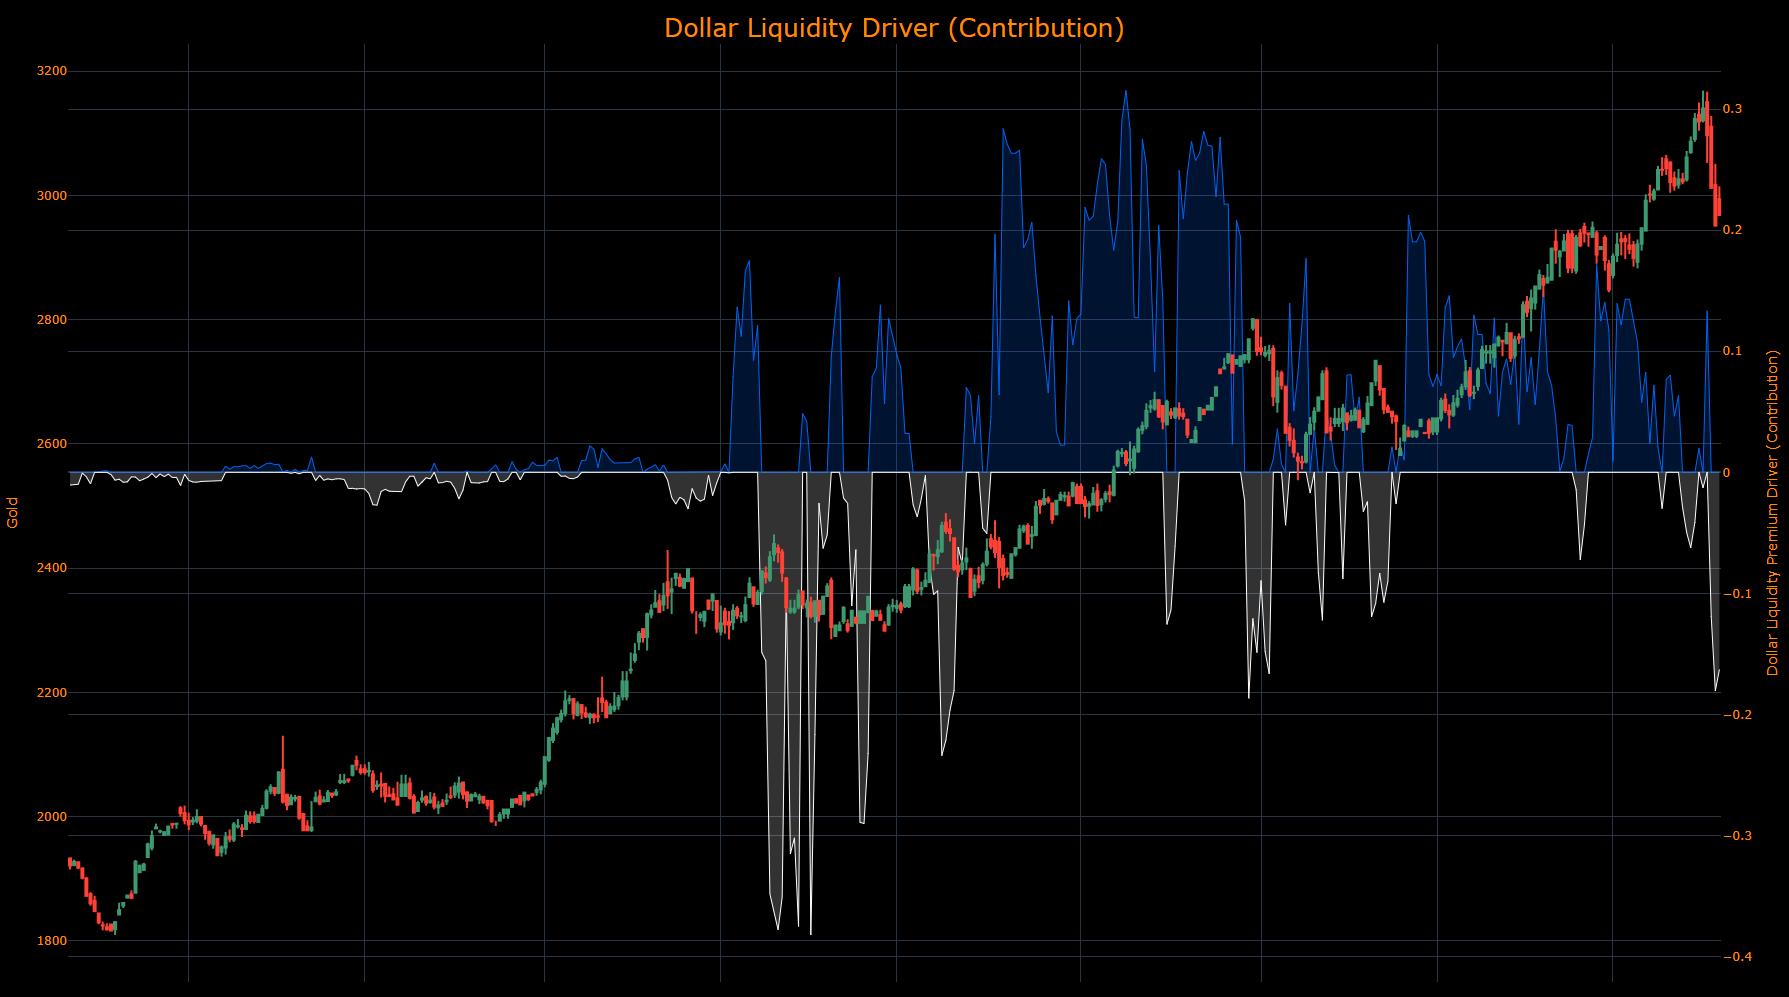
(The Dollar Liquidity Driver contribution identifies HOW the drivers of dollar liquidity are contributing to the returns of Gold. In the same manner, the higher the contribution moves, the more strength the drivers have in pushing gold in a specific direction.)
The Global Liquidity Driver contribution identifies HOW the drivers of global liquidity are contributing to the returns of Gold. In the same manner, the higher the contribution moves, the more strength the drivers have in pushing gold in a specific direction.

Bitcoin
==================================================
Technical Levels for XBTUSD Curncy
==================================================
Daily Range: 1673.42
Resistance Levels (Above Open):
------------------------------
R5: 80459.75 | Offset: +3410.69
R4: 78618.00 | Offset: +1568.94 *
R3: 78098.17 | Offset: +1049.11 *
R2: 77655.98 | Offset: +606.92 *
R1: 77075.98 | Offset: + 26.92 *
------------------------------
Open Price: 77049.06
------------------------------
Support Levels (Below Open):
------------------------------
S1: 76053.79 | Offset: -995.27 *
S2: 75611.60 | Offset: -1437.46 *
S3: 75031.60 | Offset: -2017.46
S4: 73297.74 | Offset: -3751.32
S5: 71373.73 | Offset: -5675.33
==================================================
* Denotes intraday level, likely tested
In the top panel, the total impulse of macro drivers and positioning is illustrated in its strength. The greater the strength in the move, the higher the probability and amplitude of the move that is likely to take place. The bottom panel illustrates if the skew is either bullish or bearish probability.

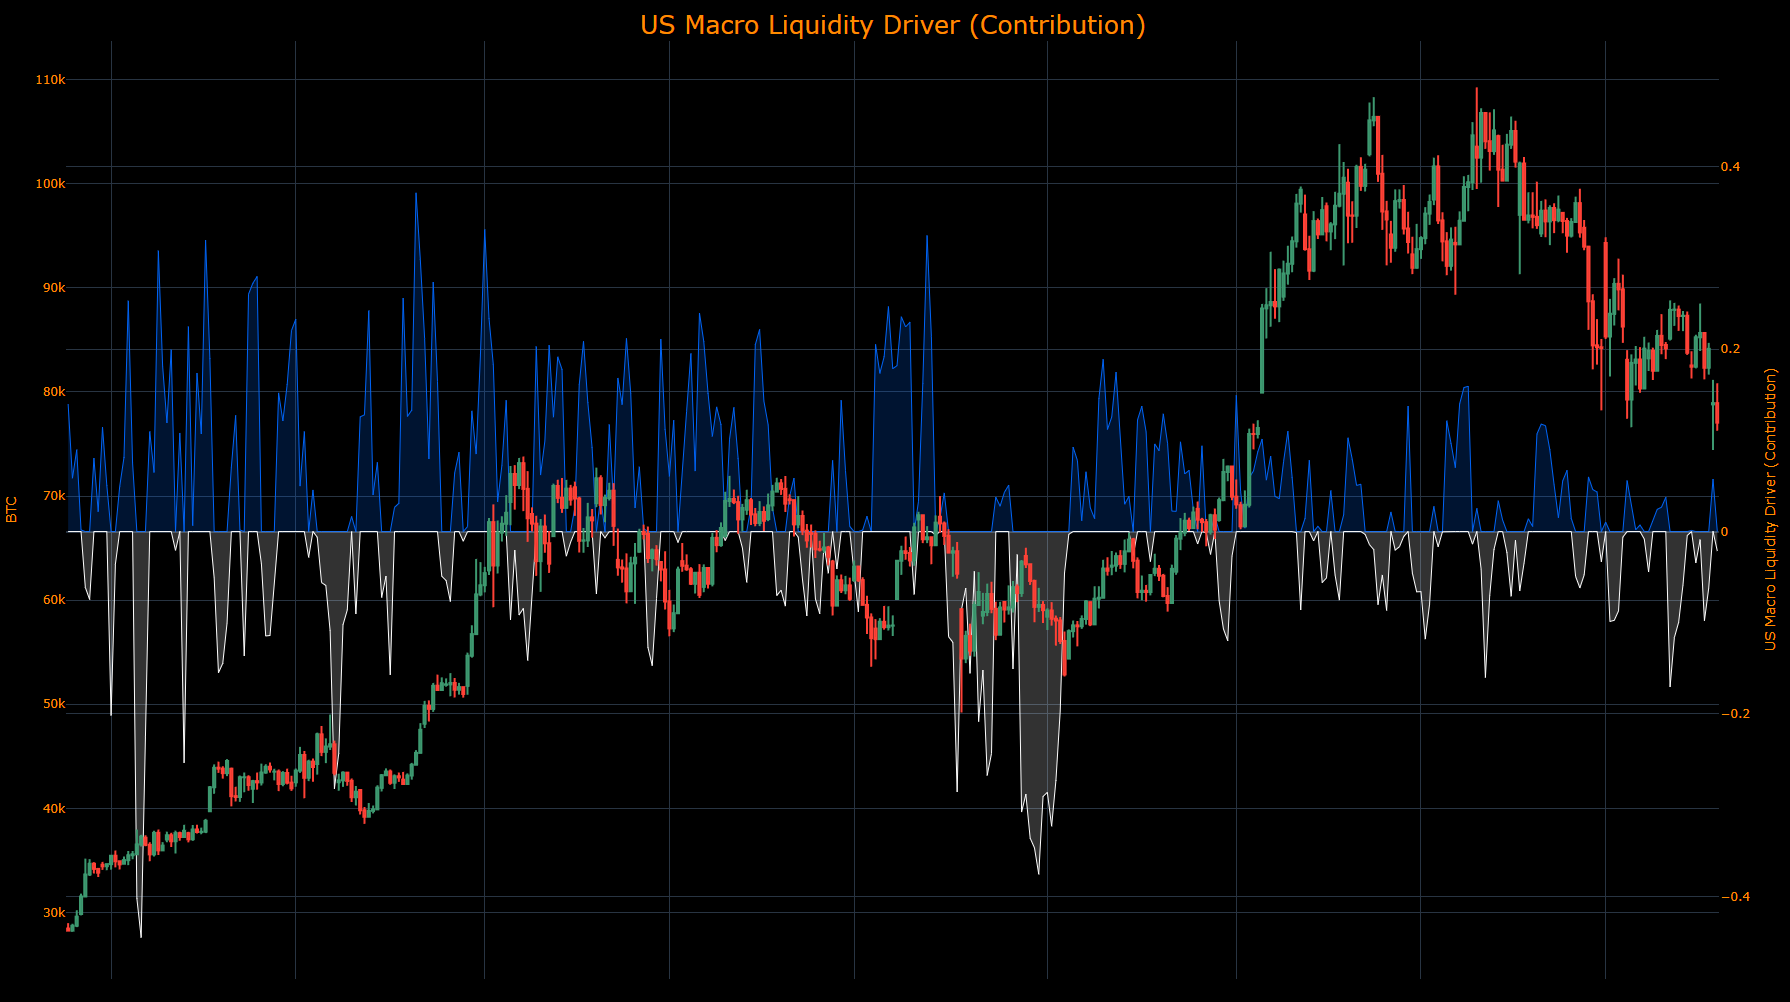
(The US Macro Liquidity Driver contribution identifies HOW the drivers of US liquidity are contributing to the returns of Bitcoin. In the same manner, the higher the contribution moves, the more strength the drivers have in pushing Bitcoin in a specific direction.)
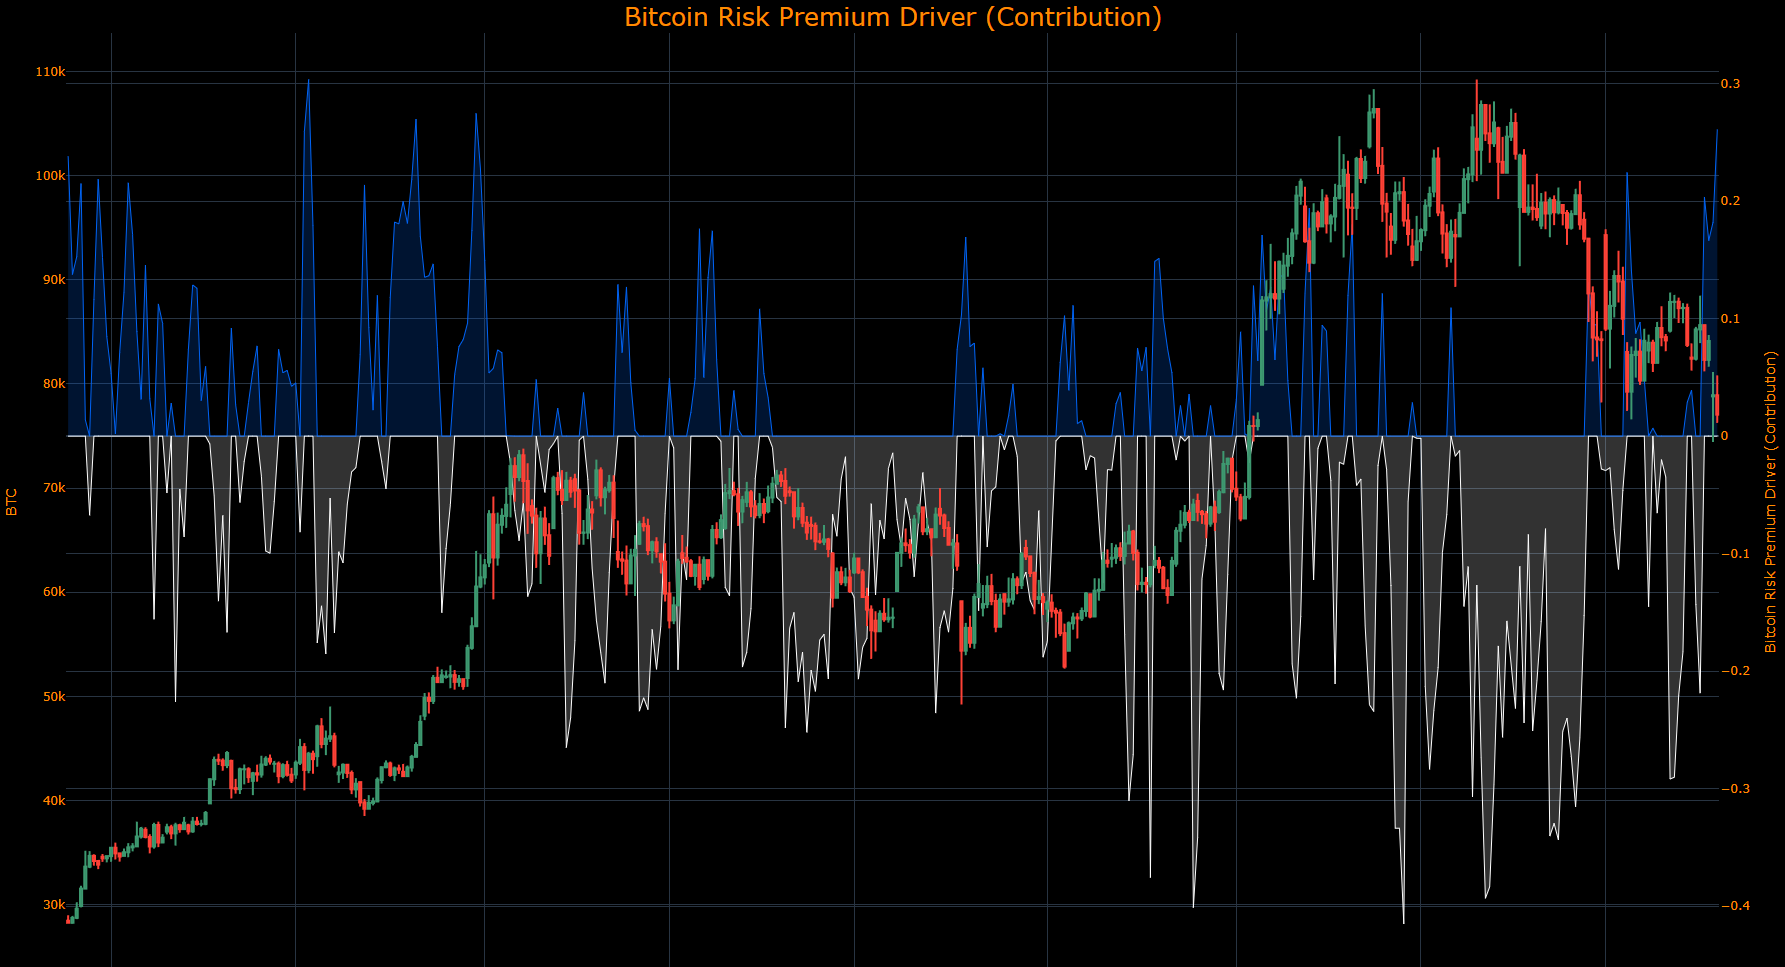
(The Bitcoin Risk Premium Driver contribution identifies HOW the risk premium of Bitcoin is contributing to returns. In the same manner, the higher the contribution moves, the more strength the drivers have in pushing the Bitcoin in a specific direction.)
(The Dollar Liquidity Driver contribution identifies HOW the drivers of dollar liquidity are contributing to the returns of Bitcoin. In the same manner, the higher the contribution moves, the more strength the drivers have in pushing Bitcoin in a specific direction.)

(The Global Liquidity Driver contribution identifies HOW the drivers of global liquidity are contributing to the returns of Bitcoin. In the same manner, the higher the contribution moves, the more strength the drivers have in pushing Bitcoin in a specific direction.)

As always, a Pepe for the culture:

The information on this website/Substack is for information purposes only. It is believed to be reliable, but Capital Flows does not warrant its completeness or accuracy. The information on the website/Substack is not intended as an offer or solicitation for the purchase of stock or any financial instrument. The information and materials contained in these pages and the terms, conditions and descriptions that appear, are subject to change without notice. Unauthorized use of Capital Flows websites and systems including but not limited to data scraping, unauthorized entry into Capital Flows systems, misuse of passwords, or misuse of any information posted on a site is strictly prohibited. Your eligibility for particular services is subject to final determination by Capital Flows and/or its affiliates. Investment services are not bank deposits or insured by the FDIC or other entity and are subject to investment risks, including possible loss of principal amount invested. Your use of any information which is proprietary to Capital Flows or a third-party information provider shall only be used on individual devices without any right to redistribute, upload, export, copy, or otherwise transfer the information to any centralized interdepartmental or shared device, directory, database or other repository nor to otherwise make it available to any other entity/person/third party, without the prior written consent of Capital Flows.
The direcitional skew is just the second derivative of the macro and positioning driver’s strengths?
I think I’m not getting how the two are related and if one can be green and the other red and why.
If you can clarify this relation it would be great thanks🙏🏻
Hello Capital Flows.
I'm looking at the images of the Total Macro and Positioning Drivers indictor on the ES chart (the indicator directly on the ES chart, not the one below) and comparing it to the same chart from yesterday and from few days ago. What I see is that the amplitude of the green-red line is changing on the same days in the past. For example Aug-Sep-Nov 2024 the amplitude of green-red line is different pretty much each day you post a new image. It's strange to see such changes on the past data. Seems like your indicator is repainting or you are curve fitting your data. How do you explain this?