Macro Regime Tracker: End of week
Macro regime and risk assets qualified clear
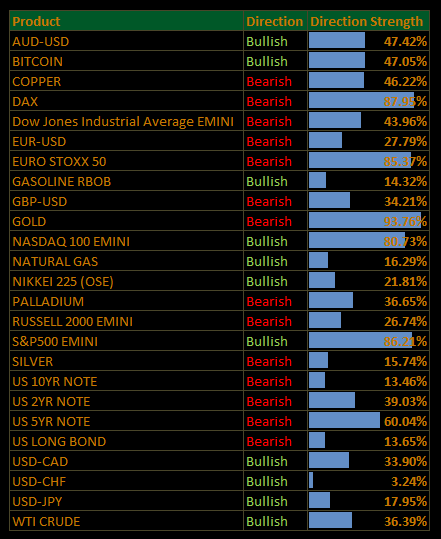
The Macro Regime Tracker offers a daily lens on how shifts in growth, inflation, and liquidity affect short-term risk and reward. Leveraging machine learning, AI, and cross-asset data, it identifies macro changes and their impact on market positioning.
Macro Regime Tracker Index:
As a reminder, you can find the full inflationary cycle playbook here:
As always, all the systematic models and strategies have been updated. Thanks
Main Developments In Macro
Federal Reserve / US Monetary Policy
MORGAN STANLEY ASKS FEDERAL RESERVE TO CUT CAPITAL REQUIREMENT
FEDERAL RESERVE ANNOUNCES UPCOMING BANK CAPITAL REQUIREMENTS
FED SAYS IT WILL PUBLISH DECISION ON MORGAN STANLEY BY SEPT. 30
DALY: CAN'T WAIT FOR PERFECT CERTAINTY WITHOUT RISKING JOB MKT
DALY: STILL THINK TARIFF-RELATED PRICE HIKES WILL BE A ONE OFF
DALY: FED'S INFLATION AND LABOR MARKET GOALS ARE IN TENSION
SAN FRANCISCO FED PRESIDENT MARY DALY COMMENTS ON LINKEDIN
FED'S DALY: IT WILL SOON BE TIME TO RECALIBRATE POLICY
COURT HEARING ENDS WITHOUT A RULING ON FED'S COOK
FED'S COOK RETAINS ACCESS TO OFFICE AND DEVICES: CNBC
TRUMP SAYS COURT SHOULD DEFER TO HIM ON `CAUSE' FOR COOK FIRING
US Macro Data
US AUG. KC FED SERVICES ACTIVITY 4
BLOOMBERG DOLLAR SPOT INDEX ERASES SESSION'S GAINS
UMICH AUG. 1-YR INFL EXPECTATIONS AT 4.8% VS PRELIM. 4.9%
UMICH FINAL AUG. CONSUMER SENTIMENT FALLS TO 58.2; EST 58.6
MICHIGAN 5-10 YR INFL EXPECTATIONS AT 3.5% VS PRELIM. 3.9%
US AUG. MNI CHICAGO REPORT BUSINESS INDEX AT 41.5; EST 46.0
US JULY PCE PRICE INDEX RISES 0.2% M/M; EST. +0.2%
US JULY PERSONAL INCOME RISES 0.4% M/M; EST. +0.4%
US JULY PERSONAL SPENDING RISES 0.5% M/M; EST. +0.5%
US JULY CORE PCE PRICE INDEX RISES 0.3% M/M; EST. +0.3%
US Energy / Trade / Fiscal
US OIL RIG COUNT DOWN 1 TO 412 , BAKER HUGHES SAYS
US GAS RIG COUNT DOWN 3 TO 119 , BAKER HUGHES SAYS
US TOTAL RIG COUNT 536 , BAKER HUGHES SAYS
USTR SPOTLIGHTING CHINA’S NON-MARKET POLICIES IN TEXTILE SECTOR
US TO CURB SOME INTEL, SAMSUNG, SK HYNIX CHINA AUTHORIZATIONS
US ENDS DUTY-FREE TREATMENT OF SMALL-VALUE PACKAGES WORLDWIDE
TRUMP CANCELS NEARLY $5B IN FOREIGN AID: OMB
US Politics / Policy
ADMIN PLANS IMMIGRATION ENFORCEMENT BLITZ IN BOSTON: POLITICO
ERNST TO ANNOUNCE DECISION NOT TO SEEK REELECTION THURS: CBS
CORRECT: ERNST WON'T SEEK REELECTION TO SENATE IN 2026: CBS
JONI ERNST WON'T SEEK REELECTION TO SENATE IN 2026: CBS
Macro Tear Sheets: Equities, Stock/Bond Correlation, Fixed Income, FX, Crypto, and Commodities
Macro Regime Dashboard: Excel spreadsheet for economic data, interest rates, and real estate.
Momentum and Mean Reversion Models: Equities, Commodities, Fixed Income, and Currencies
You can find the educational primer and video explanation of these models here: LINK
Growth, Inflation, Fixed Income, Credit, and Equities Regime Tracker
The Macro Regime Model offers a real-time view of growth, inflation, and yield curve dynamics, integrating these with credit market shifts, equity risk premiums, and positioning data. It connects upcoming catalysts to statistical drivers of asset prices, creating a unified framework that quantifies skew and clarifies risk-reward across asset classes.
Key Points To Set The Context:
US Market Wrap: Tech Rout Drags S&P Lower; Resilient Consumer vs. September Seasonals (S&P −0.42%)
Equities slipped into the weekend as tech weakness weighed on the tape, with Nvidia and AI-adjacent names leading declines. The S&P 500 fell −0.42% (Nasdaq 100 −1.3%), a move framed less by new macro shocks and more by positioning: month-end, seasonals, and profit-taking after record highs. Despite the pullback, the index remains on track for a fourth consecutive monthly gain as traders lean into a September Fed cut.
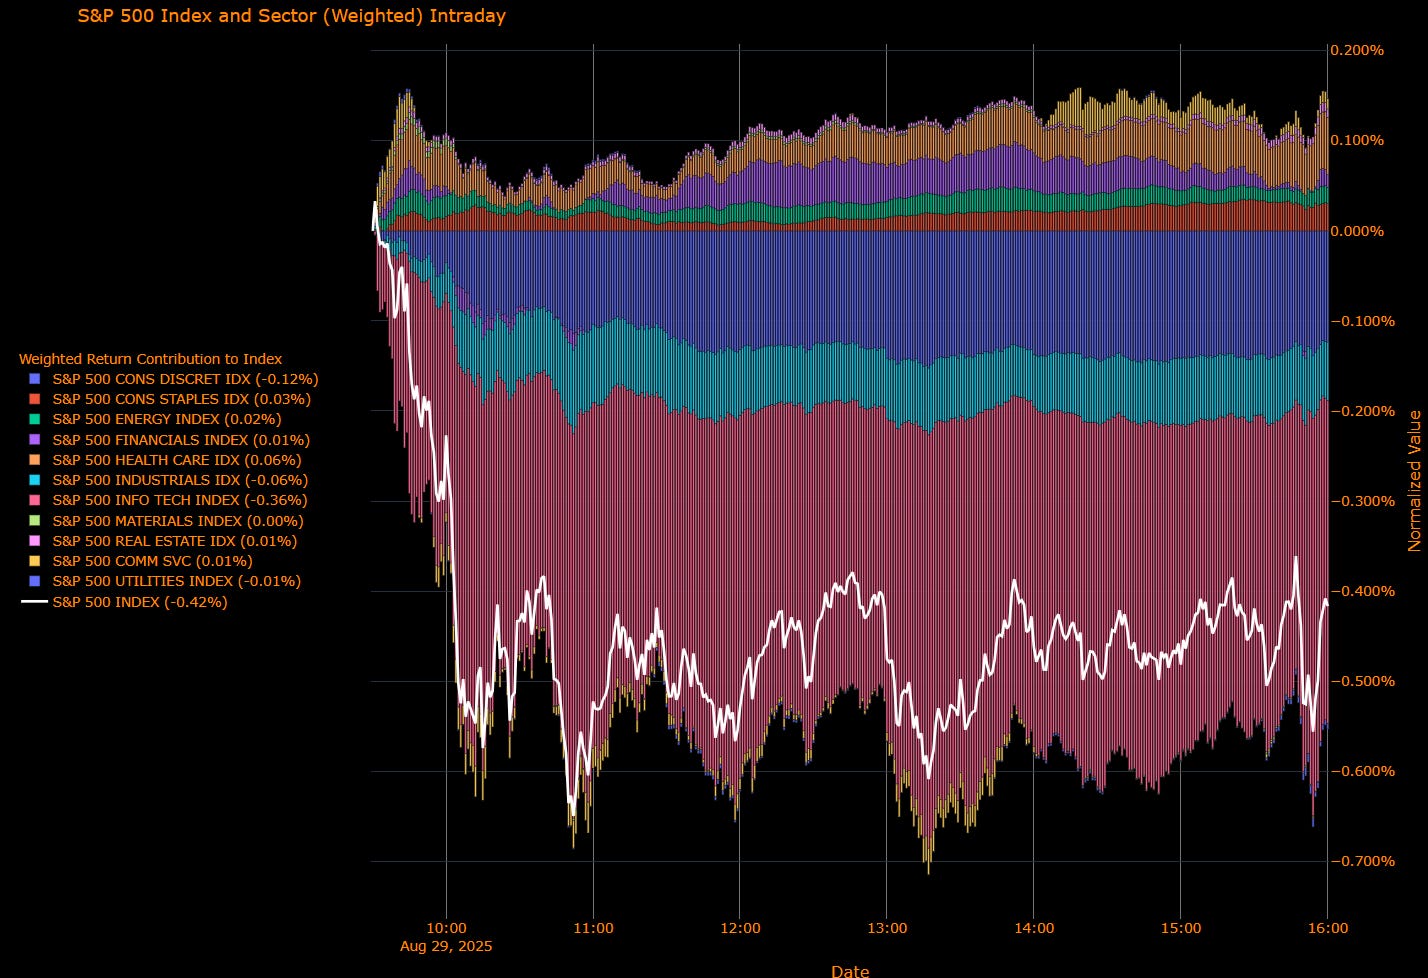
Sector Contribution (weighted to index move)
Detractors: Information Technology (−0.36%), Consumer Discretionary (−0.12%), Industrials (−0.06%).
Offsets: Health Care (+0.06%), Consumer Staples (+0.03%), Energy (+0.02%), Financials (+0.01%), Real Estate (+0.01%), Communication Services (+0.01%).
Index: S&P 500 (−0.42%).
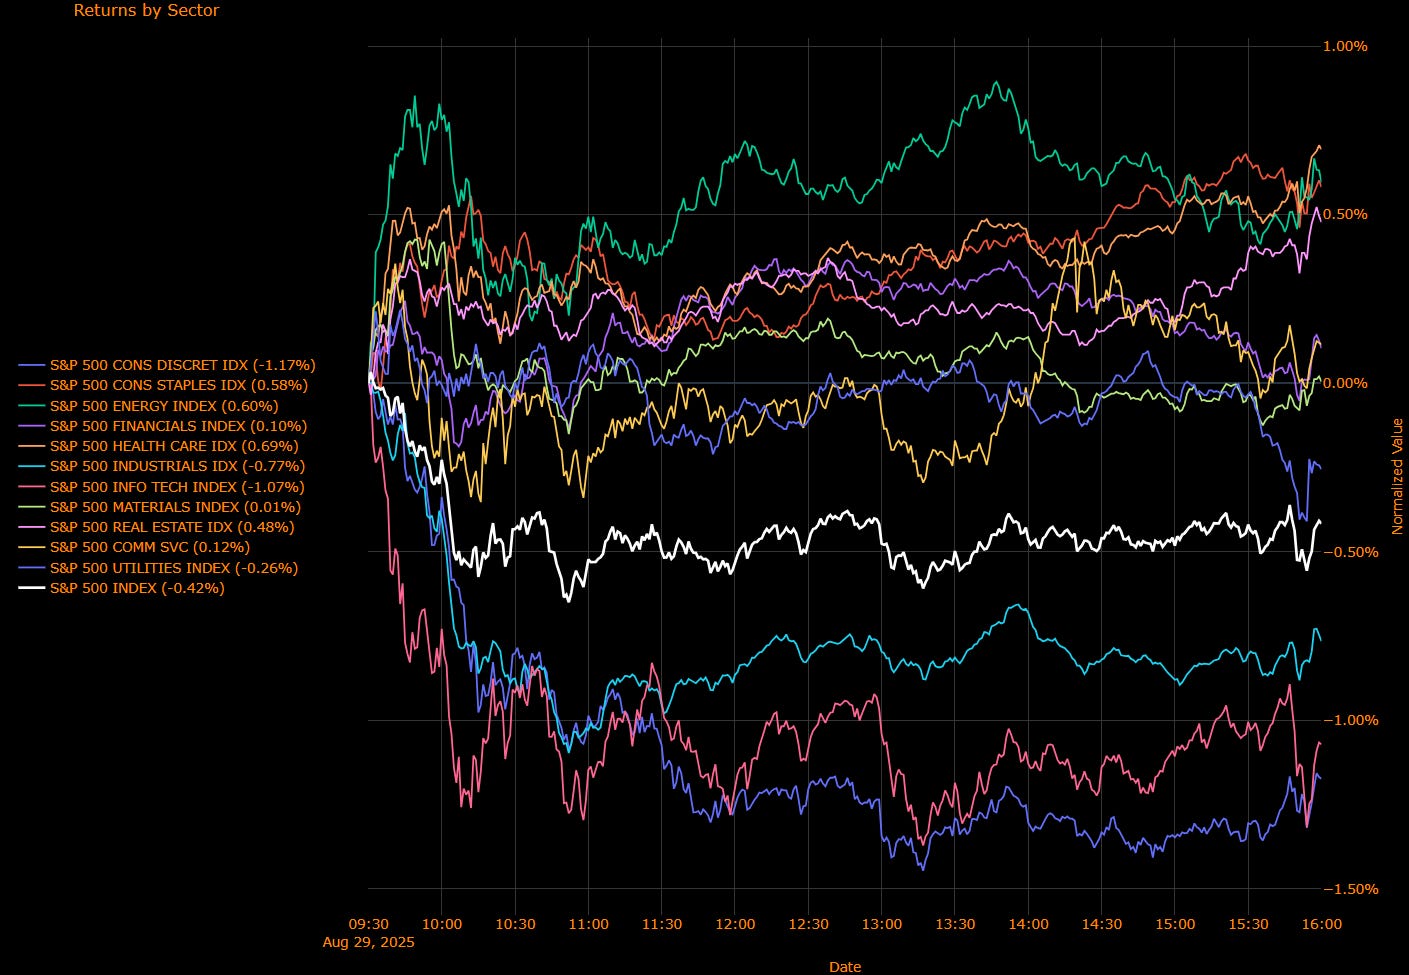
Sector Performance (unweighted breadth)
Leaders: Energy (+0.60%), Health Care (+0.69%), Consumer Staples (+0.58%), Real Estate (+0.48%).
Laggards: Information Technology (−1.07%), Consumer Discretionary (−1.17%), Industrials (−0.77%), Utilities (−0.26%).
Index: S&P 500 (−0.42%).
Macro Overlay
Consumer pulse: July PCE landed in line (headline +0.2% m/m, core +0.3% m/m, +2.9% y/y), reinforcing resilience in demand even as inflation edges higher. Real personal spending (+0.3%) underscored that households are still spending through tariff-driven price pressures, though University of Michigan sentiment fell to 58.2, a three-month low.
Rates & FX: Treasuries were little changed (2-yr −1 bp to 3.62%, 10-yr +2 bp to 4.22%), the dollar flat into month-end. Market pricing still embeds two cuts this year, with September as the base case barring a blowout NFP next Friday.
Seasonals: The weakest month of the year for equities looms. As corporate buybacks fade and retail flow cools, volatility historically picks up. Traders are alert to how seasonal de-risking interacts with a still-intact “Fed pivot” narrative.
Micro tells: Tech weakness was broad (semis, AI servers, software) while defensives and energy offered ballast. The split between weighted contribution (Tech’s drag dominating) and unweighted breadth (Energy, Staples, Health Care positive) highlights the market’s ongoing reliance on mega-cap leadership—and the risks when it falters.
Overall…
The index’s −0.42% slide says more about seasonal positioning and tech leadership fragility than about a fundamental macro shift. Core PCE kept the September cut live, but tariffs and service inflation complicate the Fed’s optics. Next week’s jobs report is the swing factor: a soft print would cement September easing, while any upside surprise could jar the “buy the dip” reflex. Into September, expect macro resilience vs. seasonal headwinds to define the tape.
US IG Credit Wrap: Tech Drag in Equities, OAS Holds Low-50s; Seasonals Meet September Fed Cut Odds (S&P −0.42%)
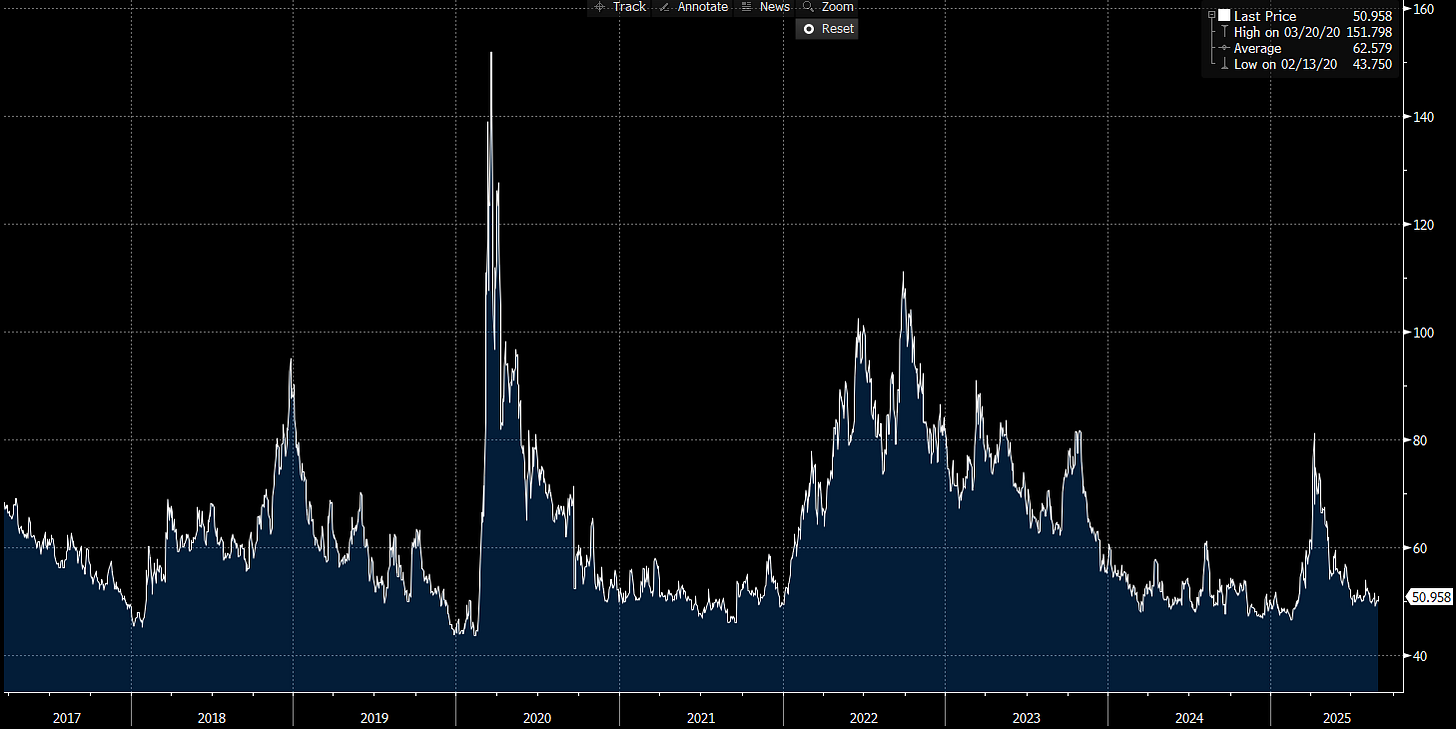
IG OAS: 50.96 bp • 5-yr avg: 62.58 bp (≈12 bp inside) • Cycle low: 43.75 bp (7.2 bp off tights) • COVID high: 151.80 bp (~101 bp tighter)
Credit spreads were steady, with IG OAS glued to the low-50s even as equities sagged on a tech-led pullback. The spread backdrop remains carry-constructive, with rates and equities absorbing the volatility instead. Treasuries saw mild curve flattening (2-yr −1 bp to 3.62%, 10-yr +2 bp to 4.22%), the dollar was flat, and gold gained modestly. The message: credit is happy to sit still while beta assets digest seasonal headwinds.
Credit Context
< 60 bp: Duration-friendly, carry-positive zone for insurers, pensions, and liability-driven buyers.
60–70 bp: Macro noise threshold, where volatility or inflation threats prompt positioning cuts.
> 90 bp: Systemic stress unlikely unless global macro or geopolitical shocks return.
What to Watch
September payrolls: Sub-60k would cement a cut, giving spreads a tailwind; upside surprise could test carry at the margin.
Curve signals: 5s30s/2s10s slope behavior matters more for IG returns than the 1–2 bp day-to-day in OAS.
Seasonals: Equities enter the weakest month of the year; any volatility spillover is the real test of whether low-50s OAS is “sticky” or vulnerable.
Tariff pass-through: Watch corporate commentary on margin compression—early signs from Caterpillar, Dell, and Marvell show costs are rising but not yet translating into credit stress.
The Final Word
IG spreads remain remarkably insulated, holding near five-year tights even as equities wobble and rates chop. With carry still compelling, the market is in a “don’t overthink it” mode: ride the grind until labor cracks, or tariffs force a repricing. Into September, the main swing factor is not spreads themselves but whether equity volatility + macro seasonals spill over. So far, IG credit is calling the bluff.
Mag7 Model:
See the intro published for how to use the Mag7 models here: Link
Capital Flows Interest Rate Sensitivity Model:
All of the interest rate sensitivity models are now reserved exclusively for paid subscribers. If you would like to do a free trial, you can with this LINK.
Launch video for these models is here: LINK
Equity Indices:
Keep reading with a 7-day free trial
Subscribe to Capital Flows to keep reading this post and get 7 days of free access to the full post archives.


