

Macro Regime Tracker: The BTC Melt UP
Macro regime and risk assets qualified clearly

The Macro Regime Tracker offers a daily lens on how shifts in growth, inflation, and liquidity affect short-term risk and reward. Leveraging machine learning, AI, and cross-asset data, it identifies macro changes and their impact on market positioning.
Macro Regime Tracker Index:
Macro Regime Context
Macro Tear Sheets: Equities, Fixed Income, FX, Crypto, and Commodities
Macro Regime Dashboard: Excel spreadsheet for economic data and interest rates
Growth, Inflation, Fixed Income, Credit, and Equities Regime Tracker
AI and Machine Learning Strategies - Macro Regime and Positioning Premiums Strategies: S&P 500, 2-Year Interest Rates, Gold, and Bitcoin
Macro Regime Context:
We are seeing Bitcoin melt up in lockstep with the macro regime I have been laying out (link):

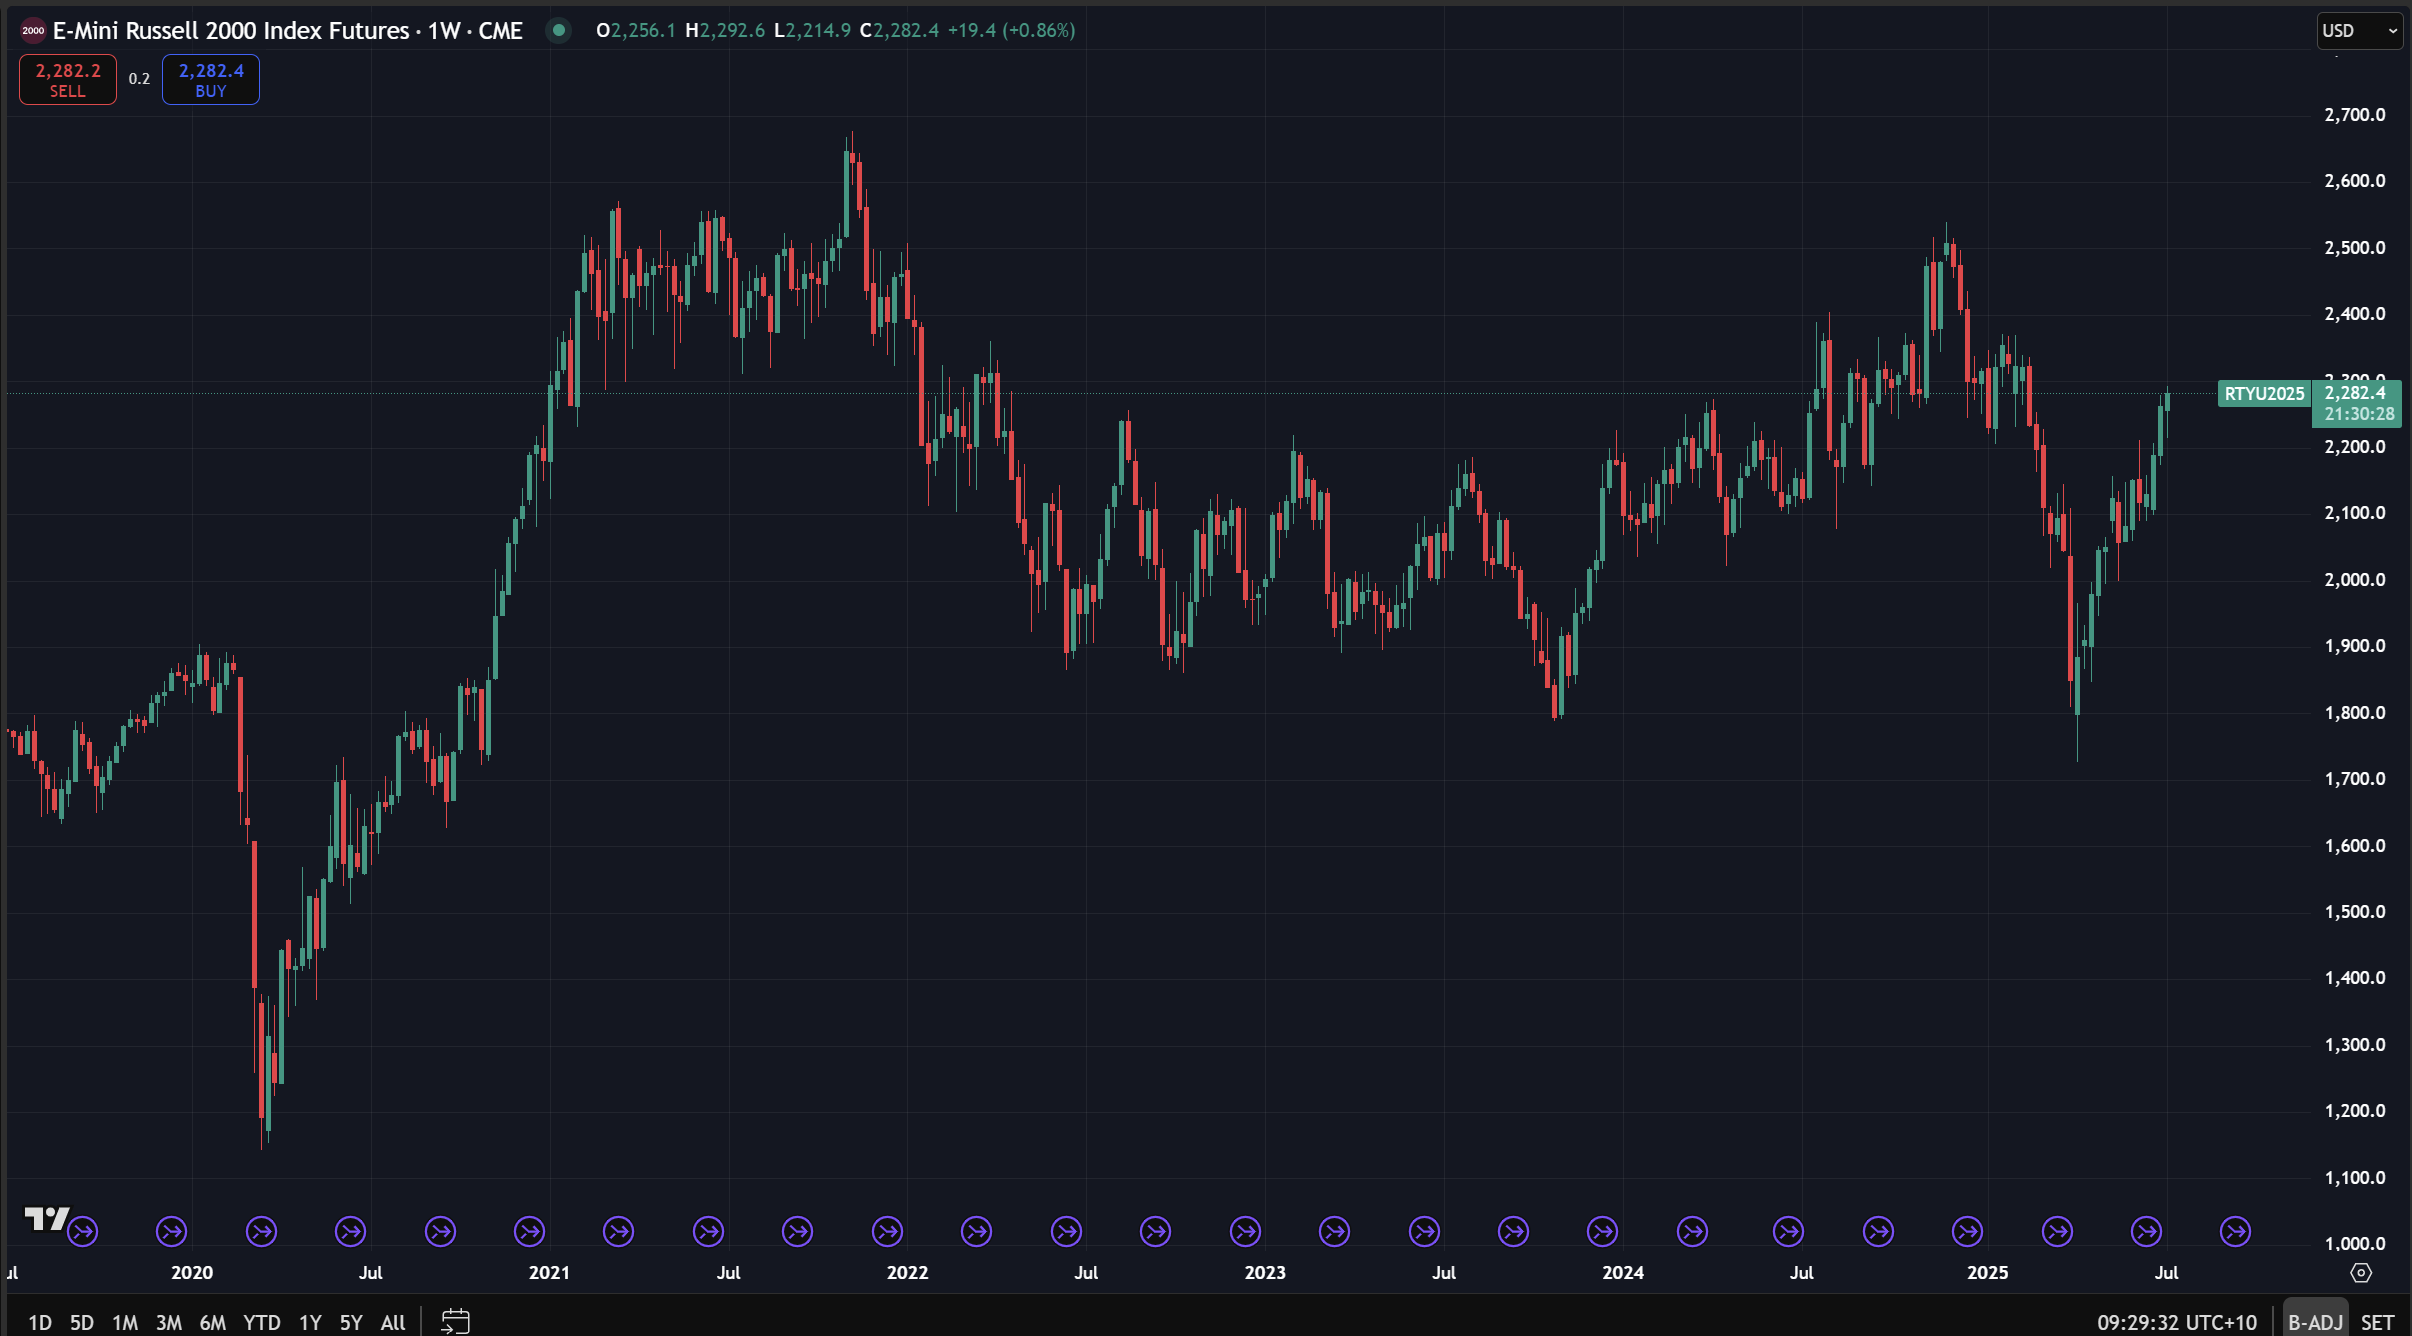
And the Russell continues to rally as well with significant momentum, which is an indication of how strong underlying growth is:
Here is what I want to emphasize: the rise in risk assets has been a function of growth and liquidity rising. As risk assets melt up, everyone who happened to buy the asset and made a lot of money begin floating narratives about WHY they were right. You can have someone who bought Bitcoin based on a lunar cycle show you their gains, and people will start believing them simply because they made money. This turns into a crowd mentality, and many times, the entire financial industry will ride a trend that is justified intellectually as long as the price goes higher and higher.
We are going so far that new products are popping up to cross-collateralize more and more products together, like connecting your mortgage to a Bitcoin holding. There can be a place for any financial product, but the true test of a strategy is not during a period of enthusiasm but during a period of chaos and turmoil.
To be clear, the macro regime and all of the signals I run in my models are still flashing green on the melt up in risk assets and risk to the bond market. However, being a clear thinker during periods of extreme FOMO (on the upside and downside) is the greatest skill in financial markets.
As a result, I will be putting together a video and a playbook breakdown for HOW to interpret the moves in the S&P500 and Bitcoin. This will provide more clarity into HOW to think about Bitcoin and WHERE we are going.
All of the systematic models for assets are laid out below. More on this tomorrow.
Main Developments In Macro
US Monetary Policy & Fed Commentary
WALLER: FED IS TOO TIGHT AND CAN CONSIDER CUTTING IN JULY
WALLER: CURRENT POLICY RATE STILL 'PRETTY RESTRICTIVE'
WALLER: MY VIEW ON RATES IS 'NOT POLITICAL'
WALLER REPEATS FED SHOULD LOOK THROUGH TARIFF PRICE IMPACT
DALY: SEE TWO CUTS IN 2025 AS LIKELY OUTCOME
DALY: BELIEVE WE'RE ON SUSTAINABLE PATH DOWN TO 2% INFLATION
DALY: CONSUMERS SLOWING, NOT STOPPING SPENDING
DALY: IMPORTERS, RETAILERS ABSORBING SOME OF THE TARIFFS
DALY: POSSIBLE TARIFFS DON'T DRIVE BIG CONSUMER PRICE INCREASES
DALY: DON'T SEE EVIDENCE OF PERSISTENT TARIFF IMPACT ON PRICES
FED'S MUSALEM: US FISCAL DEFICITS ARE ON AN UNSUSTAINABLE PATH
FED'S MUSALEM: POLICY WELL-POSITIONED TO RESPOND TO LABOR WEAKNESS
FED'S MUSALEM: LABOR SUPPLY SEEMS TO BE DECLINING
FED'S MUSALEM: EFFECTIVE TARIFF RATE MAY SETTLE IN TEENS OR 20S
FED'S MUSALEM: FORECAST IS FOR INFLATION TO INCREASE ON TARIFFS
FED'S MUSALEM: HAD POSITIVE INFLATION TRENDS LAST THREE MONTHS
FED'S MUSALEM: FINANCIAL CONDITIONS ARE SUPPORTIVE OF GROWTH
FED'S MUSALEM: ECONOMY IN GOOD PLACE AT OR NEAR FULL EMPLOYMENT
FED'S MUSALEM: TARIFFS COULD TAKE UNTIL NEXT YEAR TO WORK THROUGH
FED'S MUSALEM: HIGH PROFIT MARGINS GIVE SOME ROOM TO ABSORB TARIFFS
FED'S MUSALEM: TARIFFS MAY HAVE TEMPORARY OR PERSISTENT PRICE IMPACT
FED'S MUSALEM: LONG-TERM INFLATION EXPECTATIONS ARE ANCHORED
FED'S MUSALEM: THERE ARE SOME UPSIDE RISKS TO INFLATION
TRUMP: FED SHOULD RAPIDLY LOWER RATE
US Trade Policy & Tariff Impact
HASSETT: 'DISAPPOINTING' FED HAS NOT PUBLISHED MODEL ON TARIFFS
HASSETT: FED HASN'T EXPLAINED REASONS FOR POLICY ERRORS
HASSETT: FED MUST EXPLAIN WHERE ITS POSITIONS COME FROM
DIMON: `TOTALLY IMPOSSIBLE TO READ' WHAT DATA SHOWS ON ECONOMY
DIMON: TARIFFS, IMMIGRATION POLICY, DEFICITS ARE INFLATIONARY
MUSALEM: EXPECT TARIFFS TO HIT INFLATION BEGINNING IN JUNE DATA
MUSALEM: DOLLAR DEPRECIATION COULD CONTRIBUTE TO INFLATION
Fiscal Policy & Structural Concerns
FED'S MUSALEM: US FISCAL DEFICITS ARE ON AN UNSUSTAINABLE PATH
MUSALEM: US DEFICIT COULD BE FINANCIAL STABILITY RISK IN FUTURE
Relevant Geopolitics with US Macro Implications
US APPROVES SHIPMENT OF FRESH WEAPONS BATCH TO UKRAINE: REUTERS
ZELENSKIY: DATES ARE SET FOR FUTURE US WEAPON DELIVERIES
ZELENSKIY: WE ARE VERY CLOSE TO ANOTHER ROUND OF SANCTIONS
ISRAEL: GIVING 60 DAYS FOR US DIPLOMACY TO REMOVE IRAN THREAT
NYT CITES SENIOR ISRAELI OFFICIAL ON IRAN ENRICHED URANIUM
SOME OF IRAN’S ENRICHED URANIUM SURVIVED ATTACKS: NYT
EU WEIGHS SUSPENDING ISRAEL TIES OVER GAZA CRISIS: POLITICO
OPEC+ DISCUSSES PAUSING OUTPUT HIKES FROM OCTOBER: DELEGATES
Macro Tear Sheets: Equities, Stock/Bond Correlation, Fixed Income, FX, Crypto, and Commodities
Macro Regime Dashboard: Excel spreadsheet for economic data, interest rates, and real estate.
Momentum and Mean Reversion Models: Equities, Commodities, Fixed Income, and Currencies
You can find the educational primer and video explanation of these models here: LINK
Here is a summary of all models and their directional strengths:

Growth, Inflation, Fixed Income, Credit, and Equities Regime Tracker
The Macro Regime Model offers a real-time view of growth, inflation, and yield curve dynamics, integrating these with credit market shifts, equity risk premiums, and positioning data. It connects upcoming catalysts to statistical drivers of asset prices, creating a unified framework that quantifies skew and clarifies risk-reward across asset classes.
Key Points To Set The Context:
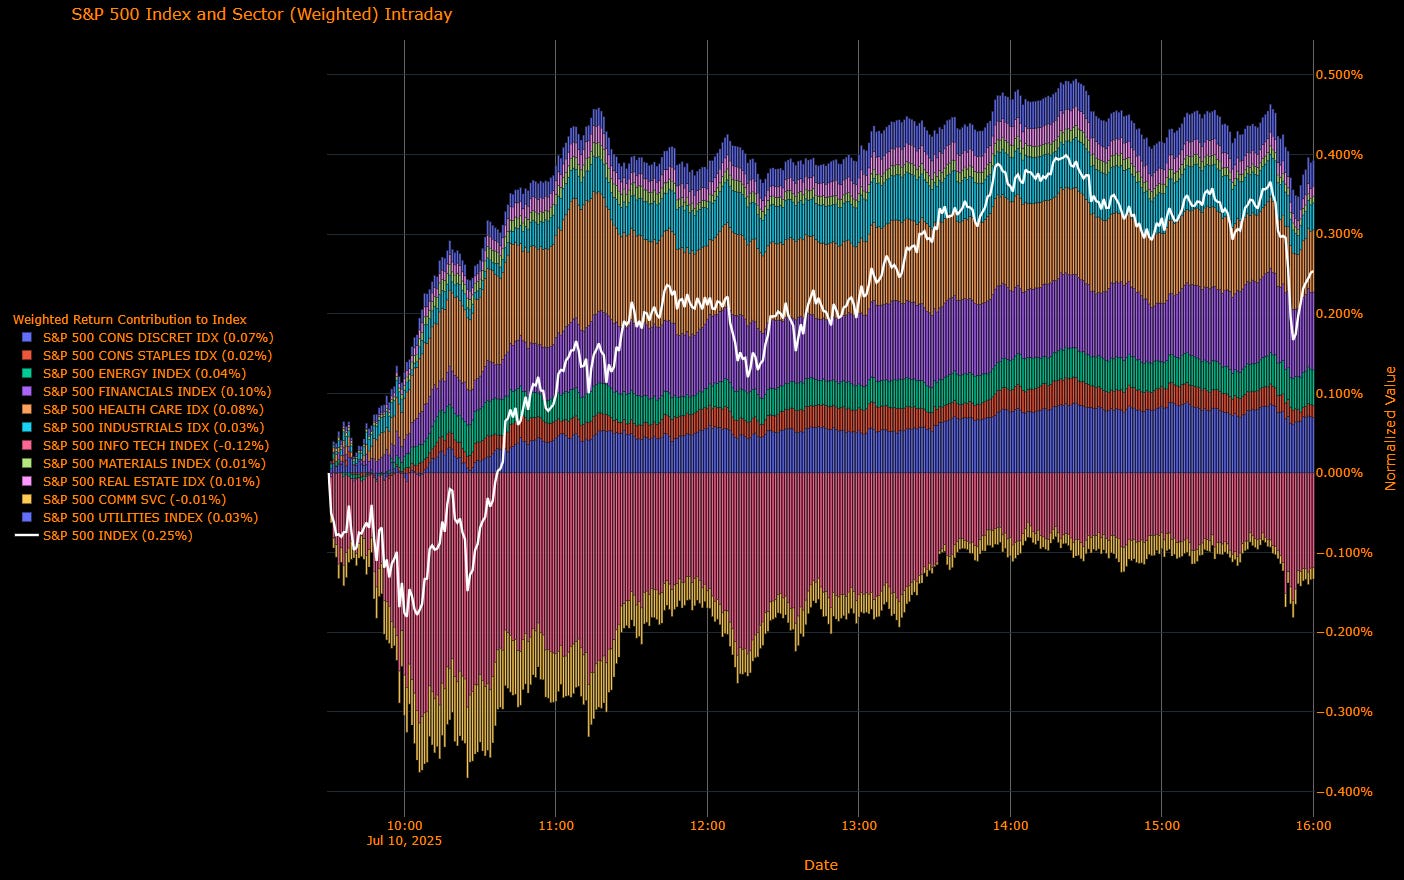
S&P 500 Advances 0.25% as Rotation Shifts Toward Energy, Utilities, and Financials Ahead of Earnings Kickoff
The S&P 500 climbed another 0.25% Thursday to notch a fresh all-time high, powered by rotation into previously lagging sectors such as energy and utilities, while tech lagged following a stretch of outperformance. Markets found reassurance in a well-received 30-year Treasury auction, stabilizing yields and fueling appetite for equity duration especially in cyclical and rate-sensitive areas. Tariff anxieties linger, but the spotlight is increasingly shifting to Q2 earnings, where the bar remains low and the potential for upside surprises is high.
Sector Contribution Breakdown (Weighted Return to Index)
Financials (+0.10 pp) – Strongest contributor to index gains, with banks lifted by curve stability and upbeat guidance from Delta offering a read-through on consumer resilience.
Health Care (+0.08 pp) – Pharma and managed care names extended their steady climb on defensive demand and earnings stability.
Consumer Discretionary (+0.07 pp) – Retail and travel names surged, aided by Tesla optimism and holiday spend carry-through.
Energy (+0.04 pp) – Crude prices cooled, but momentum continued as the sector plays catch-up in July’s rotation.
Industrials (+0.03 pp) – Lifted by Delta and capital goods ahead of earnings; infrastructure-linked plays also firmed.
Utilities (+0.03 pp) – Yield-sensitive names held up well as the 10-year yield only ticked up slightly.
Consumer Staples (+0.02 pp) – Modest support from food and beverage stocks despite rising cost concerns.
Materials, Real Estate (Flat to +0.01 pp) – Steady but uninspiring, lacking catalysts.
Communication Services (–0.01 pp) – Minor pullback amid valuation concerns in streaming and platforms.
Information Technology (–0.12 pp) – The only real drag, as mega-cap tech cooled after Nvidia's $4 trillion milestone.
Sector Performance Breakdown (Unweighted Index Returns)
Energy (+1.45%) – Clear standout as value rotation deepens; July's top-performing sector as of now.
Utilities (+1.35%) – Defensive flows remain intact, helped by stabilizing yields and low-beta appetite.
Health Care (+0.84%) – Broad gains in biotech and pharma drove sector strength.
Financials (+0.70%), Discretionary (+0.67%), Real Estate (+0.62%) – Beneficiaries of improving sentiment and rate stabilization.
Materials (+0.43%), Industrials (+0.39%), Staples (+0.28%) – Benefited from earnings optimism and stabilizing macro tone.
Tech (–0.36%), Comm Services (–0.15%) – Tech cooled; Comm Services extended recent weakness.
Macro Overlay: Yield Calm, Rotation Heats Up, Eyes on Earnings
1. Treasuries Find Demand Despite Supply Wall
Thursday’s 30-year auction was awarded smoothly, anchoring the back end of the curve and reinforcing demand for duration. This helped equities weather a mild rise in 10-year yields (to 4.34%) and revived demand for sectors like utilities and REITs.
2. Tariff Concerns Simmer, but No Shock Yet
Despite President Trump’s continued tariff pressure and Jamie Dimon’s warnings about market complacency, equities appear immune for now. Investors are treating the August 1 deadline as soft, with negotiations ongoing and no new disruptions priced in.
3. Earnings Season: Low Bar, Big Opportunity
With the S&P 500 approaching 6,300 and sentiment high, Q2 earnings season carries the burden of validation. Expectations are for just 2% EPS growth, making even modest beats meaningful. Delta’s strong guidance helped set the tone. Investors will focus on whether breadth improves and if cyclicals can carry the baton from big tech.
Final Word: Rotation Underway, Tariff Volatility Deferred, Earnings in Focus
The S&P 500’s rally has broadened, with energy, utilities, and financials stepping into the leadership vacuum left by tech. This rotation is healthy for now. Tariff headlines remain background noise unless they flare again, while Treasury auctions have reestablished a floor of confidence. With Nvidia cooling and breadth improving, equity bulls have room to run, but earnings must deliver. Expect position shuffling and sector churn as the market digests macro noise and braces for Q2 scorecards.

US IG Credit Wrap: Spreads Steady at 49.85 bp as Market Embraces Soft Landing but Gaps in Conviction Remain
Current Spread: 49.85 bp | 5-Year Average: 62.79 bp
Investment-grade credit spreads closed marginally tighter on Thursday at 49.85 basis points, essentially flat on the day continuing to flirt with post-COVID lows. The optics of calm are striking, especially with equities at record highs and the Treasury market digesting another hefty issuance. But under the surface, the sharp decline in macro volatility appears less like strength and more like suspended disbelief — with credit trading like a high-conviction carry trade while quietly bracing for surprises.
Credit Context
< 60 bp: Duration-friendly, carry-positive zone for insurers, pensions, and liability-driven buyers.
60–70 bp: Macro noise threshold, where volatility or inflation threats prompt positioning cuts.
> 90 bp: Systemic stress unlikely unless global macro or geopolitical shocks return.
Macro Overlay: Strong Tape, Fragile Foundation
1. Spreads Tighten Despite Mixed Macro
IG credit held firm even as equity markets made fresh highs on rotation into cyclicals and duration-sensitive names. The demand backdrop remains strong, supported by asset allocators looking for positive real carry in a still-rangebound rate environment. But with average spreads now nearly 13 bp below the 5-year mean, valuation cushion is thin.
2. Treasury Auction Reinforces Liquidity, But Not Confidence
Thursday’s $22 billion 30-year auction went smoothly, helping hold the 10-year around 4.34%. For credit, the stability helped duration risk remain digestible. However, persistent steepness in the long end (4.86% on the 30-year) continues to cap credit curve compression. The Treasury curve is offering carry, but not conviction.
3. Tariffs Still Lurking, But Credit Ignores the Smoke (for Now)
With more than 90% of the trade deficit now under active renegotiation and another round of tariff threats hanging over Brazil, India, and broader BRICS trade flows, the long tail of uncertainty persists. While equity volatility reacts episodically, IG credit is behaving as if tariffs are noise — not yet priced as a margin threat.
4. Credit Stability Is Not Credit Strength
Liquidity remains ample, but risk appetite is narrowing. Single-name dispersion is increasing — particularly in sectors like autos and food — where companies like Conagra and Helen of Troy have flagged cost pressure from tariffs and input inflation. Secondary bid-ask spreads are inching wider in BBBs, suggesting the street is getting less comfortable at the margin.
Complacent or Constructive?
With spreads under 50 bp, IG credit is signaling confidence in a soft landing, low volatility, and Fed accommodation later this year. But with a heavy primary calendar expected after earnings blackouts lift and the tariff deadline still unresolved, this feels less like a moment of strength and more like a pause before clarity.

Mag7 Model:
See the intro published for how to use the Mag7 models here: Link
Short-End Rates Wrap: Easing Conviction Holds at –116.7 bp as Market Awaits CPI Cue and Tariff Dust to Settle
Cumulative Implied Easing: –116.7 bp | Terminal Rate Seen at 3.16%
The front-end OIS curve held relatively steady Thursday, with markets now pricing –116.7 basis points of total easing through December 2026. That’s just a modest step back from the prior –121.9 bp and reflects lingering hesitation ahead of July 15 CPI and Powell’s testimony next week. While the September FOMC is still viewed as the most likely kickoff for cuts, the pace thereafter has tempered slightly — not from a change in macro tone, but from tactical positioning as headline risk builds.
OIS-Implied Rate Path
Front-End Meetings:
11-Jul-25: 4.330% → Fully priced out, no cut expected
30-Jul-25: 4.313% (–1.7 bp) → ~7% cut probability → Powell testimony risk, but still seen as too early
17-Sep-25: 4.146% (–6.7 bp) → ~67% probability → Still the favored start of easing cycle
29-Oct-25: 3.993% (–5.3 bp) → ~61% probability → Two cuts partially priced through October
2025 Year-End Outlook:
10-Dec-25: 3.808% → –52.2 bp total easing → Market sees 2 cuts in by year-end, down slightly from yesterday’s –53.2
Cycle Terminal:
09-Dec-26: 3.163% → –116.7 bp total easing → Terminal remains well below 3.25%, but just shy of recent lows
Macro Overlay: Steady Expectations, Fragile Momentum
1. September Cut Still Favored, But Pace Cools Slightly
Despite another day of calm across risk assets, the market edged back implied easing slightly likely a reflection of positioning rather than fundamentals. September remains the primary cut window, but traders are now tempering the likelihood of a third cut in 2025 without a supportive CPI read.
→ Until inflation offers clearer relief, the market is reluctant to front-load the cycle further.
2. Tariff Noise Continues, but Still Viewed as Transitory
Markets continue to shrug off President Trump’s tariff barrage, including this week’s Brazil and India jabs. The prevailing belief is that while tariffs may juice headline inflation, they won’t derail the Fed’s broader easing bias unless CPI surprises to the upside.
→ The curve is treating tariffs as political optics, not policy roadblocks for now.
3. Labor Market Softness Still Offering Cover for Doves
Jobless claims remain historically low, but the rise in continuing claims and the drag in wage-sensitive measures like average weekly hours and temporary hiring are quietly supporting the case for a slower labor market. This backdrop lets the Fed ease into cuts without needing crisis conditions.
→ The “not strong, not weak” labor backdrop remains ideal for gradual policy normalization.
4. Balance Sheet Talk Adds Another Layer of Caution
Fed Governor Waller’s comments on a $5.8 trillion balance sheet floor and a shift toward shorter-duration assets underscore that policy normalization is broader than just the funds rate. Markets may see this as a signal that even if rate cuts are slow, financial conditions may loosen via other levers.
→ The market is parsing balance sheet rhetoric as part of the easing toolkit.
Final Word: Easing Still Expected, but the Next CPI Is Pivotal
The short-end is holding its ground, with 117 bp of cuts priced through late 2026 and September still looking like the starting gun. But conviction in the glidepath has cooled just enough to reflect the growing weight of data dependency especially with July CPI and Powell’s testimony just ahead.
Unless inflation flares or global volatility escalates, traders are betting on a steady, gradual easing cycle but are now watching closely for signals that could either accelerate or derail that trajectory.

Tactical Portfolio
Morning Trade(s) and Market thread
Keep reading with a 7-day free trial
Subscribe to Capital Flows to keep reading this post and get 7 days of free access to the full post archives.