

Macro Regime Tracker: The Melt Up Scenario
Macro regime and risk assets qualified clearly

The Macro Regime Tracker offers a daily lens on how shifts in growth, inflation, and liquidity affect short-term risk and reward. Leveraging machine learning, AI, and cross-asset data, it identifies macro changes and their impact on market positioning.
Macro Regime Tracker Index:
I have laid out an updated view of all the trades and macro views for paid subscribers here:
Trade Update: Video Breakdown Of Trades And Macro Views

Trade Update: Video Breakdown Of Trades And Macro Views
I would encourage everyone to review the video I did on the Fed and rate cuts because it explains that rate cuts or hikes are not inherently bearish or bullish. It is all about HOW they relate to the underlying growth and inflation in the system.
Everything is setting up for the CPI print next week, which traders are getting positioned into. All of the systematic models and strategies are updated below.
Main Developments In Macro
US Monetary Policy & Fed Commentary
*NY FED: ONE-YEAR INFLATION EXPECTATIONS RISE TO 3.09% VS 3.02%
*NY FED: 3Y CONSUMER INFLATION EXPECTATIONS FLAT AT 3% IN JULY
*NY FED: 5Y CONSUMER INFLATION EXPECTATIONS 2.9% IN JULY VS 2.6%
*NY FED: 1Y CONSUMER INFLATION EXPECTATIONS 3.1% IN JULY VS 3%
*BOSTIC: I'M STILL THINKING ONE FED RATE CUT THIS YEAR
*BOSTIC: WATCHING MARKET FUNCTION AS WE REDUCE FED BALANCE SHEET
*BOSTIC: WE'VE STILL YET TO SEE ALL THE PRICE CHANGES WE'LL SEE
*BOSTIC: MOST EYE-OPENING PART OF JOBS REPORT WAS REVISIONS
*BOSTIC: JOBS DATA REVISIONS REFLECT TURBULENCE IN US ECONOMY
*BOSTIC: JOBS DATA REVISIONS NOT UNUSUAL BUT SIZE WAS SURPRISING
*BOSTIC: BEEN SURPRISING TO ME HOW MARKETS HAVE BEEN EVOLVING
*BOSTIC: WILL STILL SEE BUSINESSES ADJUST TO TARIFFS INTO 2026
*WALLER EMERGES AS FAVORITE FOR FED CHAIR AMONG TRUMP TEAM
*TRUMP TEAM LIKES WALLER DESIRE FOR RATE CUTS BASED ON FORECASTS
*BESSENT: TRUMP HAS SAID HE'S NOT GOING TO FIRE CHAIR POWELL
Trade & Tariffs
*AKAZAWA: HAVE BEEN ABLE TO CONFIRM NON-STACKING STANCE FROM US
*AKAZAWA: US SAID THEY WILL FIX EXECUTIVE ORDER APPROPRIATELY
*AKAZAWA: US TO CUT CAR TARIFFS WHEN LEVIES STACKING REMOVED
*AKAZAWA: REGRETTABLE US STACKED TARIFFS DESPITE TRADE DEAL
*AKAZAWA: NO GAP IN UNDERSTANDING WITH US OVER TARIFF STACKING
*AKAZAWA STRONGLY URGES TRUMP TO LOWER AUTO TARIFFS
*BESSENT: CHINA TARIFFS COULD BE ON THE TABLE AT SOME POINT
*BESSENT: MANUFACTURERS 'EATING' TARIFFS
US Foreign Policy & Geopolitics
*US ADDS FIRMS, INDIVIDUALS TO IRAN SANCTION LIST
*TRUMP: PUTIN, ZELENSKIY WANT TO MEET WITH ME
*TRUMP: PUTIN DOES NOT NEED TO MEET ZELENSKIY BEFORE I DO
*TRUMP ON INDIA TARIFF: NO TALK UNTIL GET THINGS RESOLVED
*TRUMP ON RUSSIA DEADLINE: UP TO PUTIN
*TRUMP TO MAKE ANNOUNCEMENT ON THE ECONOMY, WHITE HOUSE SAYS
Macro Tear Sheets: Equities, Stock/Bond Correlation, Fixed Income, FX, Crypto, and Commodities
Macro Regime Dashboard: Excel spreadsheet for economic data, interest rates, and real estate.
Momentum and Mean Reversion Models: Equities, Commodities, Fixed Income, and Currencies
You can find the educational primer and video explanation of these models here: LINK
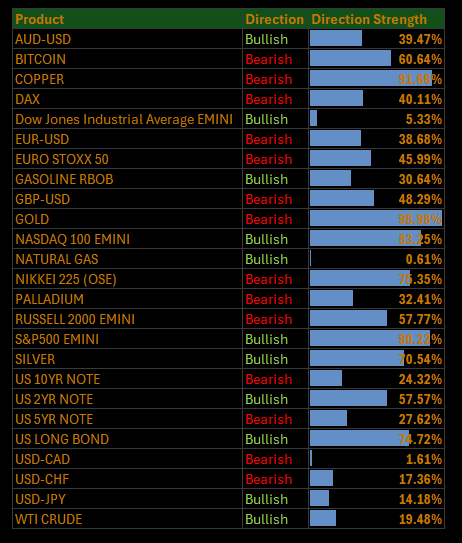
Here is a summary of all models and their directional strengths:
Growth, Inflation, Fixed Income, Credit, and Equities Regime Tracker
The Macro Regime Model offers a real-time view of growth, inflation, and yield curve dynamics, integrating these with credit market shifts, equity risk premiums, and positioning data. It connects upcoming catalysts to statistical drivers of asset prices, creating a unified framework that quantifies skew and clarifies risk-reward across asset classes.
Key Points To Set The Context:
US Market Wrap: Tariffs Bite, Fed Politics Loom, Breadth Cracks
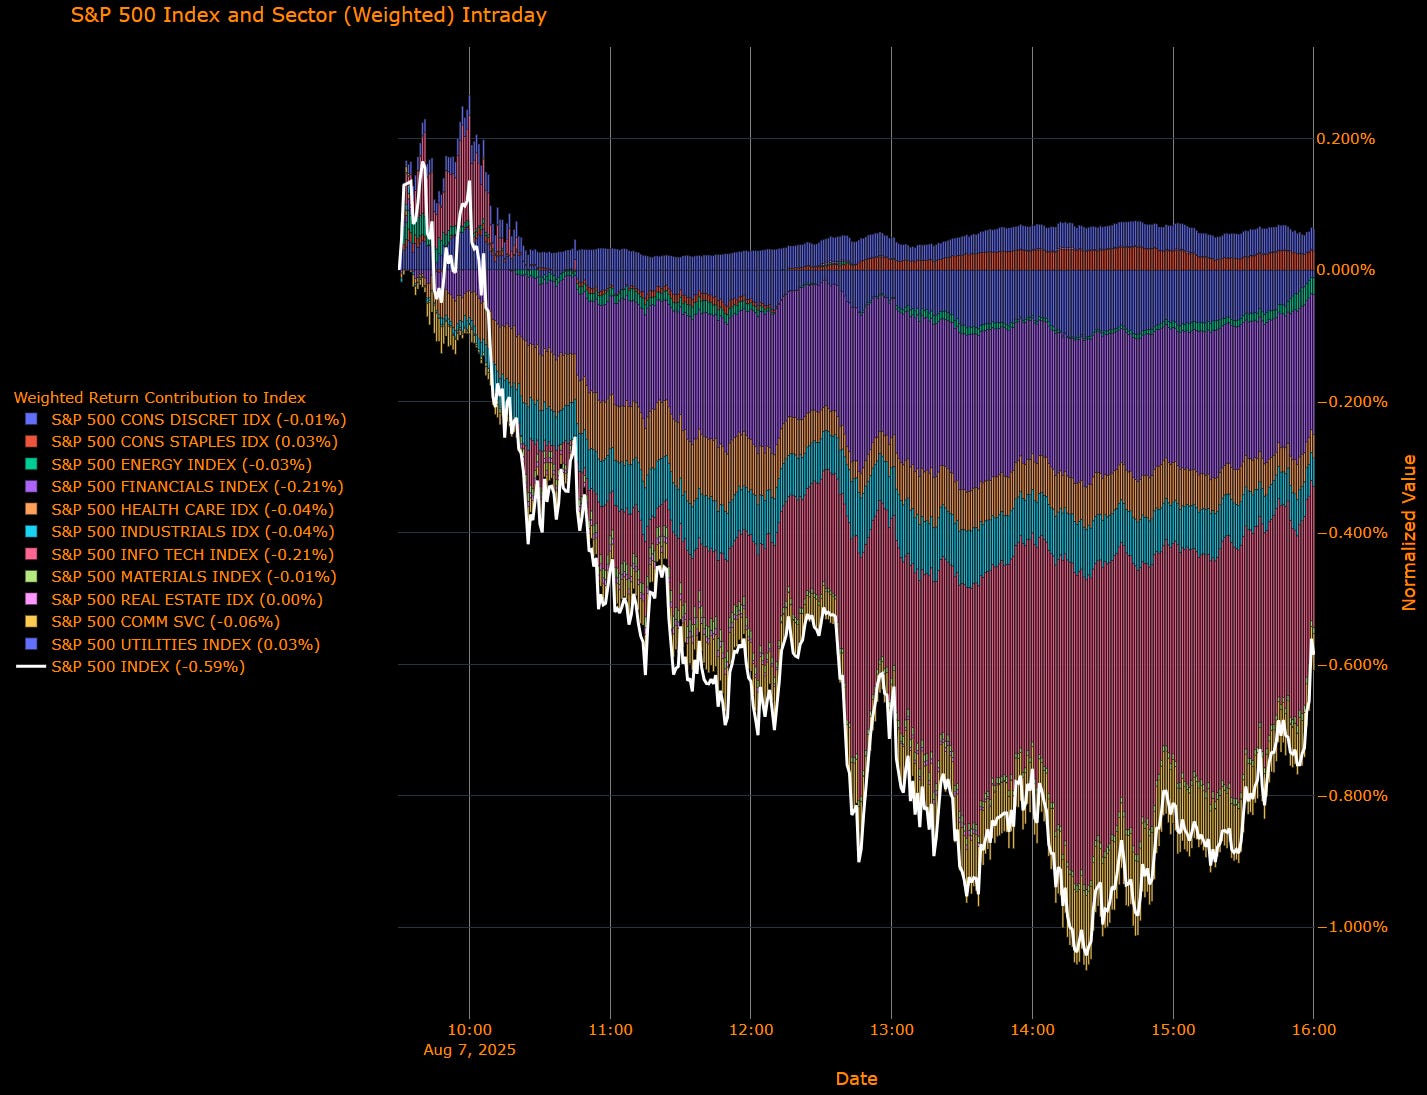
The S&P 500 fell 0.59% on Thursday, snapping its upward run as tariff headlines and Fed politics weighed on sentiment. Selling was broad-based, with cyclicals and financials leading the declines, while defensives like utilities and consumer staples provided rare pockets of support. The index’s 30% run from April lows has brought valuations into overheated territory, and traders appear more willing to fade strength heading into a seasonally soft stretch.
Sector Contribution Breakdown
(Weighted Return Contribution to S&P 500)
Top Positive Contributors
Consumer Staples (+0.03 pp) – Defensive bid kept staples marginally positive, even amid a broader pullback.
Utilities (+0.03 pp) – Yield-sensitive names caught a bid as long-end yields steadied.
Real Estate (0.00 pp) – Flat, but a relative outperformer given macro headwinds.
Flat to Negative Contributors
Financials (–0.21 pp) – Largest drag, as banks slumped under policy uncertainty and curve compression.
Info Tech (–0.21 pp) – Chips and software reversed gains; no single-stock hero to offset weakness this time.
Comm Services (–0.06 pp) – Weakness in large-cap platforms overshadowed smaller media gains.
Health Care (–0.04 pp) – Tariff risks to pharma persisted, weighing on sentiment.
Industrials (–0.04 pp) – Global trade tensions and rising input costs kept buyers sidelined.
Energy (–0.03 pp) – Oil drifted lower; refining margins softened.
Consumer Discretionary (–0.01 pp) – Retail gave back recent gains amid tariff-linked cost concerns.
Materials (–0.01 pp) – Commodity-sensitive names underperformed on weaker demand outlook.
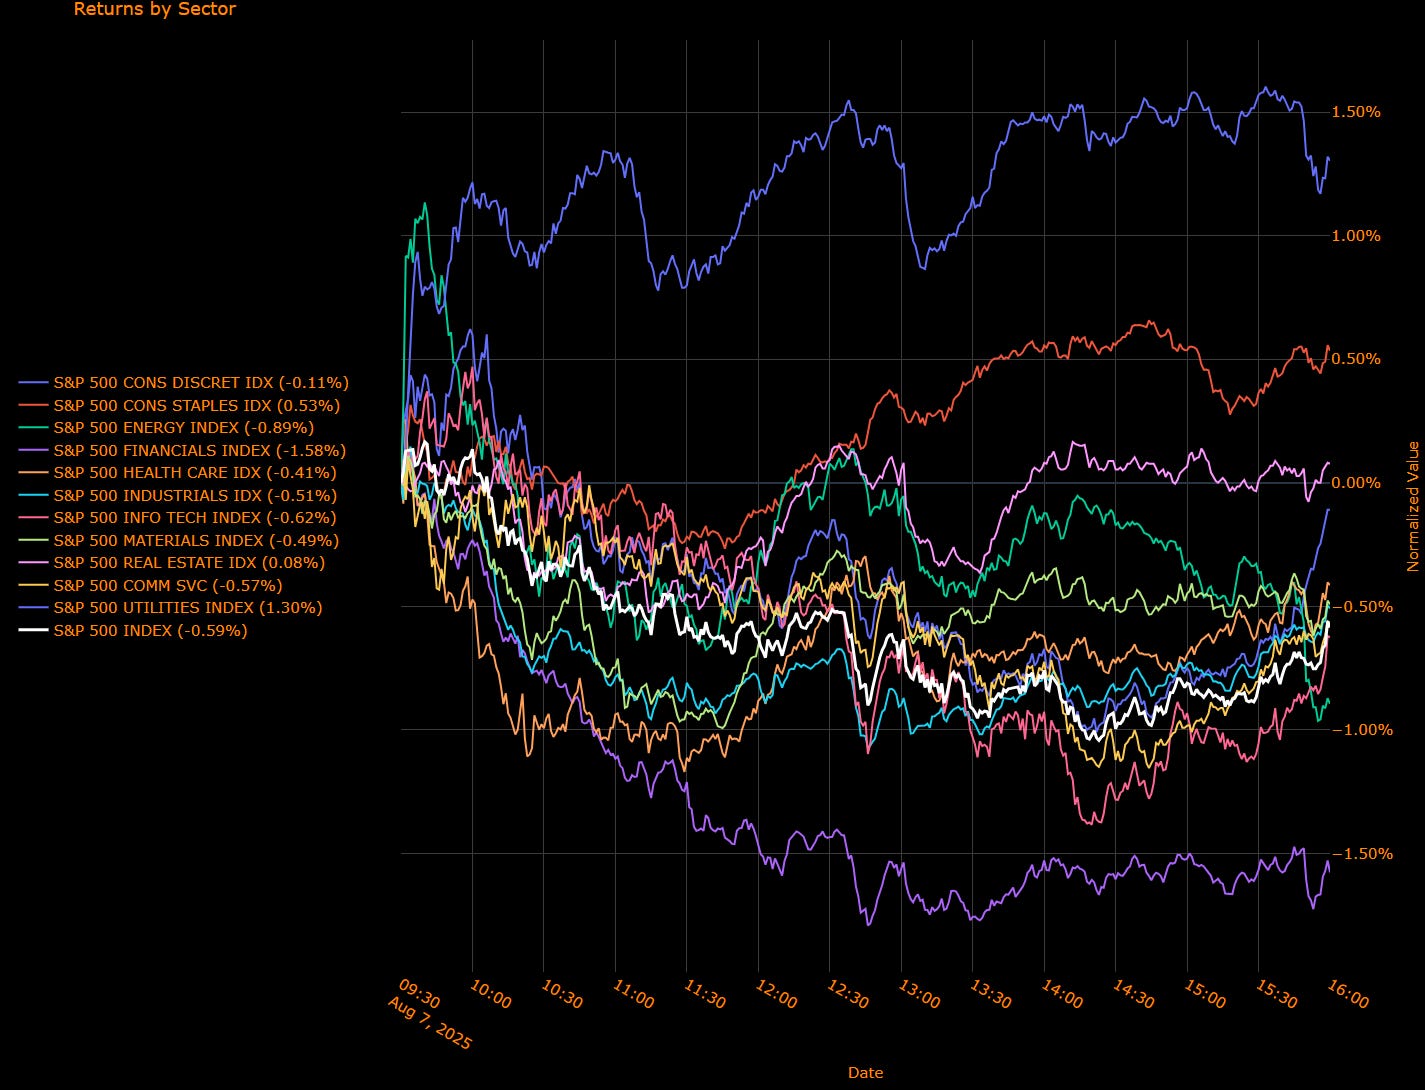
Sector Performance Breakdown
(Unweighted Daily Returns)
Leaders
Utilities (+1.30%) – Strong defensive rotation amid macro noise.
Consumer Staples (+0.53%) – Benefited from a risk-off bid.
Real Estate (+0.08%) – Slight gain on stable long-end rates.
Laggards
Financials (–1.58%) – Biggest loser, pressured by curve dynamics and political uncertainty around the Fed.
Energy (–0.89%) – Crude weakness and tariff spillovers hurt sentiment.
Info Tech (–0.62%) – Broad softness without the mega-cap cushion.
Comm Services (–0.57%) – Large-cap social/media names reversed early gains.
Industrials (–0.51%) – Trade-sensitive names underperformed.
Materials (–0.49%) – Demand fears weighed.
Health Care (–0.41%) – Tariff overhang on pharma persisted.
Consumer Discretionary (–0.11%) – Minor loss but notable reversal from recent leadership.
Macro Overlay: Tariffs Set, Fed Chair Games Begin
Thursday marked the official start of Trump’s sweeping new tariffs, pushing the average US tariff rate to 15.2%, the highest since WWII. While some key partners like the EU, Japan, and South Korea negotiated partial relief, others – including India – face hikes up to 50% in coming weeks. Businesses have so far absorbed much of the cost, but analysts warn consumers may start feeling the pinch as inventories built ahead of the levies are run down.
At the same time, Fed politics are heating up. Trump nominated Stephen Miran as a temporary Fed governor and is actively weighing successors to Powell, with Christopher Waller emerging as a favorite for chair. Waller’s recent dissent in favor of a rate cut and willingness to act on forecasts over backward-looking data align with Trump’s push for easier policy.
Labor data added to the mixed picture: continuing claims rose to their highest since November 2021, stoking concerns about a softening jobs market even as inflation expectations ticked higher in the NY Fed’s latest survey. September cuts remain priced, but conviction is under pressure as the Fed navigates a politically charged, trade-heavy backdrop.
Fragile Tape in a Heavy Policy Fog
The market’s stumble reflects more than just profit-taking breadth is weakening, cyclicals are losing momentum, and policy uncertainty is climbing. Tariffs are now fully in play, the Fed’s leadership path is a live headline risk, and labor-market signals are deteriorating. In a market priced for perfection, the bar for upside surprises is high.
US IG Credit Wrap: Stability Masks Underlying Fragility as Spreads Hover at 51.98 bp
Current IG Spread: 51.98 bp
5-Year Avg: 62.69 bp
COVID High: 151.80 bp
Cycle Low: 43.75 bp
Investment grade credit continues to trade in a remarkably tight range, with spreads anchored at 51.98 bp—comfortably inside the 5-year average—despite an environment loaded with potential disruptors. On the surface, this looks like confidence. In reality, it’s beginning to feel more like wilful disregard for mounting macro and policy risks.
Credit Context
< 60 bp: Duration-friendly, carry-positive zone for insurers, pensions, and liability-driven buyers.
60–70 bp: Macro noise threshold, where volatility or inflation threats prompt positioning cuts.
> 90 bp: Systemic stress unlikely unless global macro or geopolitical shocks return.
Macro Overlay: Calm Tape, Noisy Backdrop
Tariff Impact Sets In: Trump’s sweeping new tariff package is now live, pushing the average US tariff rate to its highest level since WWII at 15.2%. Critical sectors like autos, semiconductors, and pharma face sharply escalating duties. India will see levies on certain goods jump to 50% within weeks, and the risk of secondary sanctions is firmly on the table.
Fed Board in Transition: Stephen Miran’s appointment to a temporary Fed governor seat adds a fresh dovish voice, while Christopher Waller emerges as a leading candidate to replace Powell in 2026. This political churn risks re-shaping September’s policy messaging and could test market confidence in the Fed’s independence.
Data Flashing Mixed Signals: US continuing jobless claims just hit their highest level since late 2021, confirming labor market softening. ISM services remains barely in expansion, while prices paid are re-accelerating—a stagflation-lite setup.
Why Spreads Haven’t Moved
Equity volatility remains subdued, Treasuries are rangebound, and credit desks report steady demand from asset allocators. But the lack of spread reaction is less about conviction and more about inertia: an unwillingness to adjust until the tape forces the issue.
The Risk Skew
Spreads don’t need to blow out to reprice risk. A drift back toward the 60–70 bp range could happen without a recession just an acknowledgment that tariffs, Fed politicization, and softer labor data make the current < 52 bp level look complacent.
Mag7 Model:
See the intro published for how to use the Mag7 models here: Link
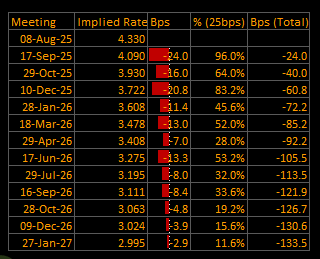
Short-End Rates Wrap: September Cut Firm, Path Steady as Politics and Tariffs Dominate Backdrop
Cumulative Implied Easing (to Jan 2027): –133.5 bp
Terminal Rate (Jan 2027): 2.995%
September OIS Cut Probability: 93.6% | Implied Rate: 4.096%
The September rate cut remains firmly priced, with 93.6% probability and 23.4 bp of easing implied for the meeting. The curve beyond September has barely shifted, keeping the terminal rate just under 3% and the total implied cuts through January 2027 at –133.5 bp.
This stability masks a market balancing act: traders are holding their conviction on the easing cycle while navigating an increasingly politicized Fed narrative and an aggressive trade policy shockwave.
OIS-Implied Policy Path
Macro Overlay: Calm Curve, Noisy Headlines
Tariffs in Force: Trump’s sweeping tariff package is now active, driving the average US tariff rate to 15.2% the highest since WWII. Key sectors like autos, semiconductors, and pharma face sharp and escalating levies. India, hit with 50% duties on certain goods, underscores the geopolitical edge to trade policy.
Fed in Transition: Stephen Miran’s nomination to fill Adriana Kugler’s seat adds a short-term dovish tilt. Meanwhile, Christopher Waller emerges as a top contender to succeed Powell, reinforcing the perception of a Fed increasingly shaped by White House preferences.
Labor and Inflation Crosscurrents: Continuing jobless claims just hit their highest since late 2021, suggesting labor market softness. Yet, price pressures are sticky services prices paid are at their highest since late 2022 feeding stagflation-lite fears.
From Predictable to Conditional
The rate path retains a clear easing bias, but its execution is now hostage to politics and tariffs. The market sees the Fed cutting, but how far and how fast depends on:
Whether tariff-driven inflation proves transitory.
How aggressively the new Fed appointees shape the policy tone.
The degree of labor market deterioration into year-end.
For now, the curve is calm. But the blend of political overhang, trade shocks, and fragile macro data leaves plenty of room for repricing quickly.
Tactical Portfolio
Morning Trade(s) and Market thread
Keep reading with a 7-day free trial
Subscribe to Capital Flows to keep reading this post and get 7 days of free access to the full post archives.