

Macro Regime Tracker: The Yield Curve Signal
Macro regime and risk assets qualified clearly

The Macro Regime Tracker offers a daily lens on how shifts in growth, inflation, and liquidity affect short-term risk and reward. Leveraging machine learning, AI, and cross-asset data, it identifies macro changes and their impact on market positioning.
Macro Regime Tracker Index:
Macro Regime Context
Macro Tear Sheets: Equities, Fixed Income, FX, Crypto, and Commodities
Macro Regime Dashboard: Excel spreadsheet for economic data and interest rates
Growth, Inflation, Fixed Income, Credit, and Equities Regime Tracker
AI and Machine Learning Strategies - Macro Regime and Positioning Premiums Strategies: S&P 500, 2-Year Interest Rates, Gold, and Bitcoin
Macro Regime Context:
Today is the final day of the quarter, which means whatever rebalancing flows that needed to be accomplished have been put through, and we are now entering Q3. These flows likely added a little bit of a bid to bonds over the last couple of days. The macro constraints I laid out in the Macro Report continue to be my base case for WHERE we are moving.

The 10s30s yield curve continues to steepin in a manner that indicates MORE growth ahead as opposed to a recession (see thread I wrote here: link).
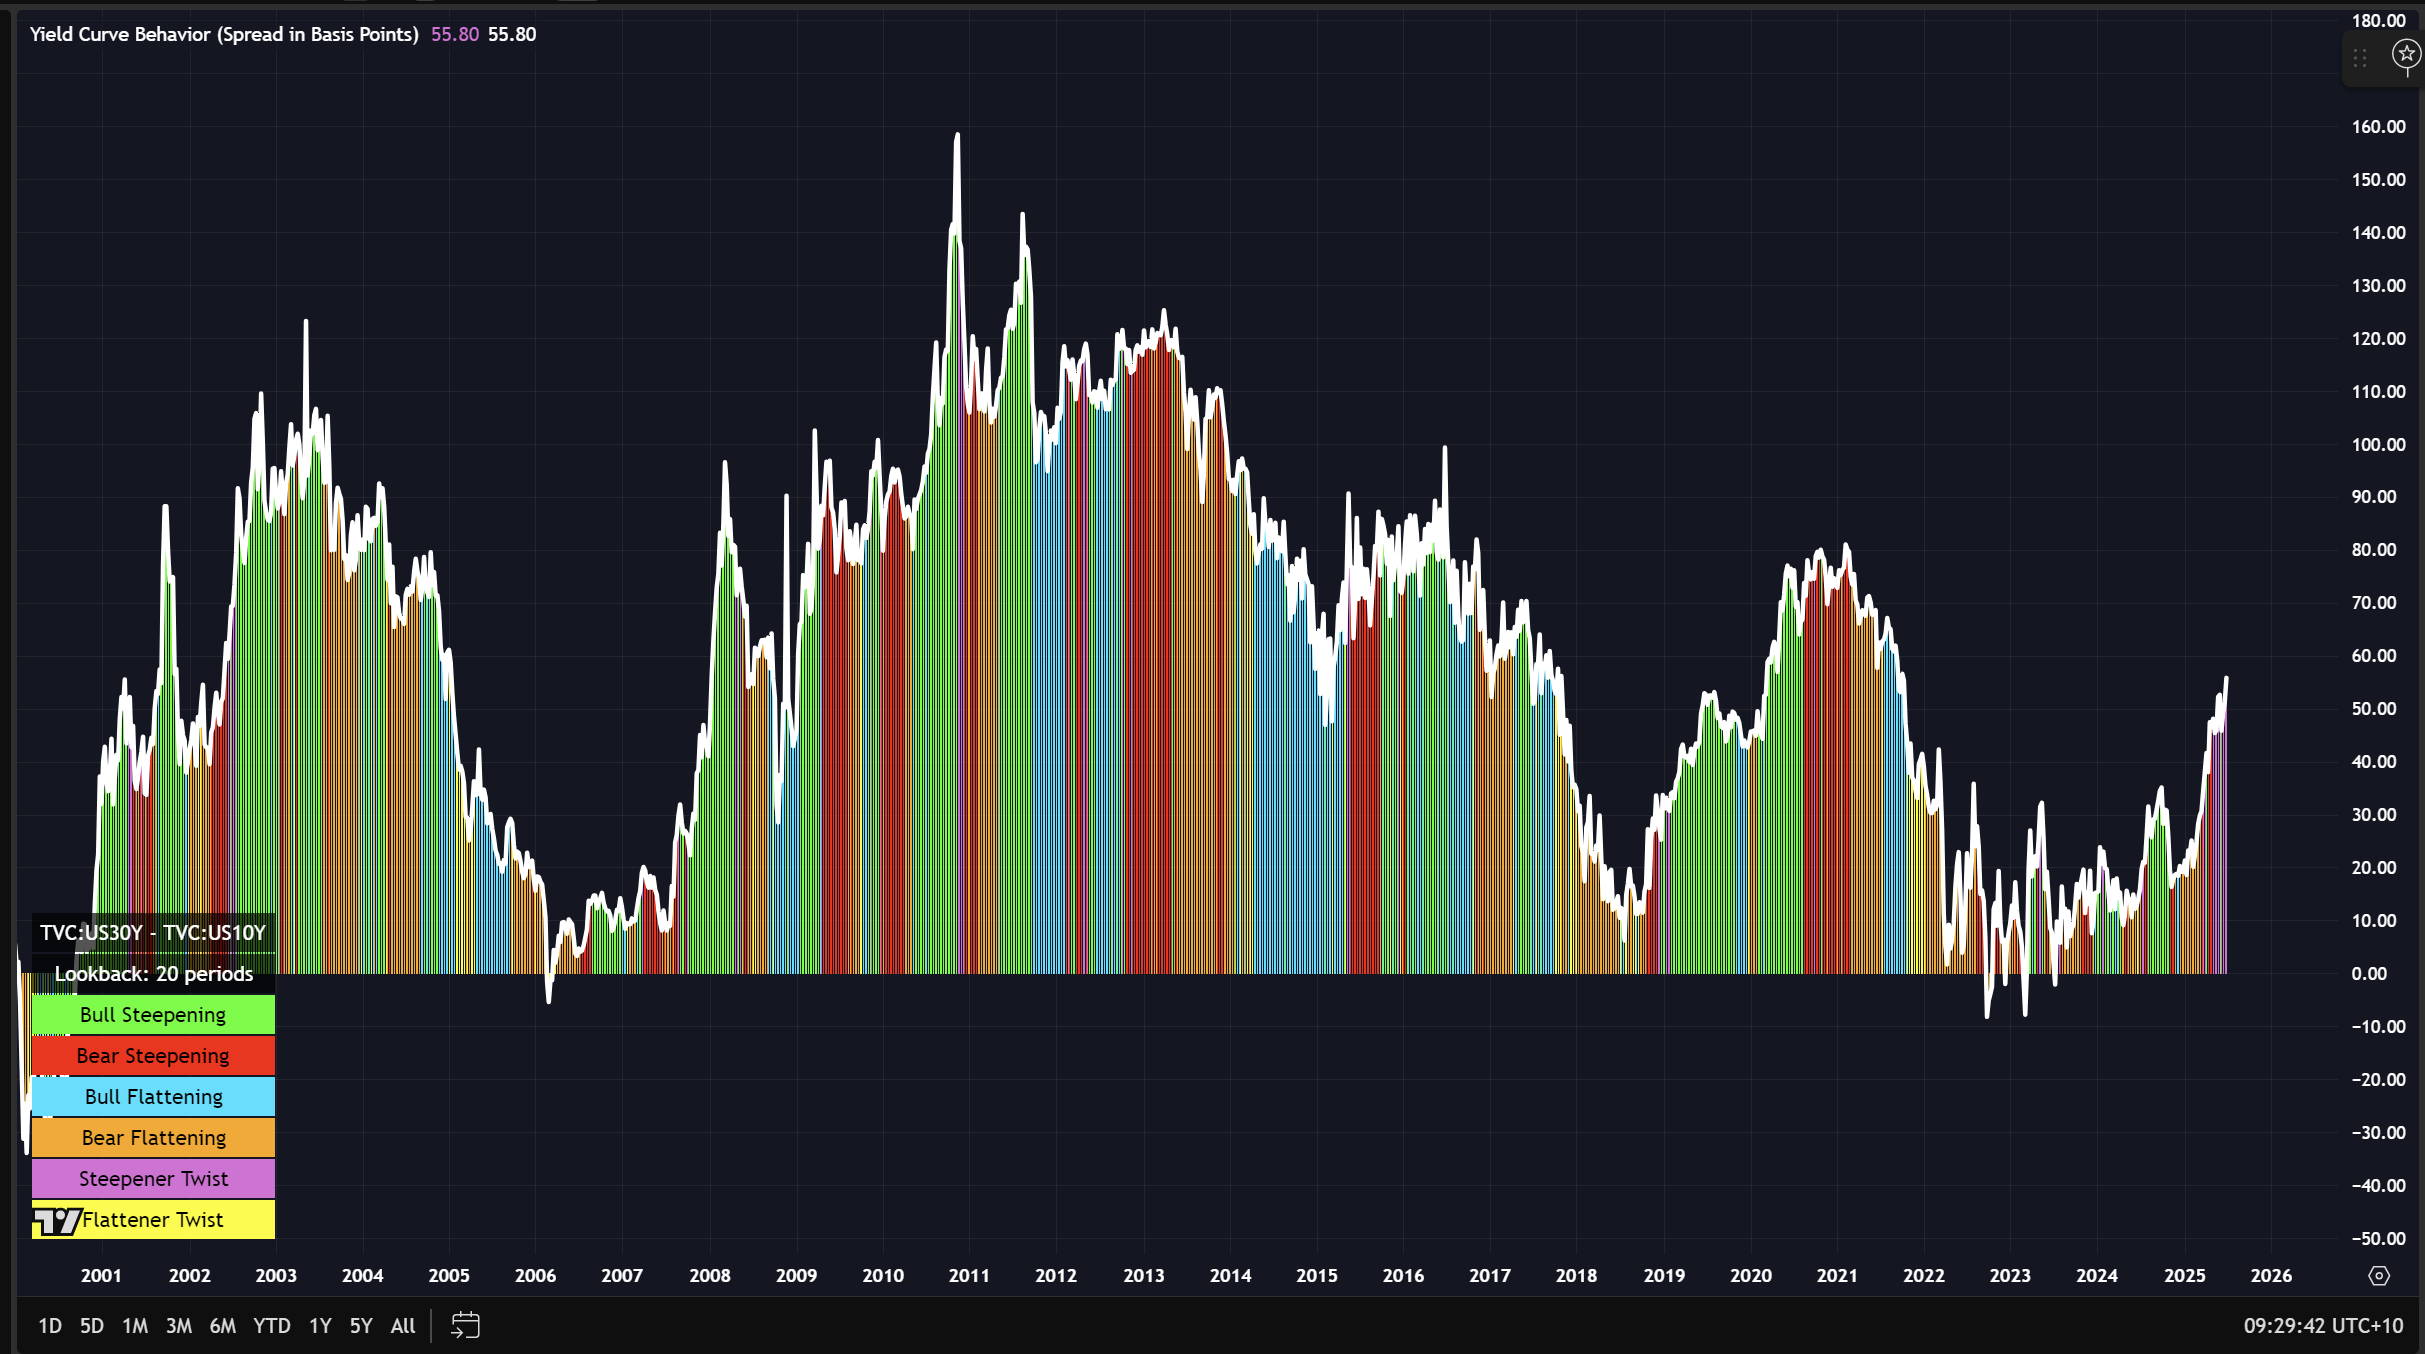
As I laid out in the macro report (link), the focus on recession continues to be a theme the media pushes even though the evidence for it is anecdotal.

If you understand the dynamics of the yield curve, you can have a much clearer understanding of WHERE all major risk assets are moving. I have put together a playbook that comprehensively explains these factors as they relate to recession risk. The playbook is here:
The final point I want to make is that the rest of this report is sent out every day with all of the major models I review every day. It pulls together every major economic and market data point, runs it through our machine learning and AI process to correctly frame HOW to think about the current regime. If you have a macro view, you want a continuous feed of information and models to consistently provide color for WHAT is taking place so you can evaluate your thesis in an informed manner.
Main Developments In Macro
US Macro Policy & Fed
Bostic: Need more information to know which direction to move
Bostic: Much of tariff pricing hasn't shown yet in marketplace
Atlanta Fed President Raphael Bostic speaks at event in London
Bessent: Fed 'seem a little frozen at the wheel here'
Bessent: Will be working on Powell successor coming weeks, months
Bessent: The time to term out debt issuance was 2021, 2022
Bessent on terming out debt issuance: 'Why would we'
Leavitt: Trump note to Powell cites interest rates globally
Leavitt: Trump sent a note to Powell today
Hassett declines to comment on whether he'd be Fed Chair
US Trade & Tariff Developments
Trump: Will send Japan letter on tariffs
EU to accept Trump’s universal tariff but seeks key exemptions
Leavitt: Trump will set rates if nations don't negotiate
Leavitt: Trump meeting this week with team to set tariff rates
Leavitt: Working on a date for Netanyahu visit
Leavitt: Carney called Trump last night about digital tax
Leavitt: Lutnick, Trump were working on India deal recently
Leavitt: Finalizing agreements, will hear on India soon
Leavitt: 90-day extension is to work out TikTok deal
Leavitt: China TikTok talks ongoing at highest levels
Bessent: Now negotiating reciprocal tariffs, 'we'll see' on 232
Bessent: Could still spring back to April 2 tariffs
Bessent: Going to be a flurry of trade deals into final week
Bessent: 'Nothing' more transitory for inflation than tariffs
Carney: We're making progress toward a deal with the US
Lutnick thanks Canada for removing digital services tax
House to vote on Trump tax bill as soon as Wednesday
Canada says trade talks with US aim for deal by July 21
US Geopolitical Risk & Sanctions
Leavitt: Maintains sanctions on Assad
Leavitt: Trump will sign order to end Syria sanctions
Leavitt: Trump himself has not spoken with Iran
Leavitt: Witkoff has been in communication with Iranians
US holds 'preliminary discussions' on Israel-Syria deal: Axios
Trump says not even talking to Iran
Trump: I am not offering Iran anything
Trump says he'd take sanctions off Iran if they can be peaceful
Global Macro Context
US June MNI Chicago Report Business Index at 40.4; est. 43.0
S&P 500 advances 11% in best quarter since 2023
Macro Tear Sheets: Equities, Stock/Bond Correlation, Fixed Income, FX, Crypto, and Commodities
Macro Regime Dashboard: Excel spreadsheet for economic data, interest rates, and real estate.
Momentum and Mean Reversion Models: Equities, Commodities, Fixed Income, and Currencies
You can find the educational primer and video explanation of these models here: LINK
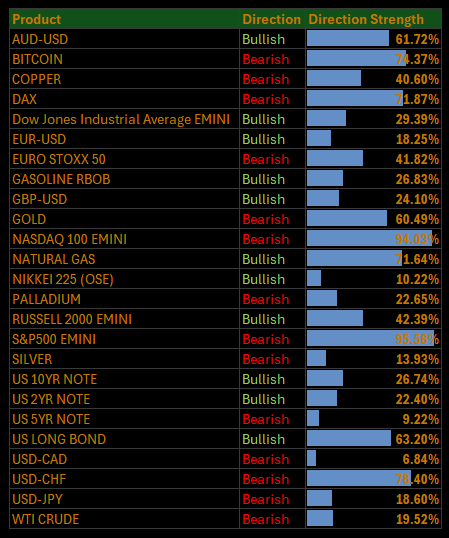
Here is a summary of all models and their directional strengths:
Growth, Inflation, Fixed Income, Credit, and Equities Regime Tracker
The Macro Regime Model offers a real-time view of growth, inflation, and yield curve dynamics, integrating these with credit market shifts, equity risk premiums, and positioning data. It connects upcoming catalysts to statistical drivers of asset prices, creating a unified framework that quantifies skew and clarifies risk-reward across asset classes.
Key Points To Set The Context:
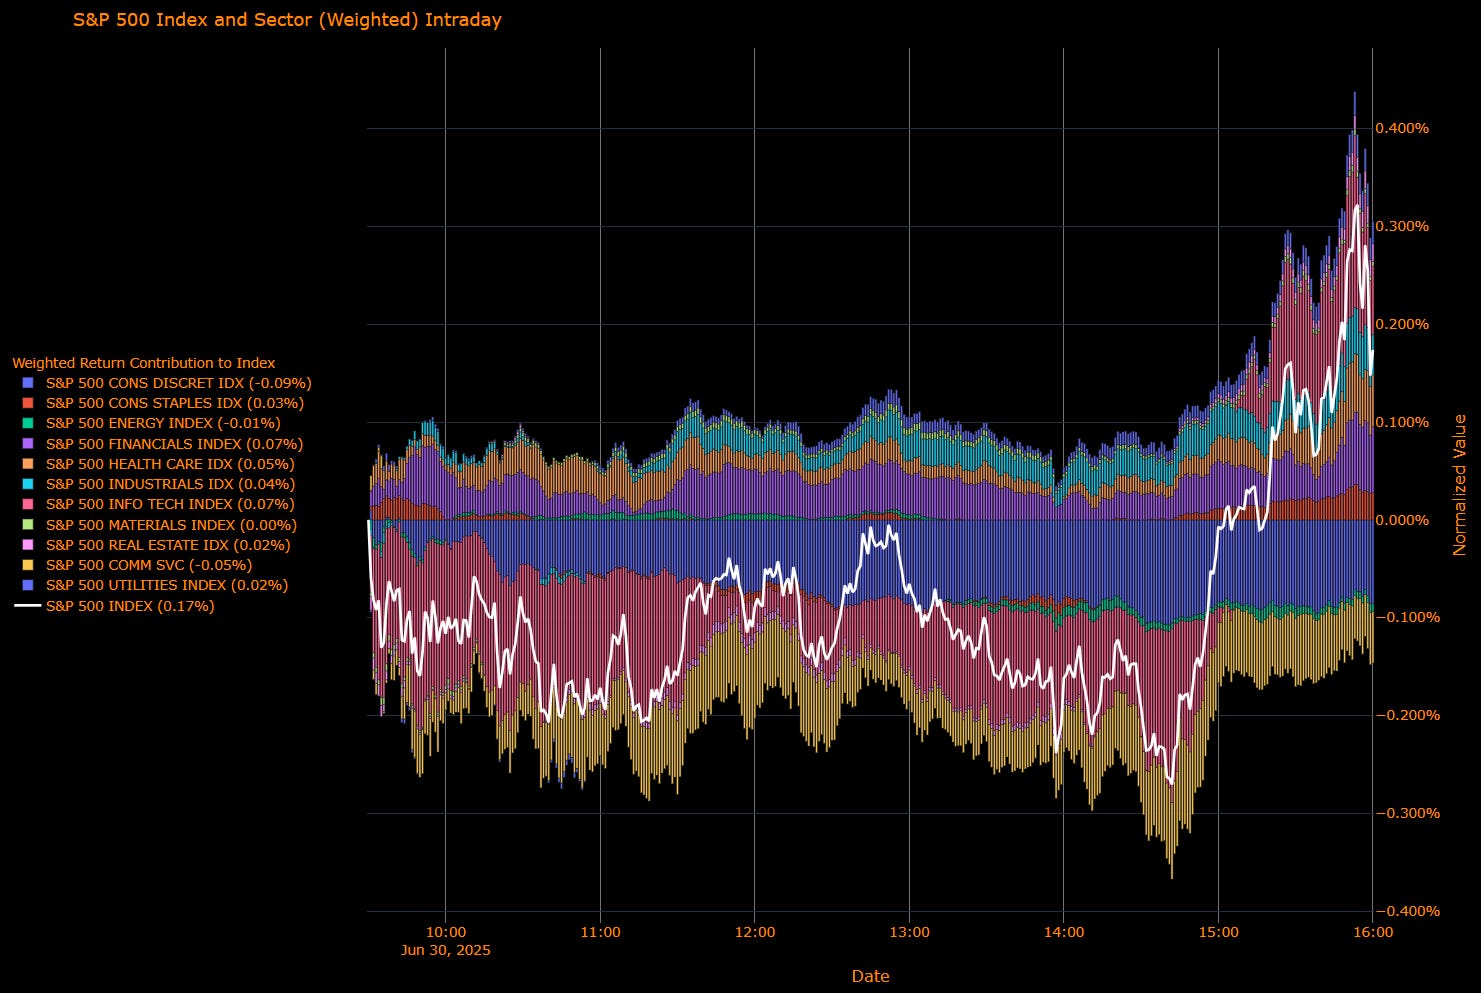
Here’s the updated S&P 500 Sector Wrap using the latest sector contribution and performance data, contextualized within Powell’s testimony, ongoing tariff uncertainty, and growing market fatigue near record highs:
S&P 500 Adds 0.17% as Defensive Bid Resurfaces, Real Estate and Utilities Outperform
The S&P 500 edged up 0.17% Tuesday, capping its strongest quarter since late 2023, as a modest rotation into defensive sectors supported the index amid ongoing trade deal speculation and restrained rate expectations. While participation was narrower than prior sessions, Real Estate, Utilities, and Financials helped offset weakness in Consumer Discretionary and Communication Services. Treasuries firmed, the dollar slid to fresh lows, and macro data stayed mixed all reinforcing a “cut later, not never” backdrop.
Sector Contribution Breakdown (Weighted Return to Index)
Financials (+0.07 pp) – Top contributor as bank stocks extended gains post-stress test, with flatter curves supporting carry dynamics.
Information Technology (+0.07 pp) – Solid bid in hardware and enterprise software, offsetting weakness in semiconductors.
Health Care (+0.05 pp) – Continued rotation into managed care and large-cap pharma names.
Industrials (+0.04 pp) – Lifted by strength in logistics and defense.
Consumer Staples (+0.03 pp) – Supported by multinational staples as tariff risks moderated.
Real Estate (+0.02 pp) – REITs rallied on lower yields and signs of stabilizing rate expectations.
Utilities (+0.02 pp) – Gained on falling rates and rising volatility protection demand.
Materials (0.00 pp) – Flat session; metal strength offset by chemical softness.
Energy (–0.01 pp) – Slight drag as crude oil dipped below $65.
Communication Services (–0.05 pp) – Platform names faded after recent strength; some pullback in telco.
Consumer Discretionary (–0.09 pp) – Largest drag; weakness in e-commerce and travel names post strong Q2 run.
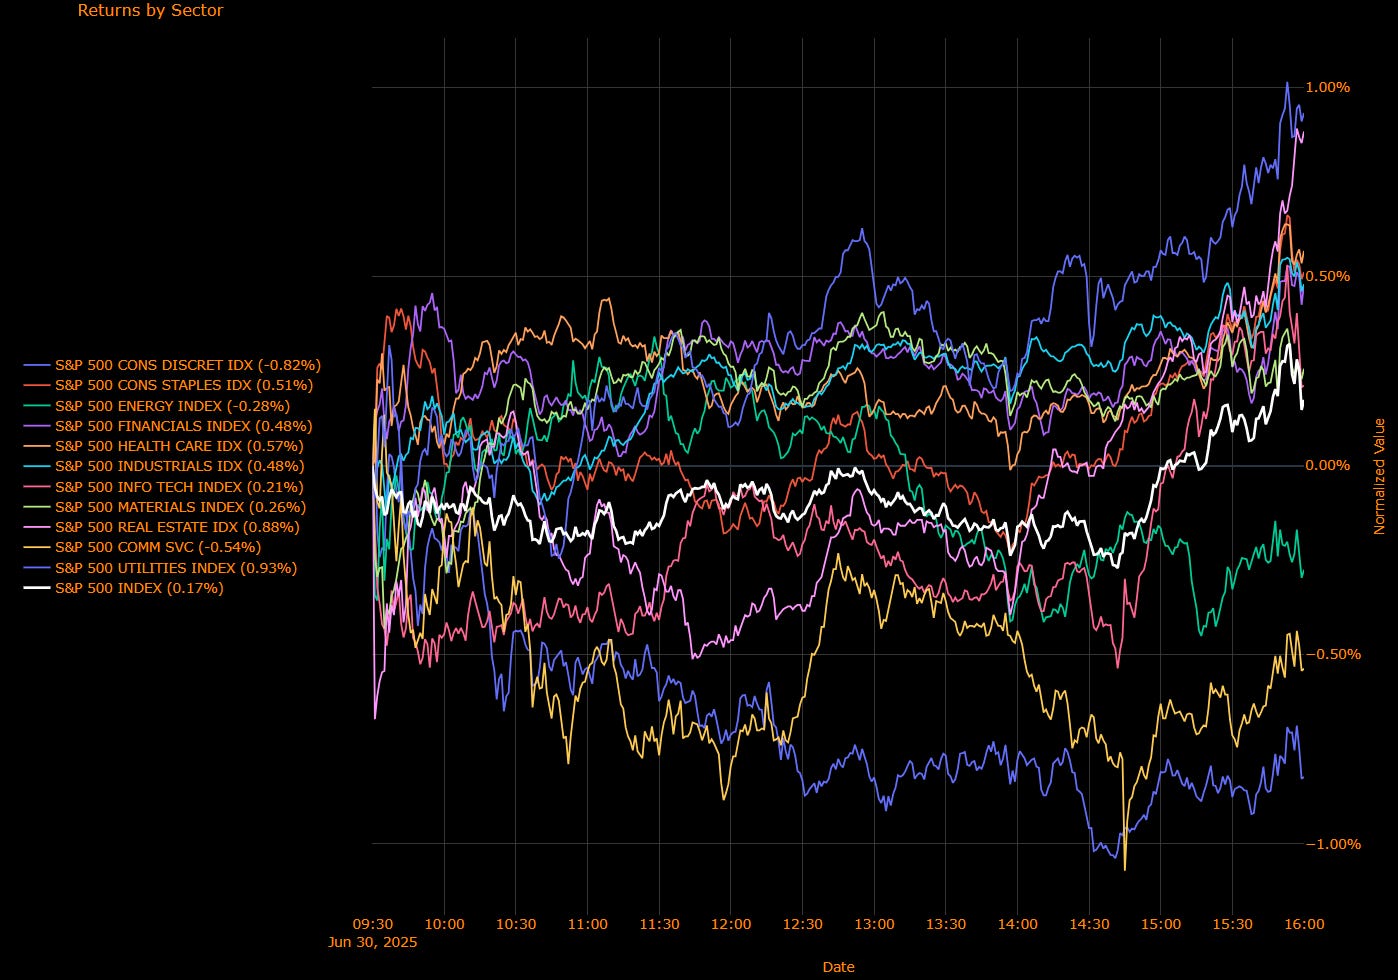
Sector Performance Breakdown (Unweighted Index Returns)
Utilities (+0.93%) – Best performer as defensive positioning resurged.
Real Estate (+0.88%) – Led by REITs and commercial property amid yield decline.
Health Care (+0.57%), Consumer Staples (+0.51%) – Solid defensive rotation continued.
Financials (+0.48%), Industrials (+0.48%) – Steady follow-through in cyclicals; banks and transports firmed.
Materials (+0.26%) – Lifted modestly by metals and packaging.
Information Technology (+0.21%) – Broader sector gain masked chip softness.
Energy (–0.28%) – Lower oil prices weighed despite relative calm in the Middle East.
Communication Services (–0.54%) – Profit-taking in ad tech and media names.
Consumer Discretionary (–0.82%) – Sharpest drop, led by autos, travel, and retail.
Macro Overlay: Window Dressing, Defensive Bid, and Trade Deadlines Loom
Quarter-End Flows Favored Rate-Sensitive Plays
With Q2 closing, month-end rebalancing favored Real Estate and Utilities amid declining Treasury yields.
Treasury Secretary Bessent emphasized that longer-dated issuance would remain restrained, reinforcing bullish bond tone.
Bostic Flags Sticky Tariff Pass-Through, But Cuts Still in View
Atlanta Fed’s Bostic warned tariff-driven inflation could be “slow and persistent,” yet maintained a baseline view for one cut in 2025 and three more in 2026.
Fed remains divided, with dovish voices growing louder, while Powell stays noncommittal.
Trade Diplomacy Shifts Gears
Canada dropped its digital services tax to restart trade talks, with a July 21 target date set.
The EU now appears open to Trump’s 10% universal tariff proposal in exchange for sector-specific exemptions.
The July 9 US trade deadline with key partners still looms as a material macro event.
Economic Data Remains Mixed, But Not Derailing
Chicago PMI: 40.4 vs 43.0 est → signals ongoing weakness in regional manufacturing.
Dollar index hit lowest level since March 2022.
Treasuries rallied further, pushing the 10-year yield down to 4.24%.
Final Word: Rotation Signals Defense, Not Distress
Tuesday’s modest gain capped a historic Q2 for the S&P 500, with a defensive tilt emerging as markets digest valuations, geopolitics, and tariff policy risks. Breadth narrowed, and leadership shifted to rate-sensitive names, signaling growing caution without broader risk-off pressure. With trade deadlines, inflation reports, and earnings season ahead, the setup into July remains asymmetric and sensitive to any surprises on the jobs or tariffs front.
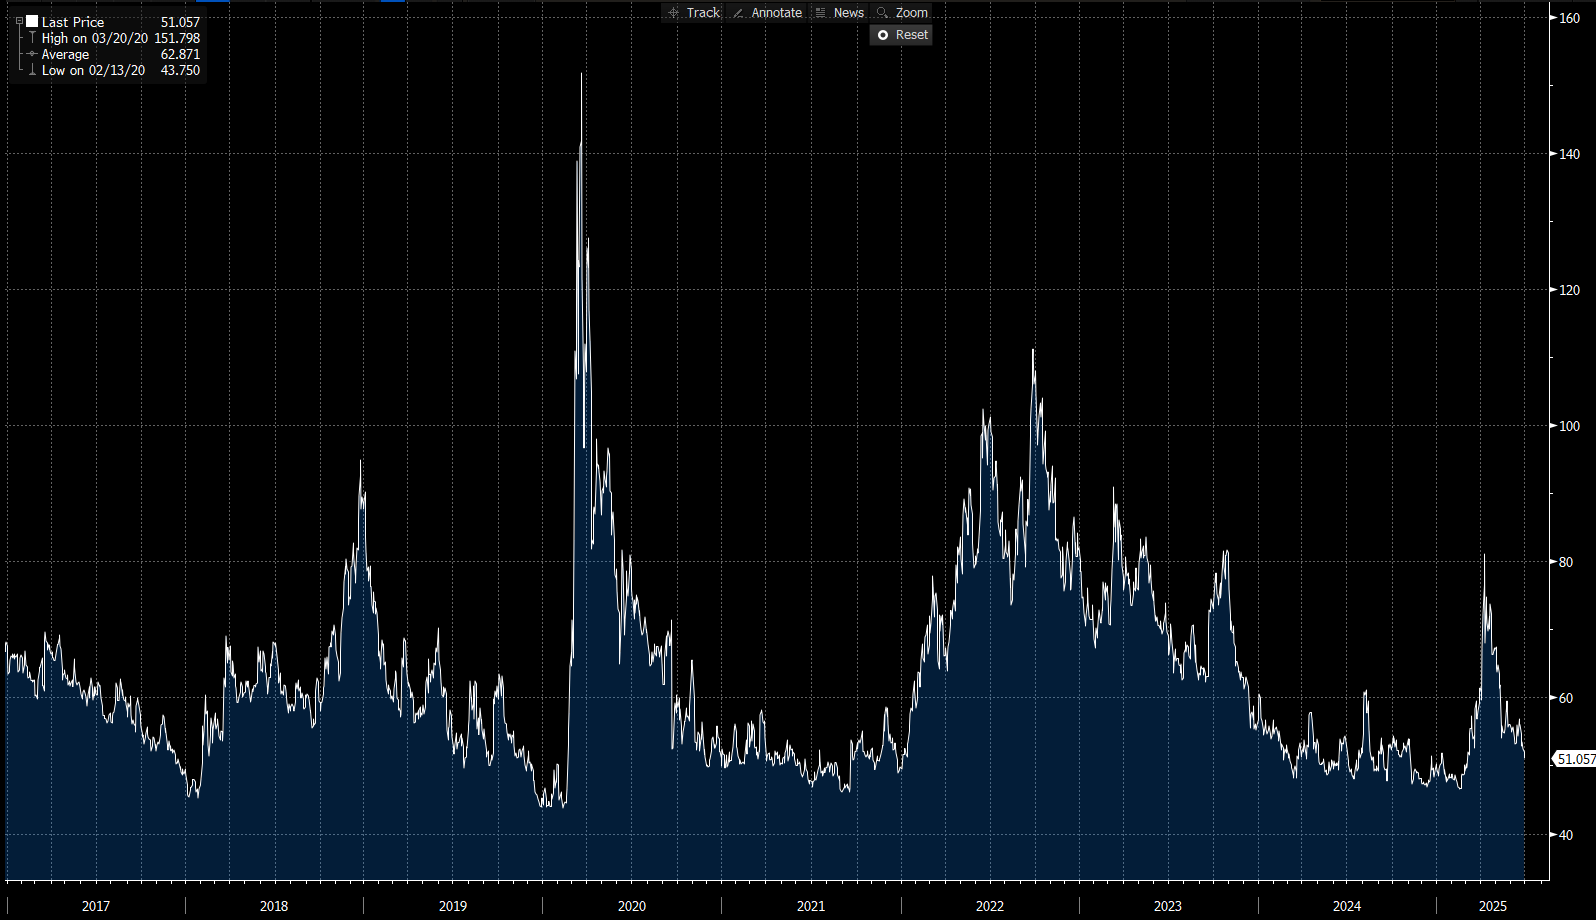
US IG Credit Wrap — Spreads Drift to 51.06 bp as Soft Macro, Policy Gridlock Anchor Risk Appetite
Current Spread: 51.06 bp | 5-Year Average: 62.87 bp
US investment-grade (IG) credit spreads eased slightly to 51.06 bp, slipping back toward multi-year tights as investors stayed pinned to a cautious, data-watching posture. Despite strength in equities and a historic quarter-end for the S&P 500, IG credit markets remain tethered to soft consumption data, policy ambiguity, and a lack of conviction around trade execution. The macro fog rather than fear is keeping spreads rangebound near post-COVID lows.
Credit Context
< 60 bp: Stable, duration-friendly range supporting insurance and liability-driven investment (LDI) strategies.
60–70 bp: Neutral-to-cautious positioning recommended amid tariff uncertainties and macroeconomic volatility.
> 90 bp: Significant market distress currently unlikely without a major escalation in geopolitical or macroeconomic shocks.
Macro Overlay: Data Decelerates, Fed Hesitates, Trade Deals Drag
Consumer Fatigue Stands Out
Real personal consumption fell 0.3% in May the steepest decline YTD—while income declined 0.4% and savings dipped to 4.5%. These trends reinforce a weakening domestic demand backdrop, especially in services and discretionary segments. This dynamic undercuts the case for spread compression, even as equities press higher.
Powell & Bostic Emphasize Patience Over Panic
Chair Powell reiterated the Fed’s “luxury of time,” while Atlanta Fed’s Bostic acknowledged that tariff pass-through might be “slow but sticky,” implying sustained pressure on prices. Both continued to frame July as too soon, reinforcing the September base-case cut. The broader FOMC remains split but not reactive.
Trade Diplomacy Ramps, but Enforcement Lags
Canada officially repealed its digital tax to restart negotiations with the US, while the EU signaled willingness to accept a 10% universal tariff pending exemptions for key sectors. Despite these headline wins, enforcement credibility and structural impact remain murky.
Inflation: Stable, but Not Settled
Core PCE (May): +0.2% m/m | +2.7% y/y
UMich 1Y/5Y inflation expectations: down to 5.0% and 4.0%, respectivelyWhile headline prints were firm, expectations eased. Services inflation slowed, durable goods deflation resumed. The IG market sees the backdrop as supportive for carry, but not yet compelling enough to drive duration extension.
Final Word: Credit Anchored, Not Chasing
At 51.06 bp, US IG spreads are reflecting a market that’s clear-eyed about macro risk, but not fearful. There’s little momentum for further compression with consumers slowing, the Fed stuck in wait-and-see, and the trade story long on headlines but short on substance.
Mag7 Model:
See the intro published for how to use the Mag7 models here: Link
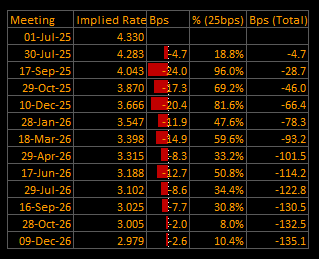
Short-End Rates Wrap — Market Prices Deeper Easing Cycle with –135.1 bp Cuts by Dec 2026 as Fed Caution Meets Soft Macro
Traders continue to lean into the Fed’s eventual pivot, with OIS now pricing –135.1 basis points of cumulative rate cuts by December 2026 a fresh cycle low for implied terminal policy. Chair Powell offered little fresh guidance in his latest remarks, maintaining a cautious, data-dependent posture. But with consumption faltering, tariff risk contained, and the labor market showing signs of softening, the market is already moving ahead of the Fed’s language.
OIS-Implied Easing Path
Front-End Expectations
01-Jul-25: 4.330% → No live risk
30-Jul-25: 4.283% (–4.7 bp) → ~19% probability → July still live but not base case
17-Sep-25: 4.043% (–24.0 bp) → ~96% probability → September cut now fully priced
Year-End 2025 Outlook
10-Dec-25: 3.656% → –66.4 bp cumulative → Market sees roughly 2.5 cuts by year-end
Full Cycle
09-Dec-26: 2.979% → –135.1 bp → Market now fully committed to lower-for-longer glide path
Macro Overlay: Steady Fed, Weak Consumer, Trade Relief
1. Powell Stays Careful, Market Keeps Moving
Chair Powell remained non-committal, emphasizing “uncertainty” around tariff pass-throughs and cautioning against premature action. His stance continues to anchor expectations around September, with the market pricing July as an optional tail risk.
“We’re in no rush... but if inflation stays contained, we’ll adjust.”
2. Consumer Cracks Deepen, Growth Narrative Softens
May Personal Spending: –0.3% m/m → weakest of 2025
May Personal Income: –0.4% m/m → sharpest drop since 2021
Savings Rate: Down to 4.5% → thinnest household buffer in years
Q1 GDP: Revised to –0.5% annualized → dragged by services
The data increasingly suggest domestic demand is sputtering. The Fed can afford to wait, but the market sees little reason for delay beyond optics.
3. Trade De-escalates as Canada, EU, China Make Progress
Canada: Dropped digital tax → bilateral talks resume
EU: Poised to accept 10% universal tariff framework with carve-outs
China: Rare earths deal finalized; further agreements expected post-July 4
These developments ease tariff anxiety without stoking inflation risk. Powell called the tariff effects “hard to model” a reason to wait, but not to tighten.
4. Inflation Still Contained
May Core PCE: +0.2% m/m | +2.7% y/y
UMich Inflation Expectations: 1Y: 5.0% ↓ | 5–10Y: 4.0% ↓
Sticky services remain an issue, but forward-looking expectations are easing. No data suggests the Fed is behind the curve quite the opposite.
Final Word: Cuts Coming, Even If Powell Won’t Say It
September remains base case (~96% probability)
July stays alive, but lacks momentum (~19% chance)
Cumulative easing of –135.1 bp now priced
Markets have moved ahead of Powell’s script. Credit is tight, consumers are fading, and inflation is behaving. Powell may be waiting for confirmation, but traders are already pricing the outcome a steady glide path lower, beginning this fall.
Tactical Portfolio
Morning Trade(s) and Market thread
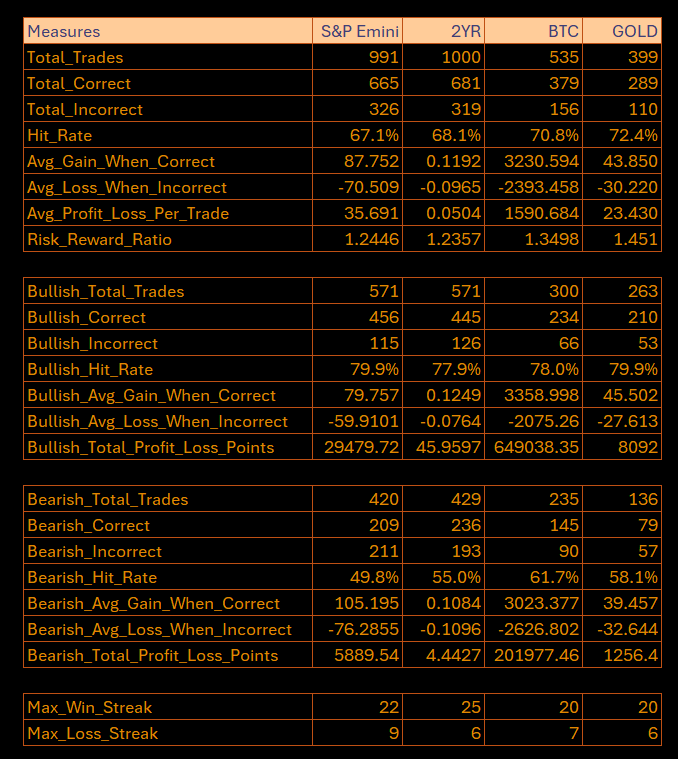
Macro Regime and Positioning Premiums - Strategies:
The following models are specifically designed to predict directional price moves over a 5-day horizon. Each model incorporates key macro drivers to project forward-looking price directionality.
The visual below illustrates historical model performance across both bullish and bearish signals.
Internally, this serves as a core input into decisions around initiating new risk and managing existing positions.
As of market close, the strategies have updated, and here are the new directional skews:
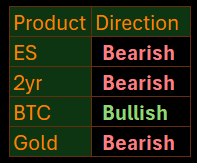
Equities (ES)
==================================================
Technical Levels for ES1 Index
==================================================
Daily Range: 30.64
Resistance Levels (Above Open):
------------------------------
R5: 6408.85 | Offset: +155.10
R4: 6325.82 | Offset: + 72.07
R3: 6314.00 | Offset: + 60.25
R2: 6289.75 | Offset: + 36.00
R1: 6271.75 | Offset: + 18.00 *
------------------------------
Open Price: 6253.75
------------------------------
Support Levels (Below Open):
------------------------------
S1: 6229.50 | Offset: - 24.25 *
S2: 6205.25 | Offset: - 48.50
S3: 6190.94 | Offset: - 62.81
S4: 6187.25 | Offset: - 66.50
S5: 6181.68 | Offset: - 72.07
==================================================
* Denotes intraday level, likely tested
(In the top panel, the total impulse of macro drivers and positioning is illustrated in its strength. The greater the strength in the move, the higher the probability and amplitude of the move that is likely to take place. The bottom panel illustrates if the skew is either bullish or bearish probability.)
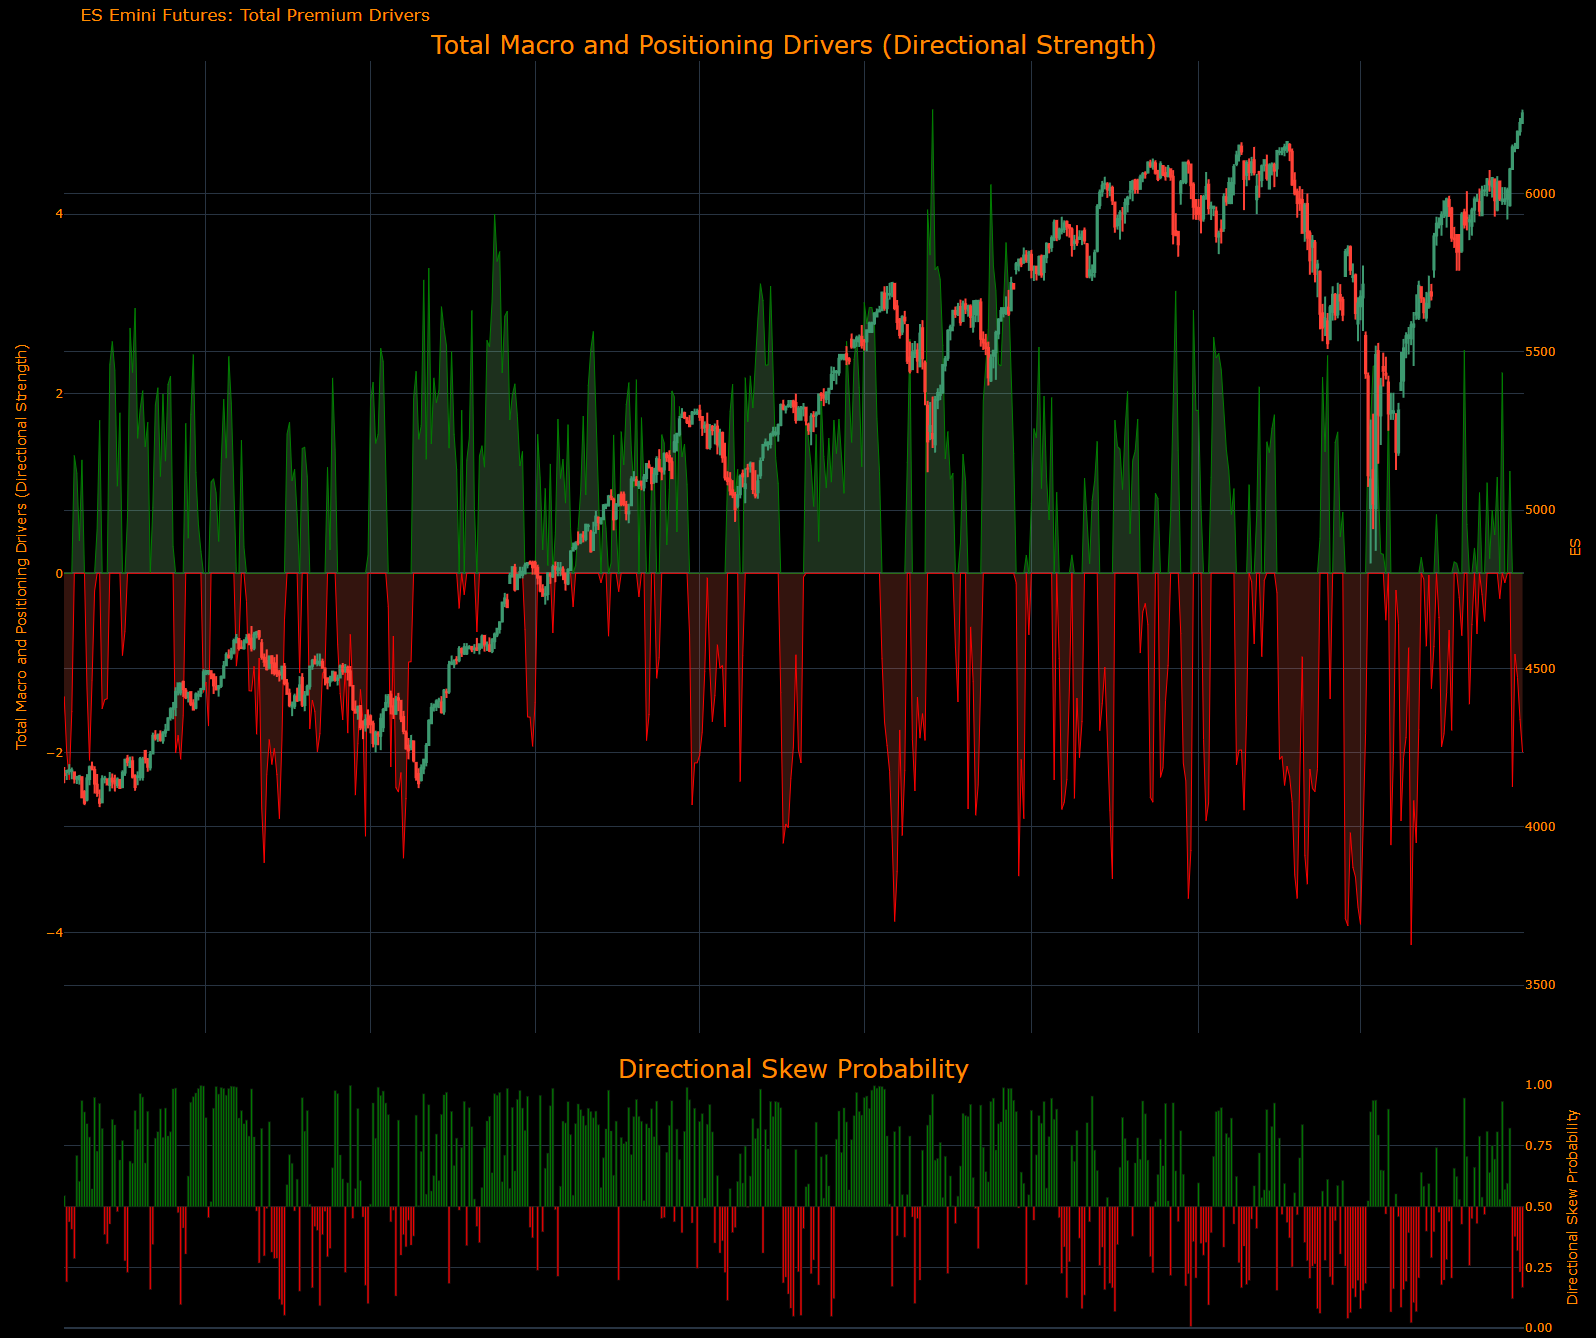
(The next three charts show the underlying contribution for the Total Macro and Positioning Drivers in the chart above. These allow you to see the WHY behind moves.)
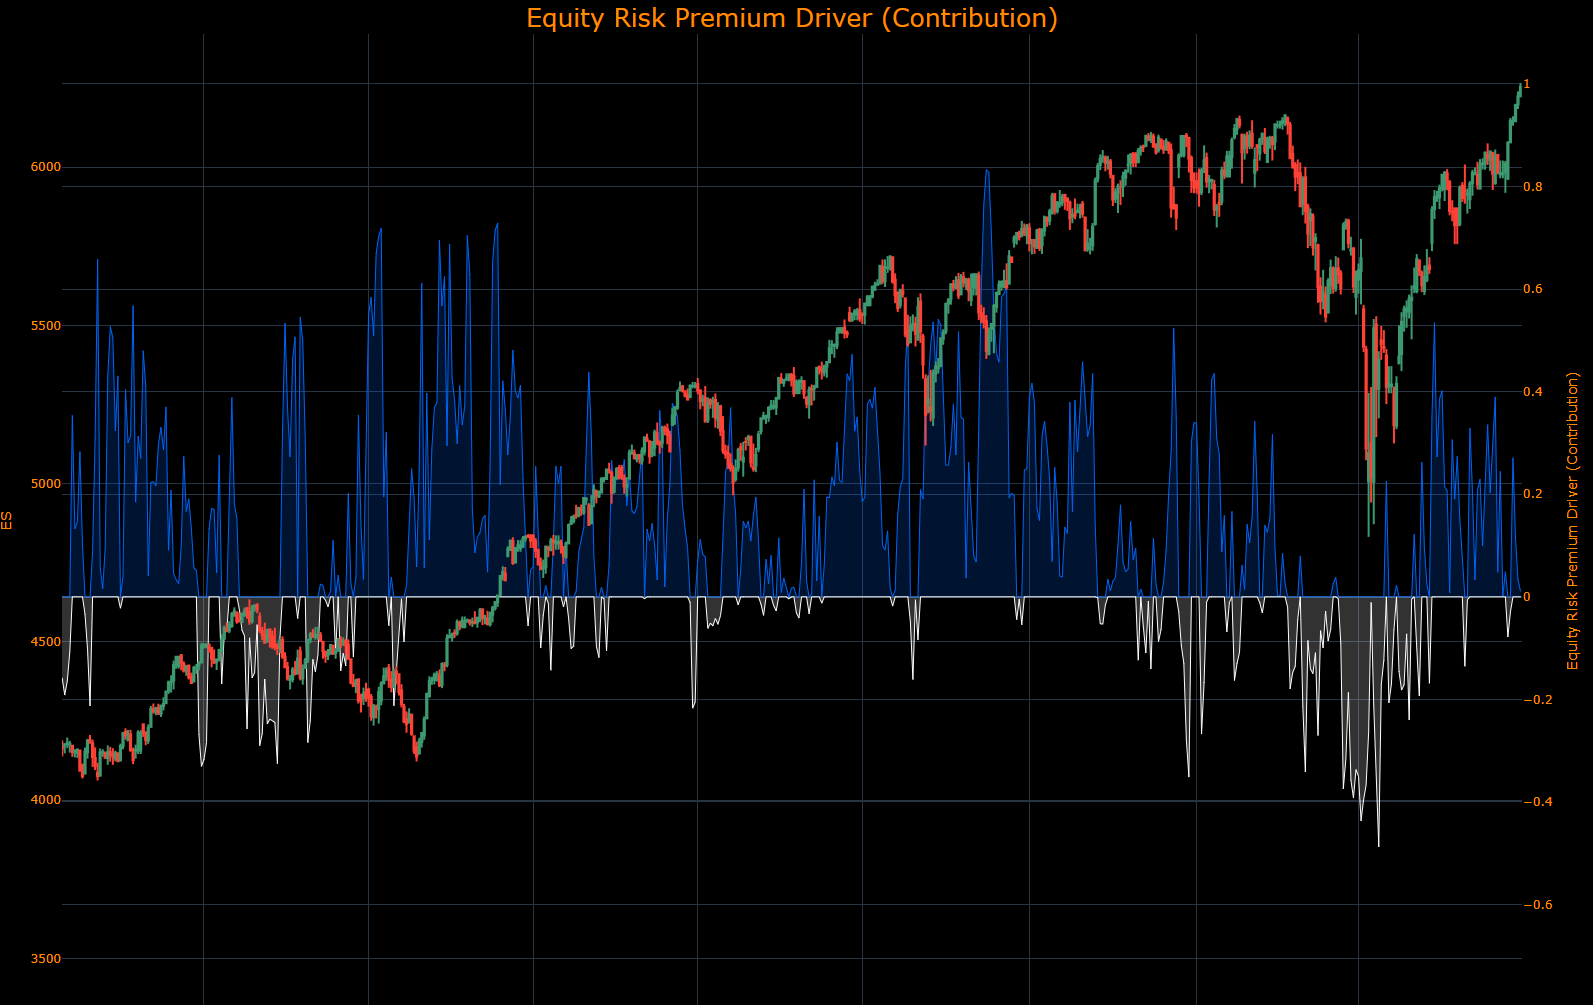
(The Equity Risk Premium contribution aggregates major macro factors and the strength of factors driving equity risk premiums. In the same manner, the higher the contribution moves, the more strength the drivers have in pushing the index in a specific direction.)
(The Positioning Premium Driver contribution identifies HOW the drivers of positioning are contributing to equity returns. In the same manner, the higher the contribution moves, the more strength the drivers have in pushing the index in a specific direction.)
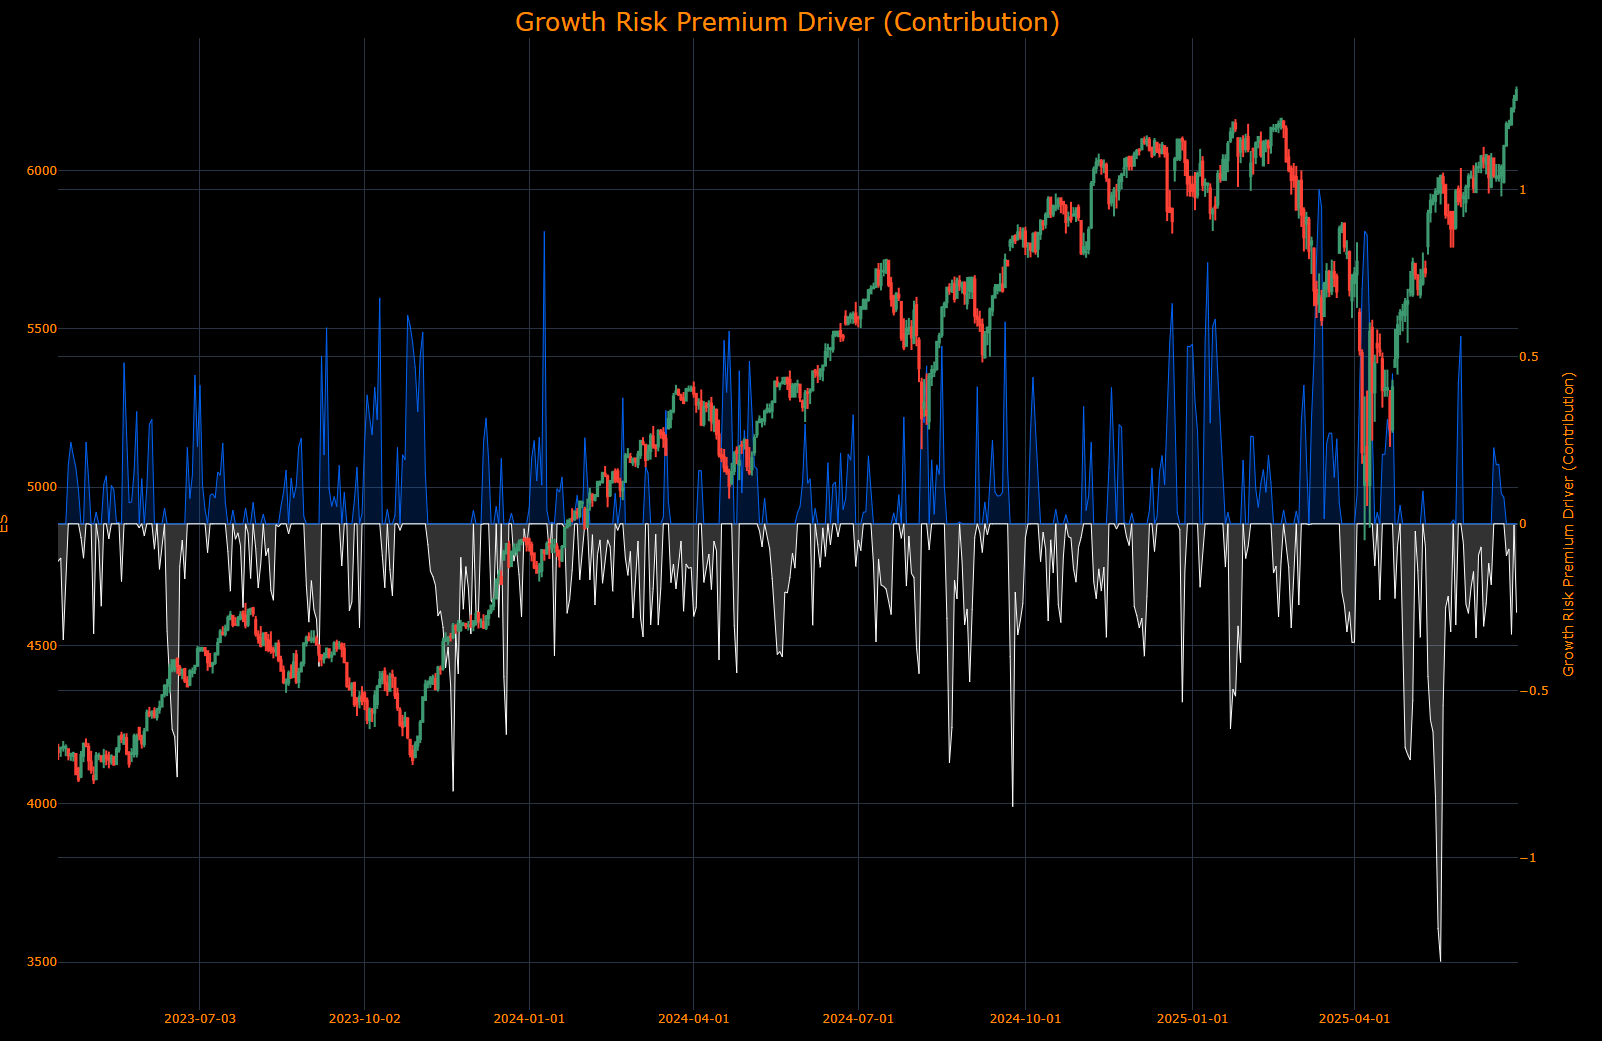
(The Growth Risk Premium Driver contribution identifies HOW the drivers of growth are contributing to equity returns. In the same manner, the higher the contribution moves, the more strength the drivers have in pushing the index in a specific direction.)
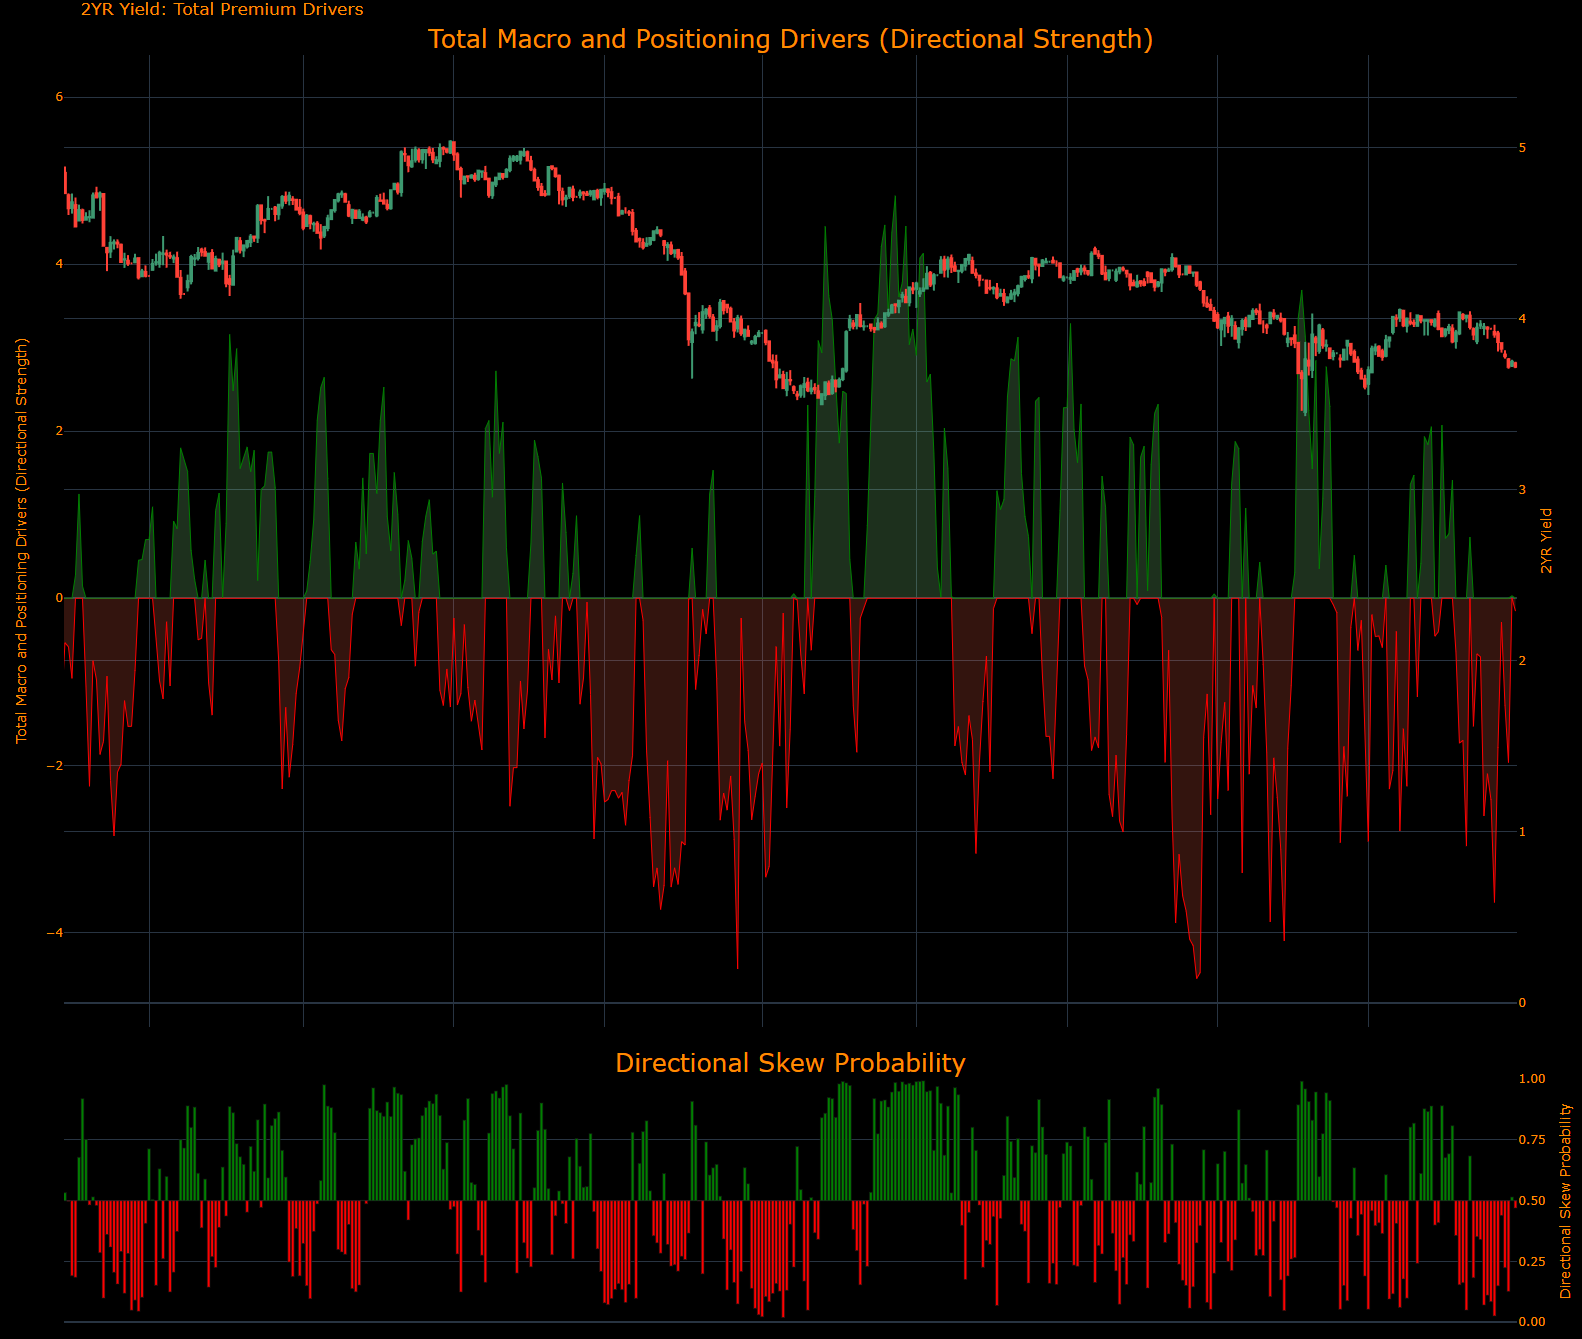
2-Year Interest Rate
==================================================
Technical Levels for USGG2YR Index
==================================================
Daily Range: 0.03
Resistance Levels (Above Open):
------------------------------
R5: 3.78 | Offset: + 0.06
R4: 3.78 | Offset: + 0.06
R3: 3.76 | Offset: + 0.04
R2: 3.76 | Offset: + 0.04
R1: 3.74 | Offset: + 0.02 *
------------------------------
Open Price: 3.72
------------------------------
Support Levels (Below Open):
------------------------------
S1: 3.70 | Offset: - 0.01 *
S2: 3.69 | Offset: - 0.03 *
S3: 3.67 | Offset: - 0.05
S4: 3.66 | Offset: - 0.06
S5: 3.56 | Offset: - 0.16
==================================================
* Denotes intraday level, likely tested
(In the top panel, the total impulse of macro drivers and positioning is illustrated in its strength. The greater the strength in the move, the higher the probability and amplitude of the move that is likely to take place. The bottom panel illustrates if the skew is either bullish or bearish probability.)
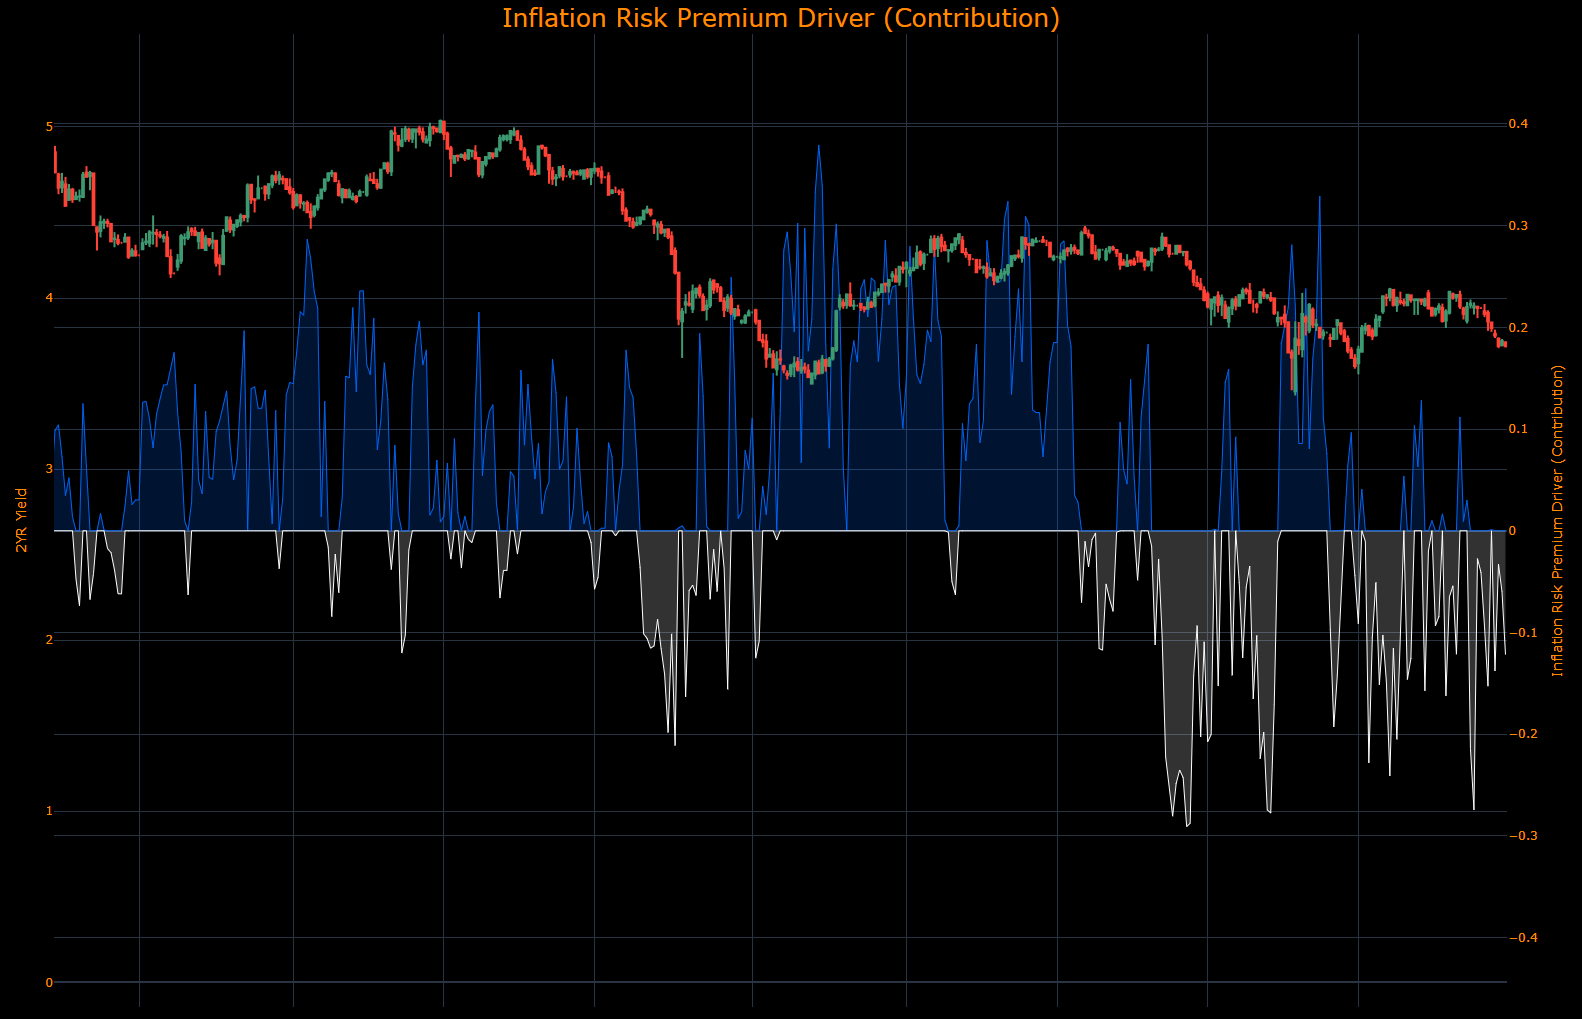
(The Inflation Risk Premium Driver contribution identifies HOW the drivers of inflation expectations are contributing to 2-year returns. In the same manner, the higher the contribution moves, the more strength the drivers have in pushing rates in a specific direction.)
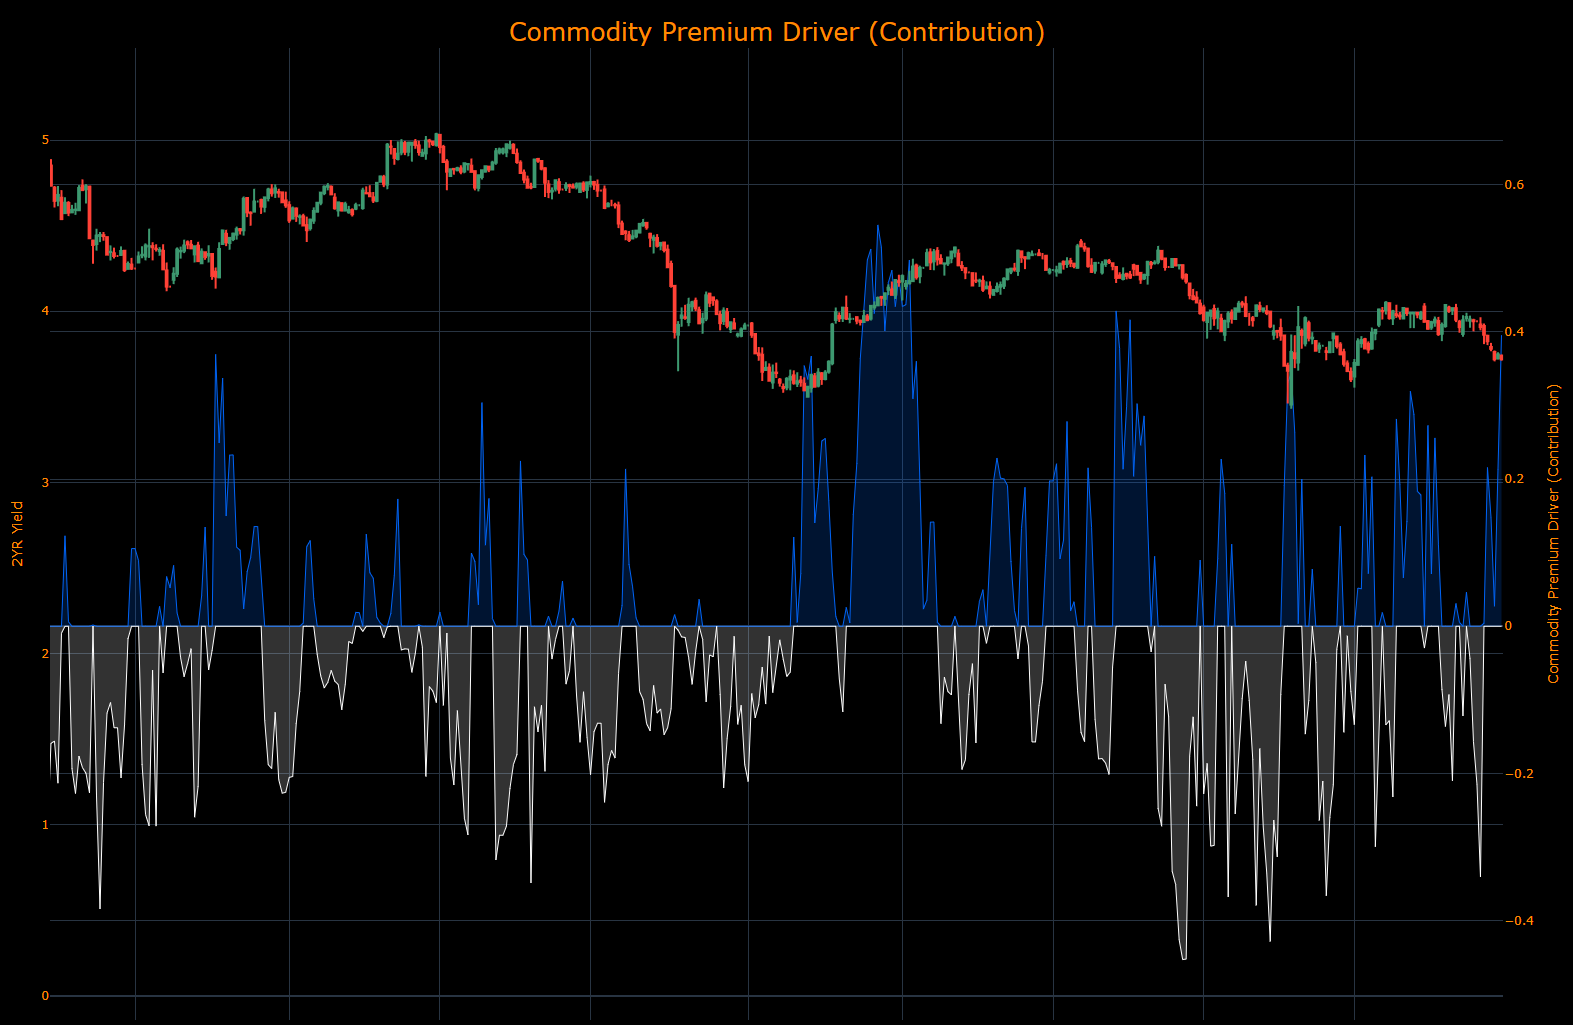
(The Commodity Premium Driver contribution identifies HOW the drivers of commodities are contributing to 2-year returns. In the same manner, the higher the contribution moves, the more strength the drivers have in pushing rates in a specific direction.)
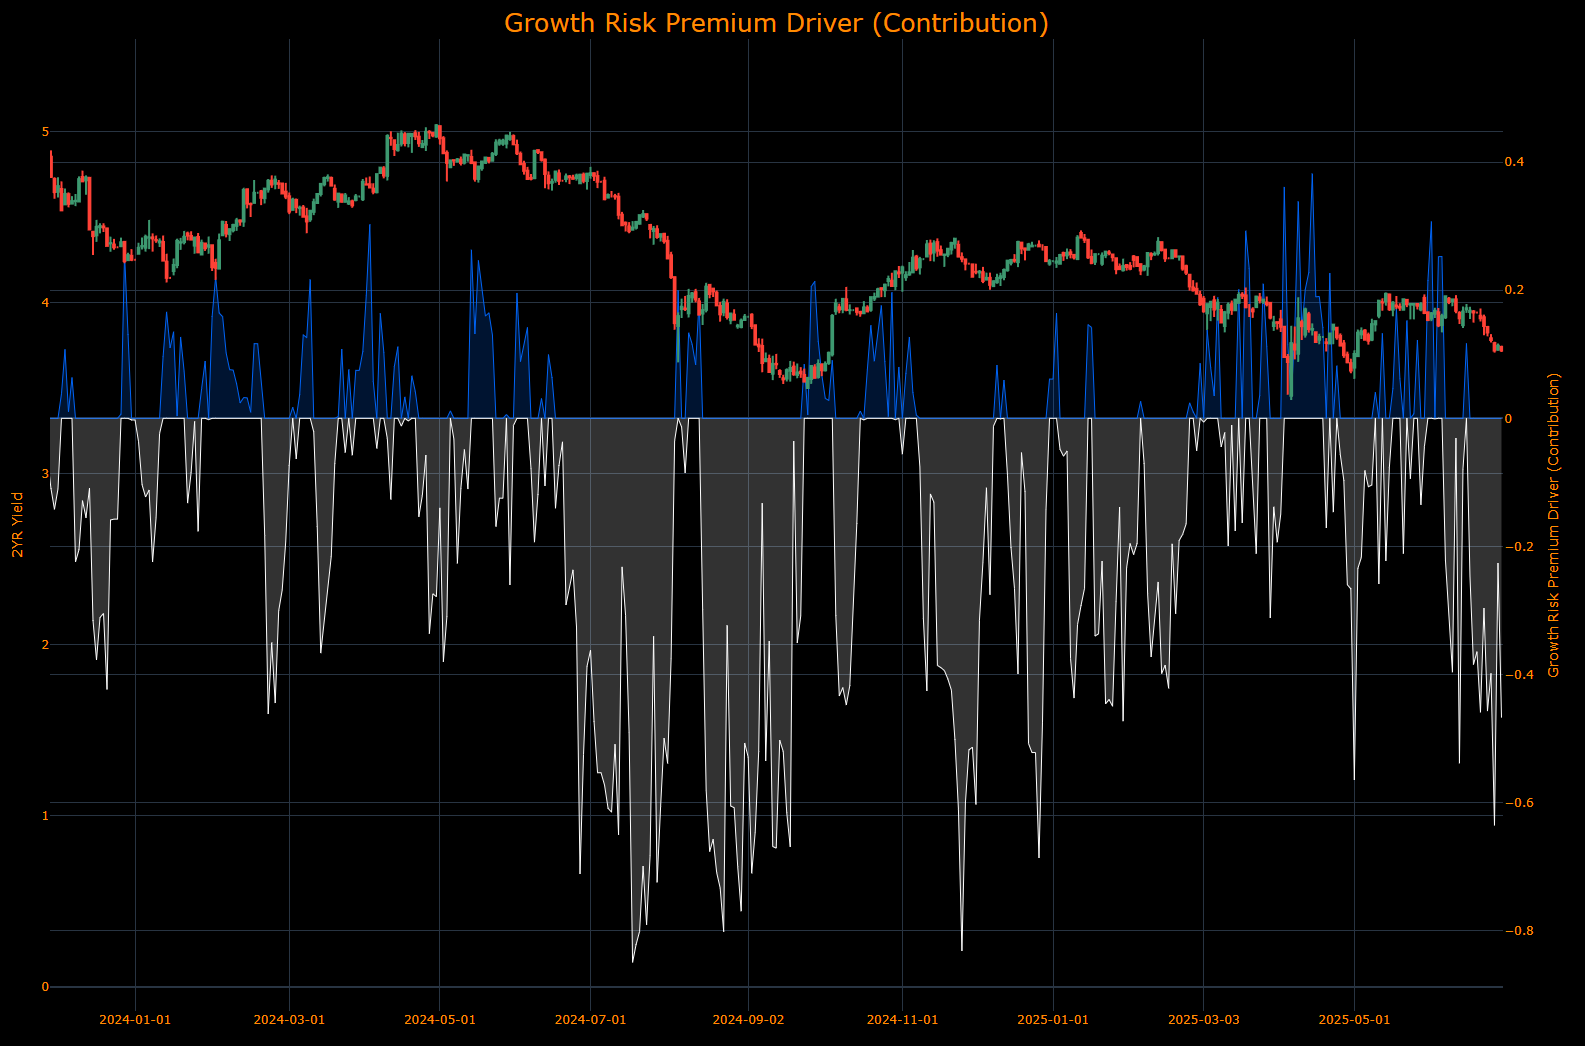
(The Growth Risk Premium Driver contribution identifies HOW the drivers of growth are contributing to 2-year returns. In the same manner, the higher the contribution moves, the more strength the drivers have in pushing rates in a specific direction.)
Gold
==================================================
Technical Levels for GC1 Comdty
==================================================
Daily Range: 24.24
Resistance Levels (Above Open):
------------------------------
R5: 3347.60 | Offset: + 39.90
R4: 3336.36 | Offset: + 28.66
R3: 3336.03 | Offset: + 28.33
R2: 3333.95 | Offset: + 26.25
R1: 3319.00 | Offset: + 11.30 *
------------------------------
Open Price: 3307.70
------------------------------
Support Levels (Below Open):
------------------------------
S1: 3267.80 | Offset: - 39.90
S2: 3264.93 | Offset: - 42.77
S3: 3232.11 | Offset: - 75.59
S4: 3222.17 | Offset: - 85.53
S5: 3193.83 | Offset: -113.87
==================================================
* Denotes intraday level, likely tested
In the top panel, the total impulse of macro drivers and positioning is illustrated in its strength. The greater the strength in the move, the higher the probability and amplitude of the move that is likely to take place. The bottom panel illustrates if the skew is either bullish or bearish probability.
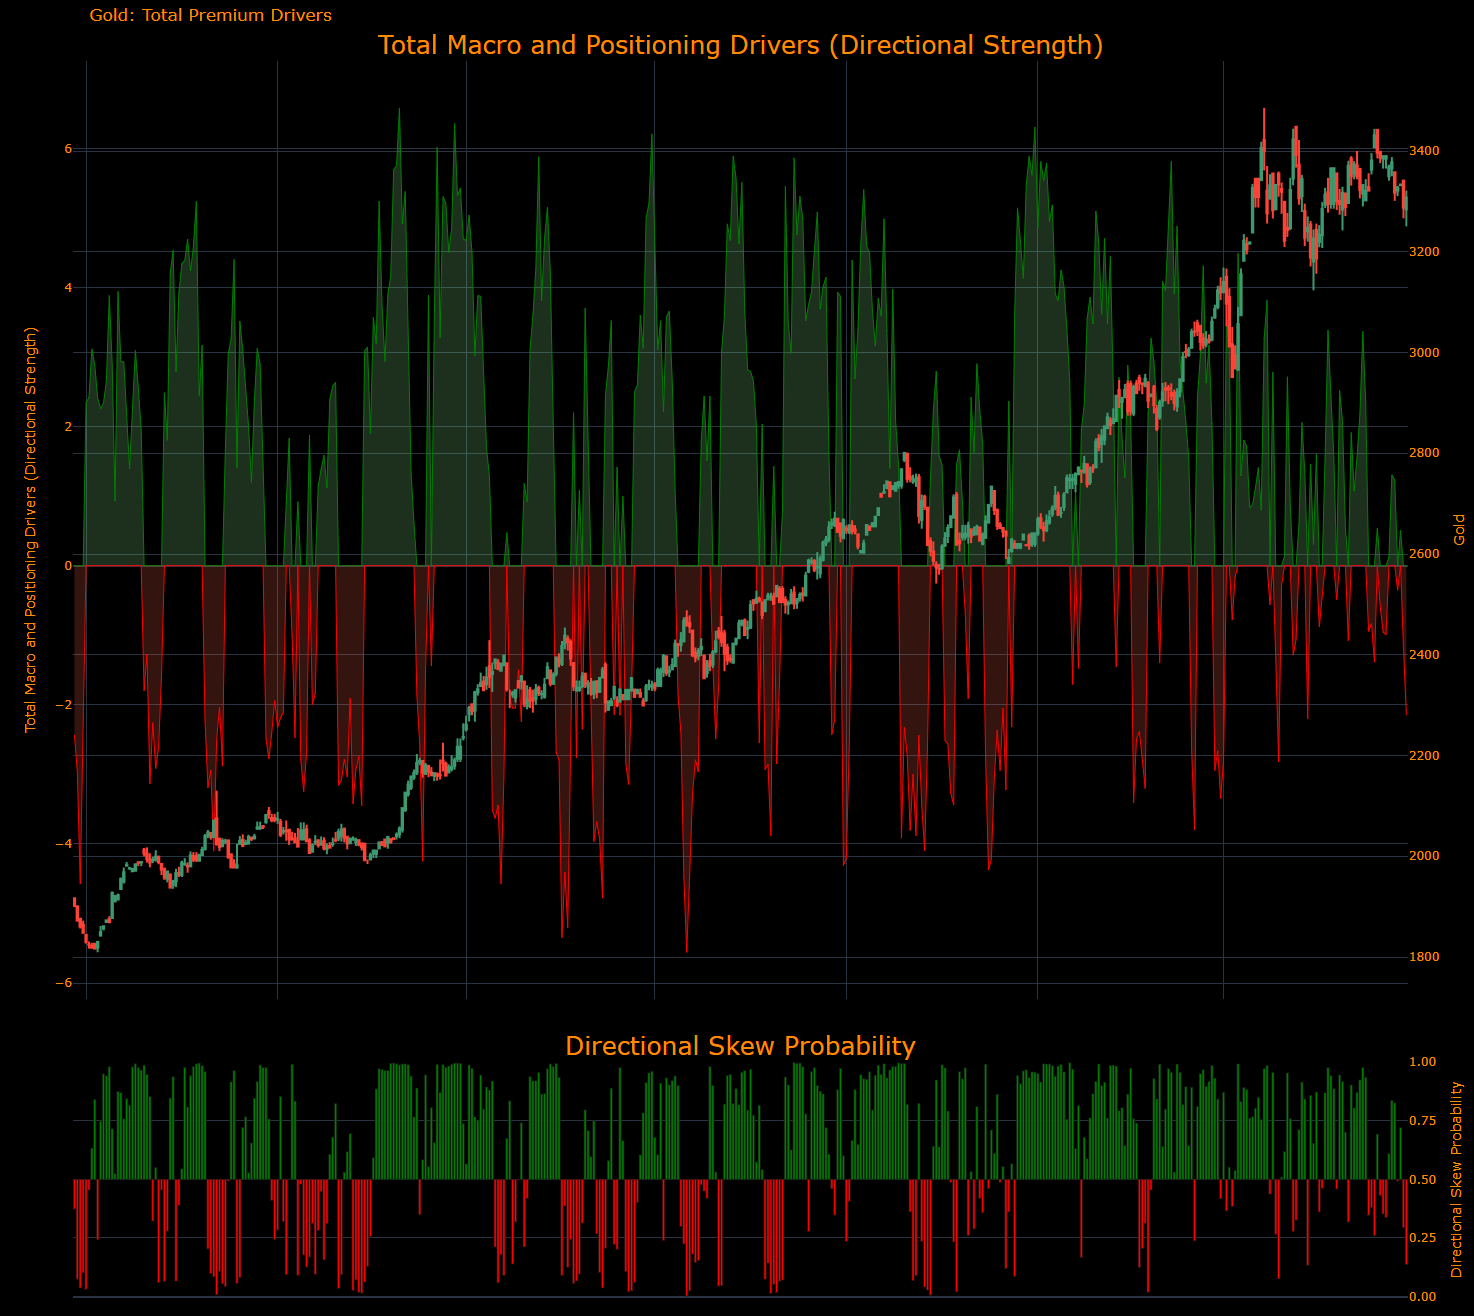
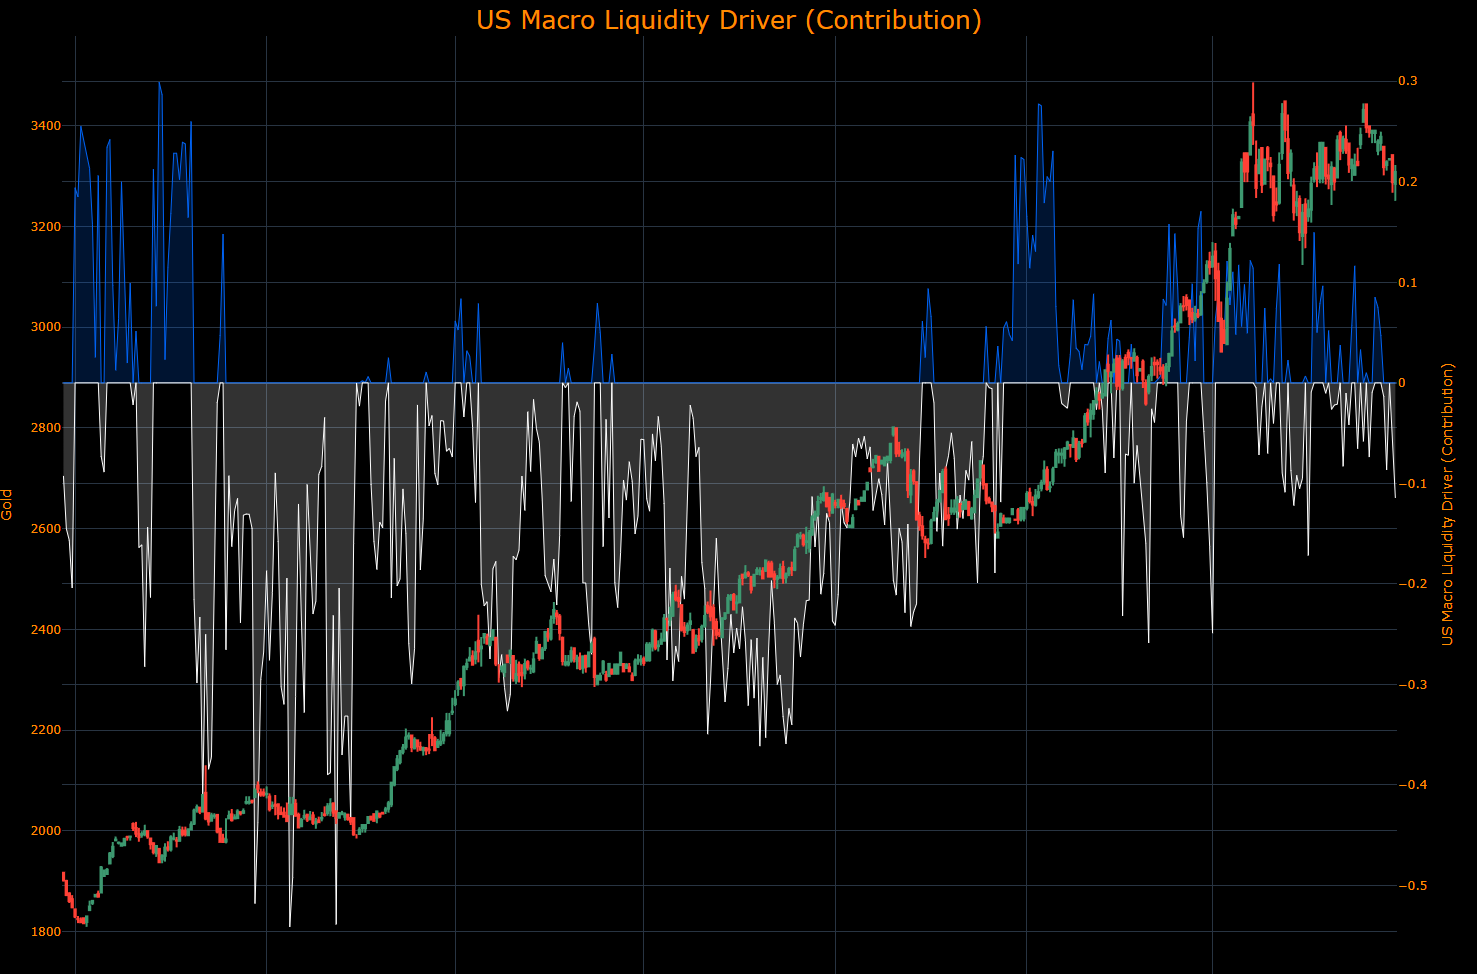
(The US Macro Liquidity Driver contribution identifies HOW the drivers of US liquidity are contributing to the returns of Gold. In the same manner, the higher the contribution moves, the more strength the drivers have in pushing gold in a specific direction.)
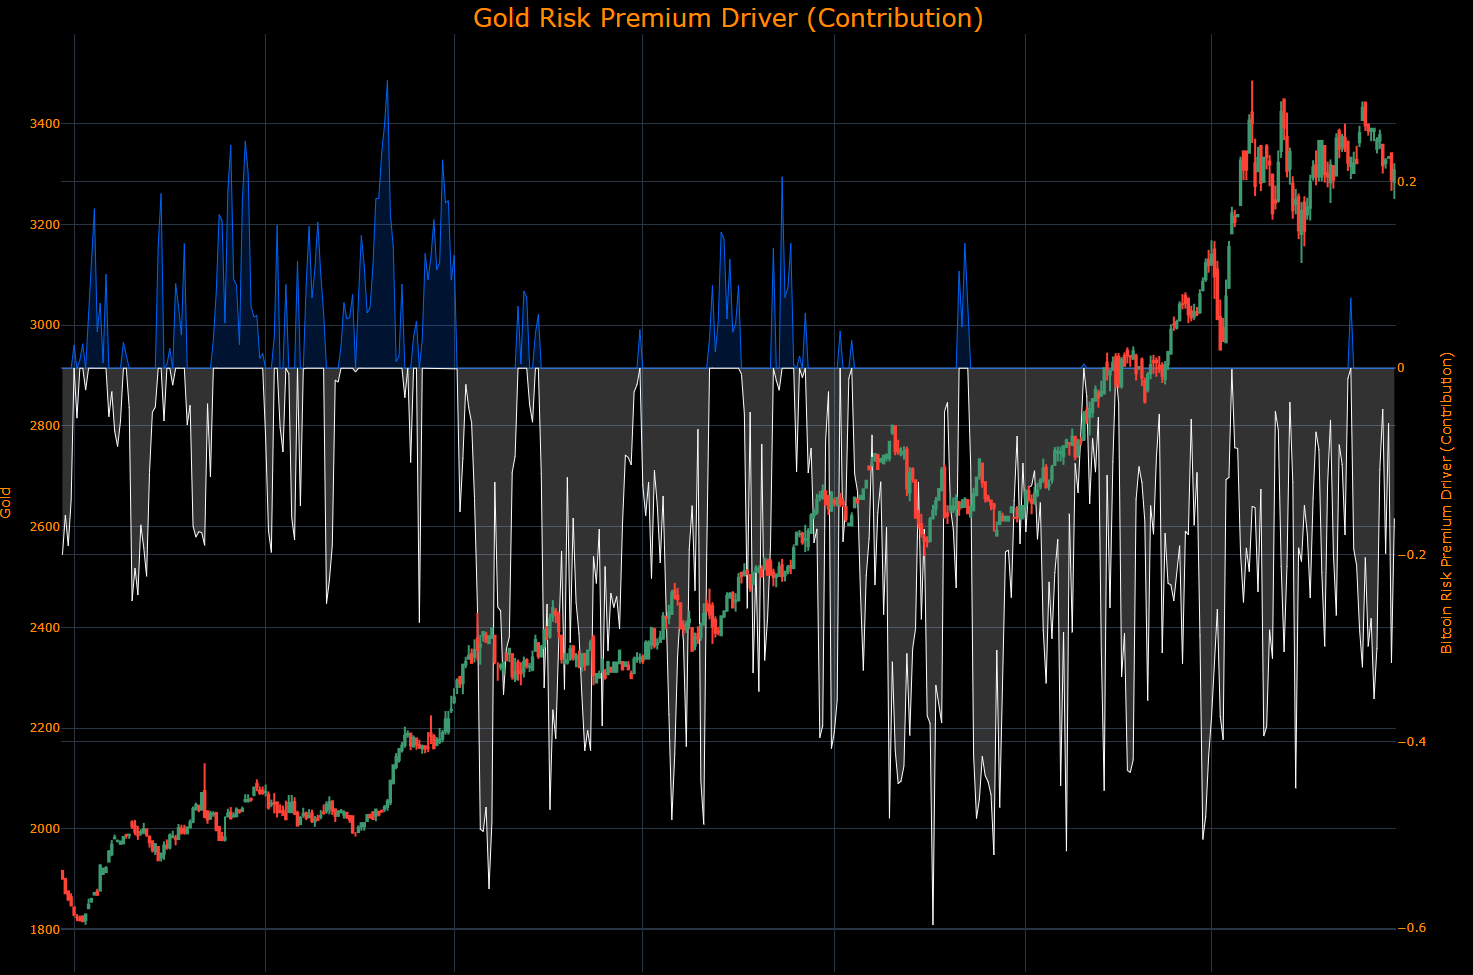
(The Gold Risk Premium Driver contribution identifies HOW the risk premium of gold is contributing to returns. In the same manner, the higher the contribution moves, the more strength the drivers have in pushing gold in a specific direction.)
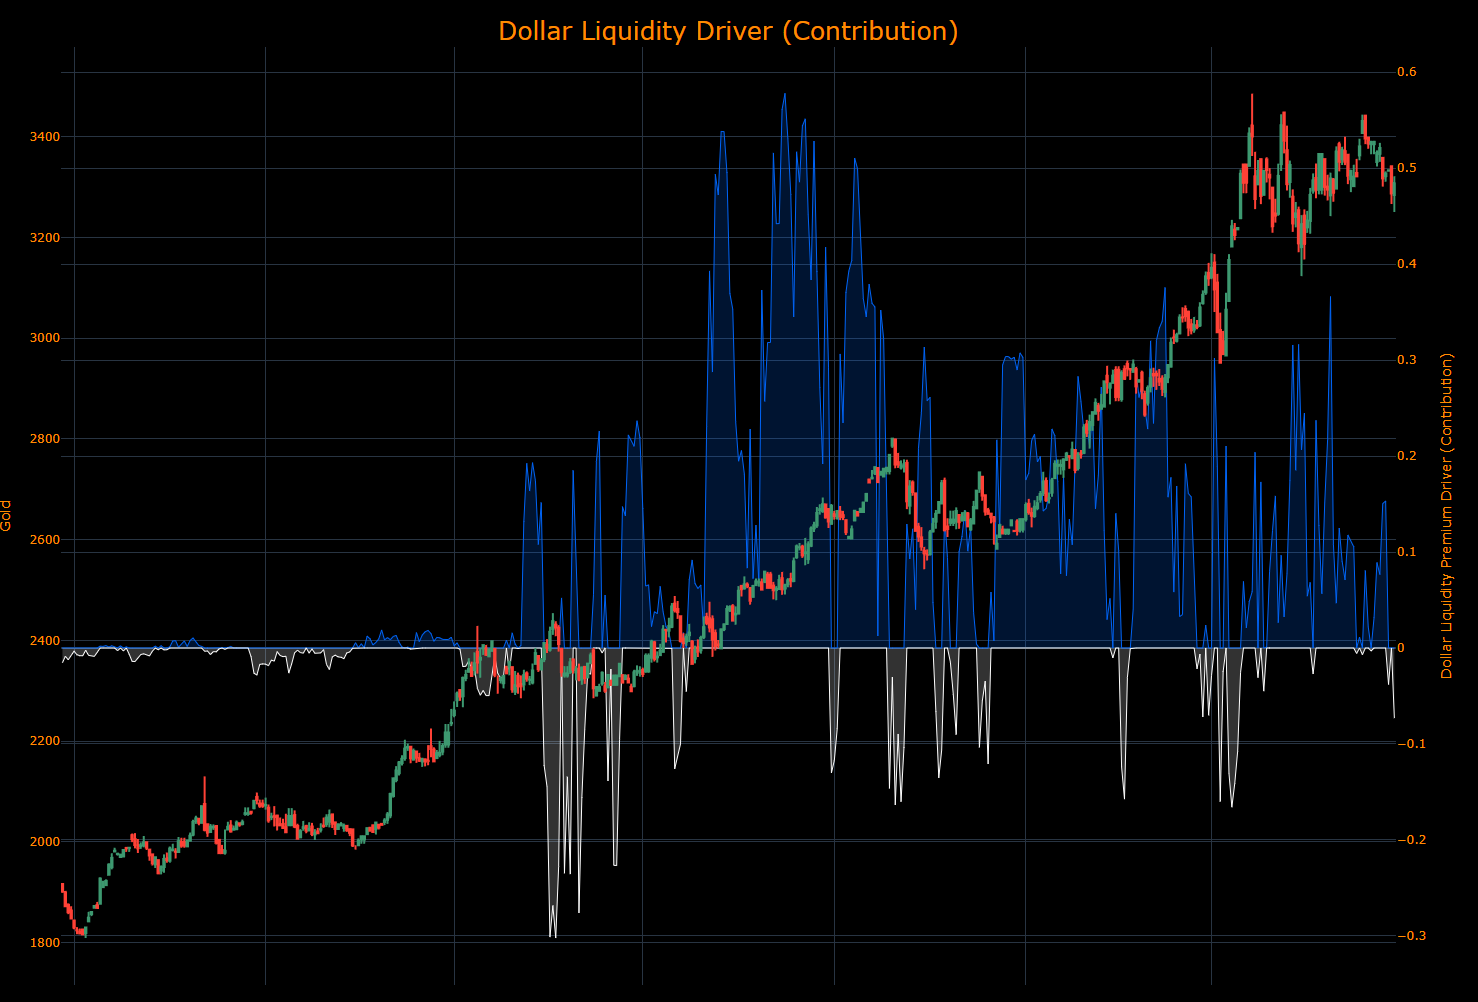
(The Dollar Liquidity Driver contribution identifies HOW the drivers of dollar liquidity are contributing to the returns of Gold. In the same manner, the higher the contribution moves, the more strength the drivers have in pushing gold in a specific direction.)
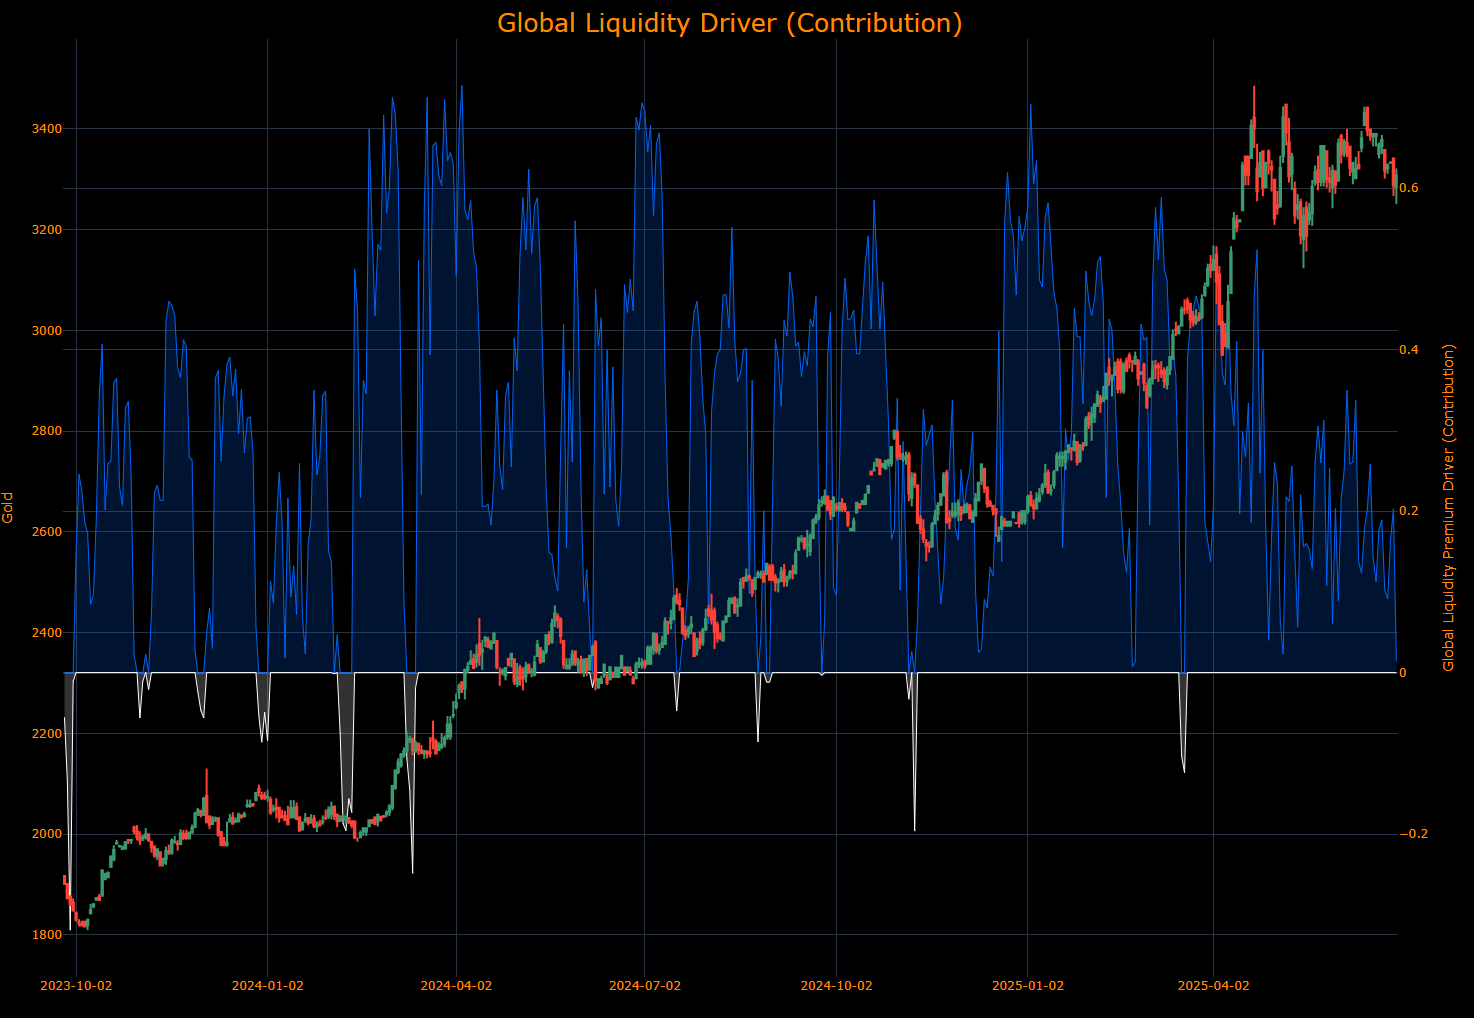
The Global Liquidity Driver contribution identifies HOW the drivers of global liquidity are contributing to the returns of Gold. In the same manner, the higher the contribution moves, the more strength the drivers have in pushing gold in a specific direction
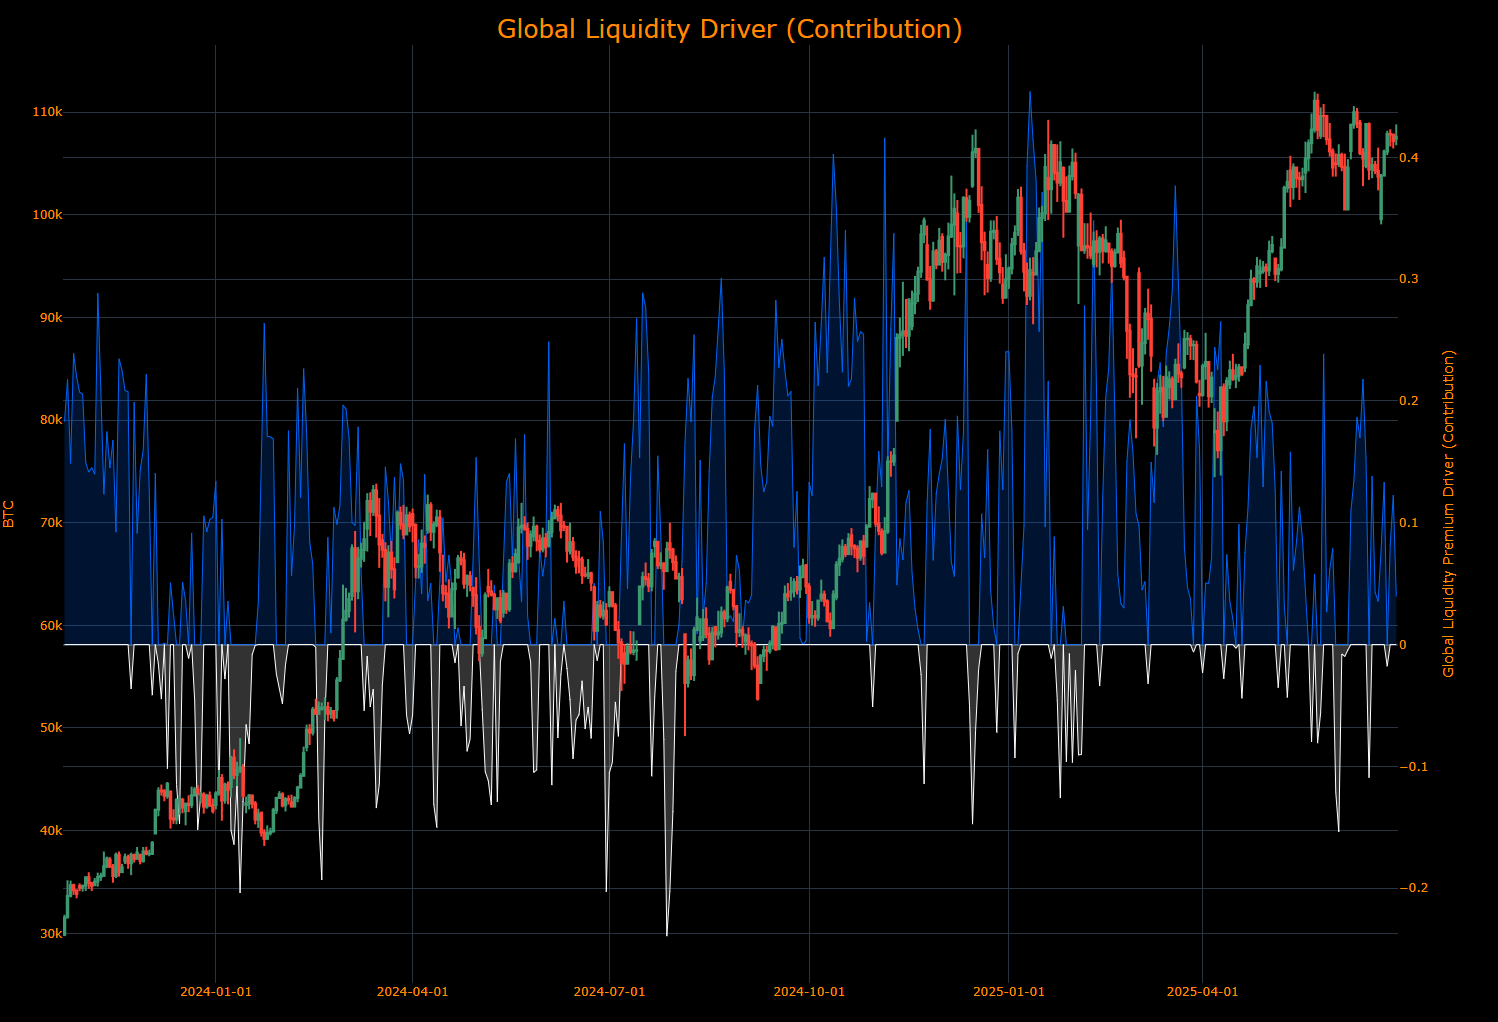
Bitcoin
==================================================
Technical Levels for XBTUSD Curncy
==================================================
Daily Range: 1636.75
Resistance Levels (Above Open):
------------------------------
R5: 114068.98 | Offset: +6682.56
R4: 109629.97 | Offset: +2243.55
R3: 107804.88 | Offset: +418.46 *
R2: 107717.63 | Offset: +331.21 *
R1: 107552.03 | Offset: +165.61 *
------------------------------
Open Price: 107386.42
------------------------------
Support Levels (Below Open):
------------------------------
S1: 107299.18 | Offset: - 87.24 *
S2: 107244.34 | Offset: -142.08 *
S3: 107211.93 | Offset: -174.49 *
S4: 107046.33 | Offset: -340.09 *
S5: 106676.66 | Offset: -709.76 *
==================================================
* Denotes intraday level, likely tested
In the top panel, the total impulse of macro drivers and positioning is illustrated in its strength. The greater the strength in the move, the higher the probability and amplitude of the move that is likely to take place. The bottom panel illustrates if the skew is either bullish or bearish probability.
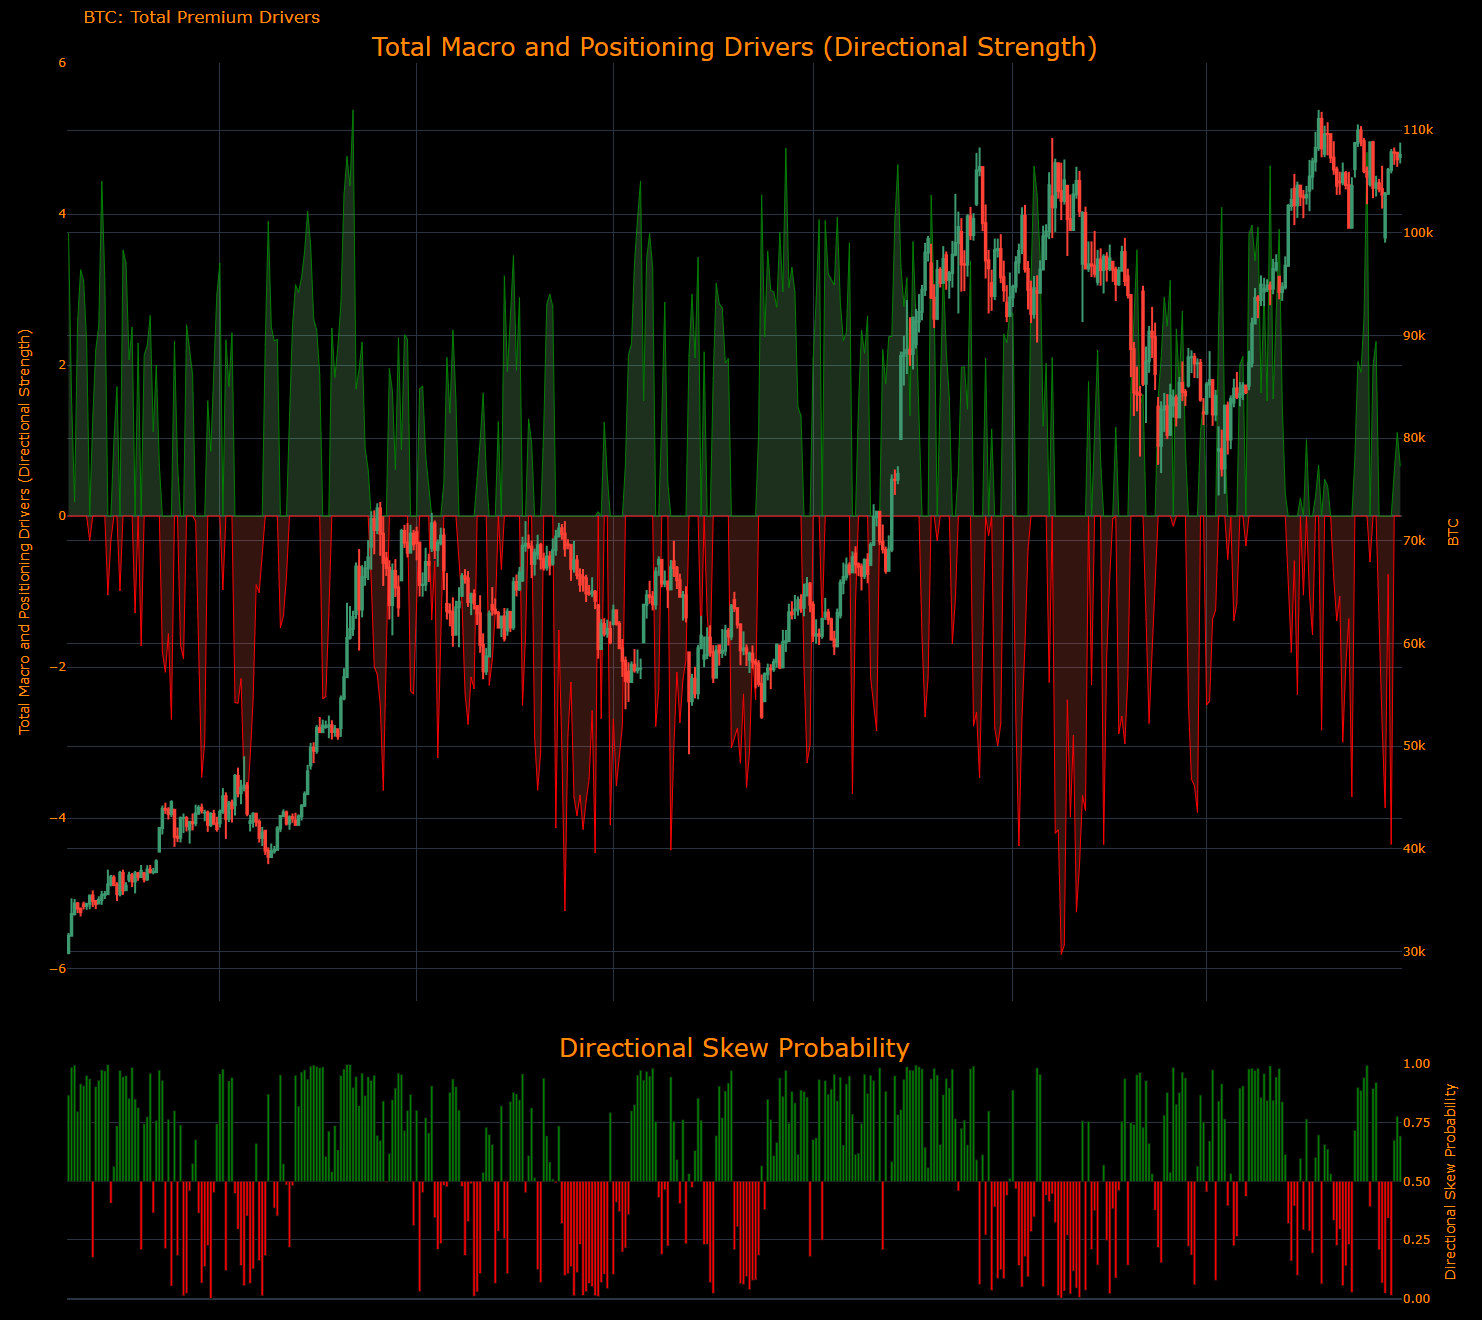
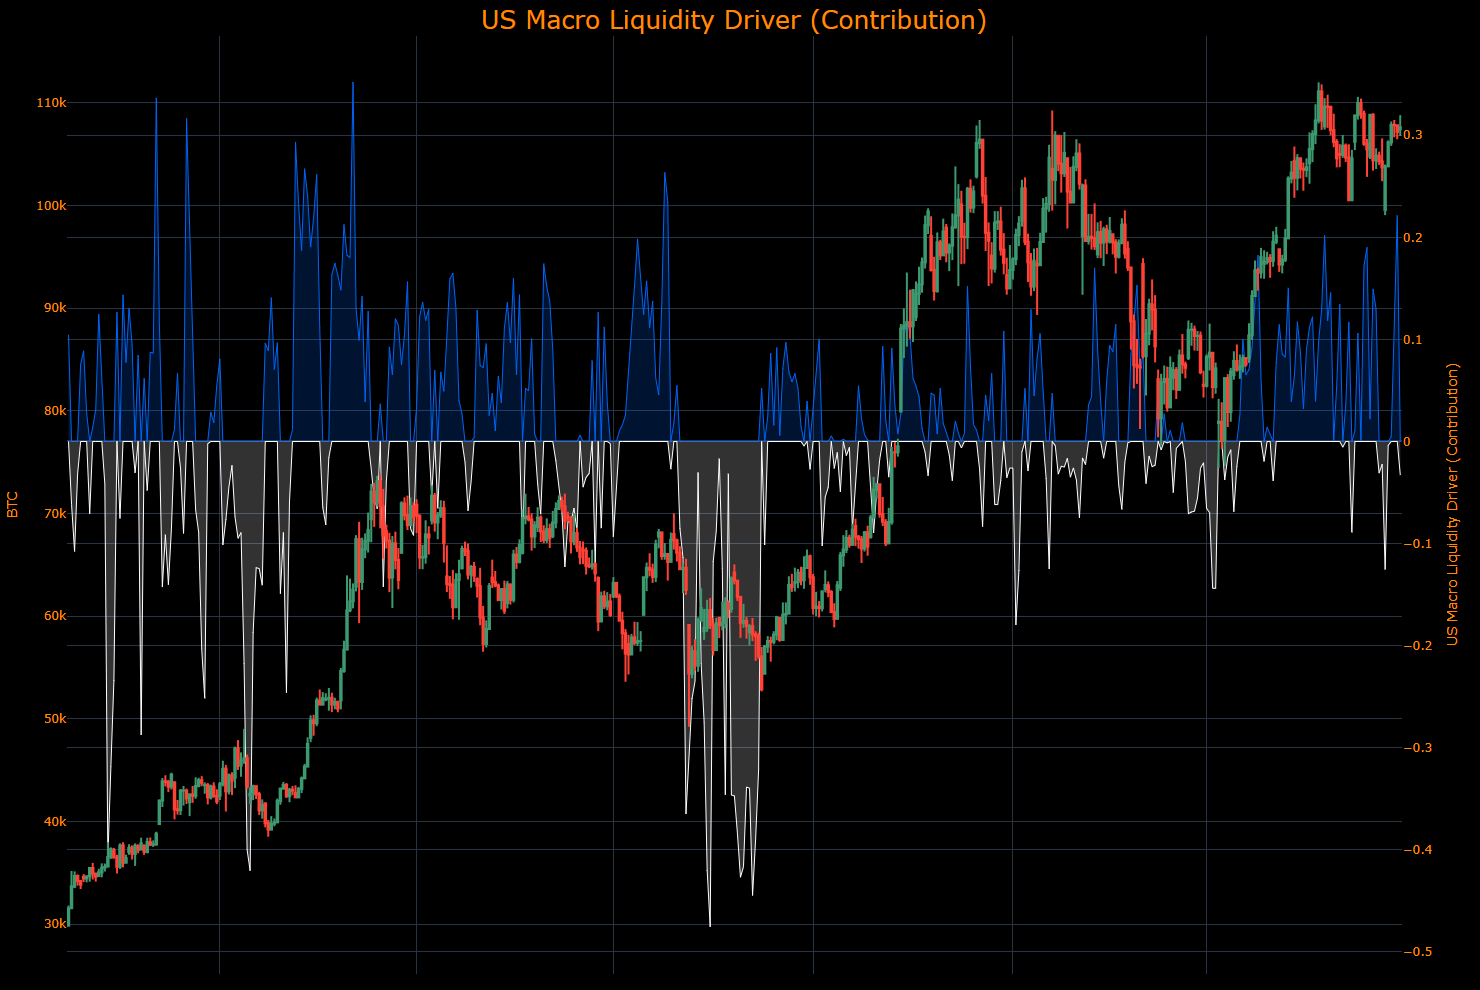
(The US Macro Liquidity Driver contribution identifies HOW the drivers of US liquidity are contributing to the returns of Bitcoin. In the same manner, the higher the contribution moves, the more strength the drivers have in pushing Bitcoin in a specific direction.)
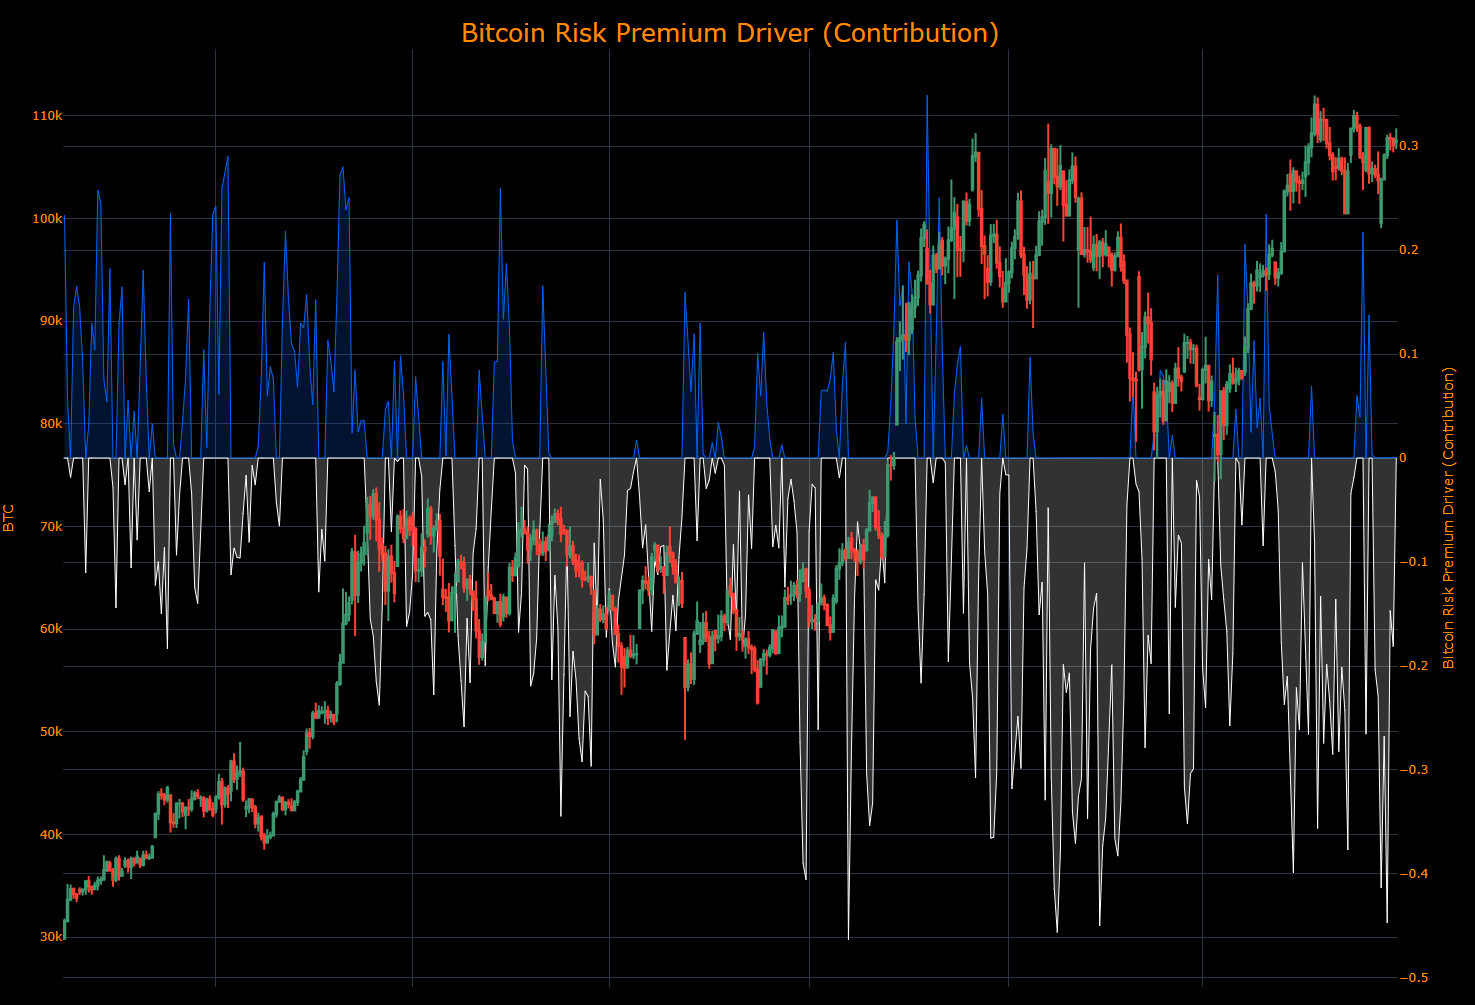
(The Bitcoin Risk Premium Driver contribution identifies HOW the risk premium of Bitcoin is contributing to returns. In the same manner, the higher the contribution moves, the more strength the drivers have in pushing the Bitcoin in a specific direction.)
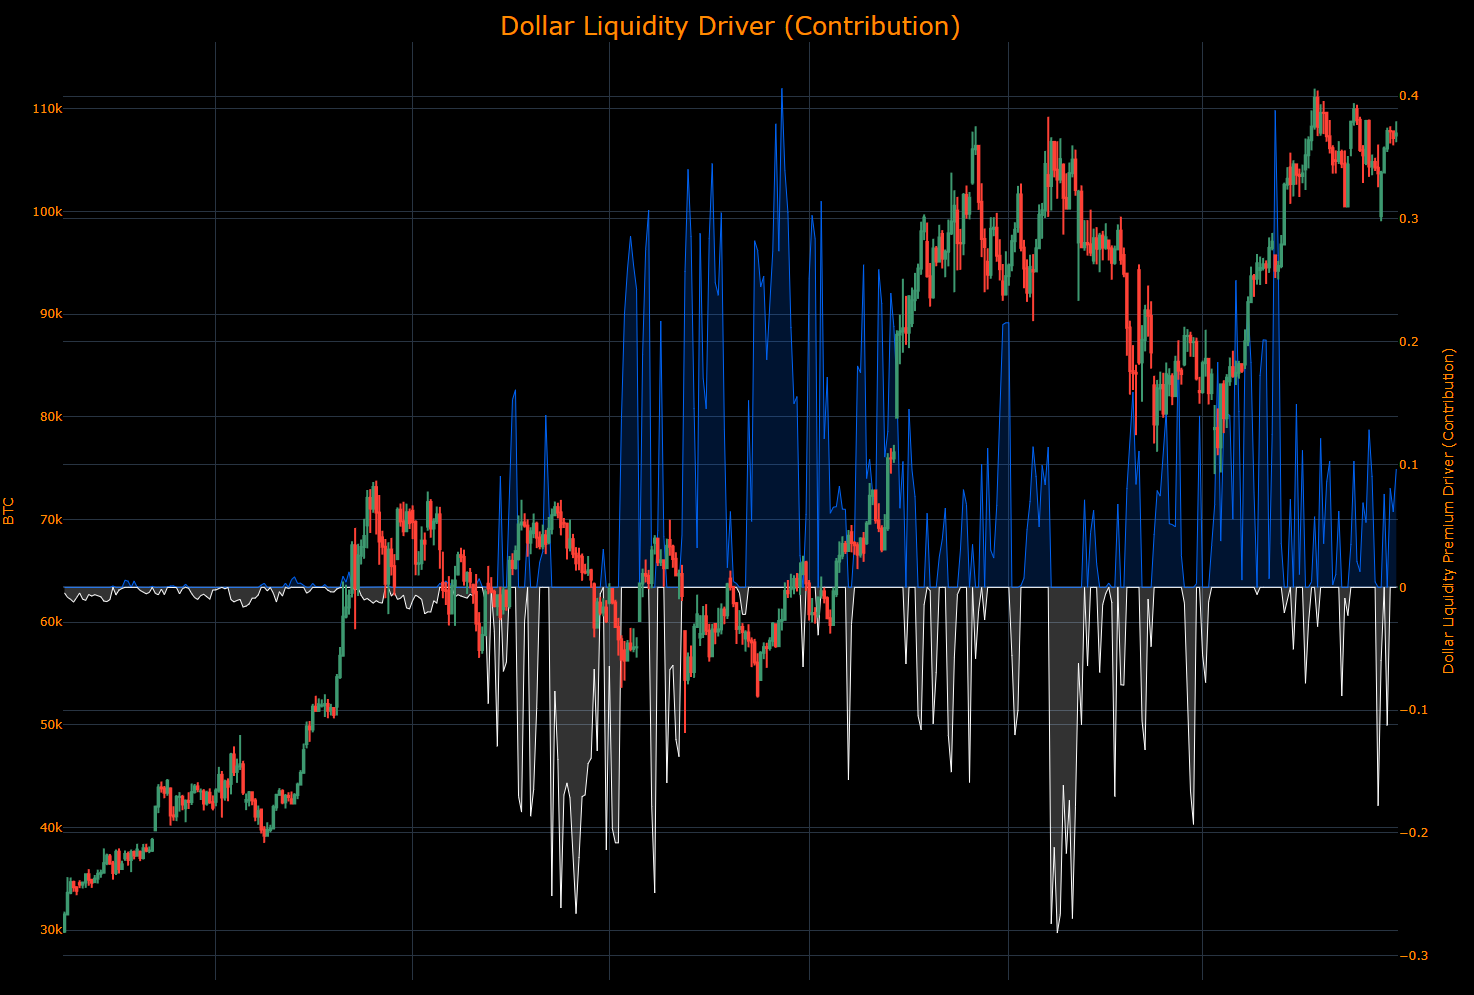
(The Dollar Liquidity Driver contribution identifies HOW the drivers of dollar liquidity are contributing to the returns of Bitcoin. In the same manner, the higher the contribution moves, the more strength the drivers have in pushing Bitcoin in a specific direction.)
(The Global Liquidity Driver contribution identifies HOW the drivers of global liquidity are contributing to the returns of Bitcoin. In the same manner, the higher the contribution moves, the more strength the drivers have in pushing Bitcoin in a specific direction.)
As always, a Pepe for the culture:

The information on this website/Substack is for information purposes only. It is believed to be reliable, but Capital Flows does not warrant its completeness or accuracy. The information on the website/Substack is not intended as an offer or solicitation for the purchase of stock or any financial instrument. The information and materials contained in these pages and the terms, conditions and descriptions that appear, are subject to change without notice. Unauthorized use of Capital Flows websites and systems including but not limited to data scraping, unauthorized entry into Capital Flows systems, misuse of passwords, or misuse of any information posted on a site is strictly prohibited. Your eligibility for particular services is subject to final determination by Capital Flows and/or its affiliates. Investment services are not bank deposits or insured by the FDIC or other entity and are subject to investment risks, including possible loss of principal amount invested. Your use of any information which is proprietary to Capital Flows or a third-party information provider shall only be used on individual devices without any right to redistribute, upload, export, copy, or otherwise transfer the information to any centralized interdepartmental or shared device, directory, database or other repository nor to otherwise make it available to any other entity/person/third party, without the prior written consent of Capital Flows.