

Macro Regime Tracker: Thesis Confirmed, How High Now?
Macro regime and risk assets qualified clearly

Macro Regime Tracker:
The Macro Regime Tracker offers a daily lens on how shifts in growth, inflation, and liquidity affect short-term risk and reward. Leveraging machine learning, AI, and cross-asset data, it identifies macro changes and their impact on market positioning.
Macro Regime Tracker Index:
Macro Regime Context
Macro Tear Sheets: Equities, Fixed Income, FX, Crypto, and Commodities
Macro Regime Dashboard: Excel spreadsheet for economic data and interest rates
Growth, Inflation, Fixed Income, Credit, and Equities Regime Tracker
AI and Machine Learning Strategies - Macro Regime and Positioning Premiums Strategies: S&P 500, 2-Year Interest Rates, Gold, and Bitcoin
Macro Regime Context:
Since Friday of last week, I have been laying out the incremental change that has taken place where the skew for equities was beginning to shift to the upside. The strategies that we run, breaking down all of the macro and positioning factors, began to create a significant skew to the upside, especially moving into the trading day today.

Today, we saw one of the largest intraday rallies in years, with the index up almost 10%! When you are on the right side of days like today, it makes your year. However, I want to cover some of the logic behind the flows and dig into HOW HIGH equities can go.
Main Developments In Macro
*BESSENT: SEEING NORMAL DELEVERAGING IN BOND MARKET
*FED'S DALY: WE HAVE TIME AND SPACE TO DELIBERATE NEXT MOVES
*DIMON: `PROBABLY' A RECESSION IS 'LIKELY OUTCOME'
*BESSENT SAYS IT'S `MAIN STREET'S TURN' NOW NOT WALL STREET
*BESSENT: TALKS ON TAX BILL GOING 'BETTER THAN EXPECTED'
*KASHKARI: BAR FOR RATE CUTS HIGHER EVEN IF FACING WEAKER ECO.
*TRUMP: THIS A GREAT TIME TO BUY
*FED'S MUSALEM SAYS BASELINE OUTLOOK IS NOT FOR RECESSION: RTRS
*BESSENT CALLS CHINA BIGGEST SOURCE OF US TRADE PROBLEMS
*BESSENT: TRUMP CREATED MAXIMUM NEGOTIATING LEVERAGE
*BESSENT ON TARIFFS: IT WAS THE PRESIDENT'S DECISION
*TRUMP TO SIGN ACTION ON DEREGULATION
*TRUMP: GLAD THE EU HELD BACK TARIFFS
*TRUMP: WOULD TALK OR MEET WITH XI
*TRUMP: DON'T WANT TO HURT COUNTRIES THAT DON'T NEED TO BE HURT
*TRUMP REITERATES IRAN CAN'T HAVE NUCLEAR WEAPON
*TRUMP: 'CAN'T IMAGINE' FURTHER INCREASE OF TARIFFS ON CHINA
*LUTNICK: INCREDIBLE INFLUX OF CALLS FROM COUNTRIES ON TARIFFS
*JPMORGAN PUSHES NEXT FED RATE CUT TO SEPTEMBER ON TARIFF PAUSE
*KASHKARI INDICATES BAR FOR CUTTING RATES IS STILL HIGH
Macro Tear Sheets: Equities, Fixed Income, FX, Crypto, and Commodities
Macro Regime Dashboard: Excel spreadsheet for economic data and interest rates
An Important Note: Starting Friday, all of the strategies and in-depth commentary will be reserved for paid subscribers and behind the paywall. I have made them public this week so you can get a handle on them and understand the value they add. The mapping of the underlying macro drivers and positioning drivers are not even provided by the best investment banks in the world. We will continue to invest in the highest quality models and strategies that merge the new developments in AI and Machine Learning. If you are an early subscriber, you can lock in the current price of $150 a month for all of the future upside. The best is yet to come!
Growth, Inflation, Fixed Income, Credit, and Equities Regime Tracker
The Macro Regime Model offers a real-time view of growth, inflation, and yield curve dynamics, integrating these with credit market shifts, equity risk premiums, and positioning data. It connects upcoming catalysts to statistical drivers of asset prices, creating a unified framework that quantifies skew and clarifies risk-reward across asset classes.
Key Points:
S&P 500 Intraday – Whiplash Rally as Tariff Pause Triggers Panic Unwind
After days of gut-wrenching volatility, the S&P 500 exploded higher by +9.99%, its biggest single-day gain since the pandemic shock, as markets violently reversed course following President Trump’s announcement of a 90-day pause on new tariffs excluding China. The move pulled risk assets back from the brink, unleashing a broad-based relief rally fueled by short-covering, systematic buy flows, and re-risking across sectors.
Sector Contribution Breakdown
Information Technology (+4.01%) – The dominant driver of the rally. Mega-cap tech rebounded hard, reversing steep losses from earlier in the week. Growth names led the charge as positioning snapped back aggressively.
Financials (+1.26%) – Repricing in yields helped the sector rally, as curve stabilization and relief from systemic risk reignited interest in banks and insurers.
Consumer Discretionary (+1.15%) – Strong bounce in consumer-facing names, especially those seen as tariff-exposed. The sector rebounded in lockstep with broader growth sentiment.
Communication Services (+1.01%) – Heavily shorted and growth-sensitive names led gains. This was part of the broader rotation back into high-beta sectors.
Industrials (+0.84%) – Heavily impacted by the trade war narrative, the sector saw a sharp rally on hopes for stabilization in global trade dynamics.
Health Care (+0.66%) – Participated in the rally, though gains were more modest. Rotation into broader beta likely overshadowed defensive preferences.
Energy (+0.29%) – Oil prices stabilized after recent weakness, but the bounce was still underwhelming. Sector remains tethered to demand sentiment.
Consumer Staples (+0.28%), Materials (+0.18%), Real Estate (+0.16%), Utilities (+0.12%) – Defensive and rate-sensitive sectors posted gains but lagged the broader move, reflecting a clear shift back into risk-on positioning.
Analysis
This was not a “normal” relief rally, it was a full-scale unwind of extreme bearish positioning triggered by a political about-face.
The VIX plunged at record pace, and Treasury yields reversed sharply, suggesting a coordinated unwind of flight-to-safety trades.
Cross-asset correlations broke down as equities and yields rose together, defying the recessionary tone of recent sessions.
Despite the euphoria, underlying macro and policy uncertainty remain high. Tariffs on China were increased to 125%, and no meaningful framework for de-escalation has been established.
The bounce was massive… but the policy regime remains erratic, and risk remains asymmetric. Traders should remain nimble. For now, sentiment has flipped, but trust in the policy path is deeply fractured, and volatility is far from over.

S&P 500 Intraday – Historic Rebound, But Breadth Cautions Against Euphoria (Unweighted View)
After four days of relentless selling, today’s +9.99% surge in the S&P 500 delivered a massive point gain, but critically, the unweighted performance breakdown reveals an equally powerful rebound across the board. Every sector posted strong gains, though some key details suggest this may be more about positioning and relief than a true macro turning point.
Unweighted Sector Moves
Information Technology (+13.27%) – The single strongest sector, driven by short-covering in semis, software, and mega-cap names. Positioning was extremely crowded to the downside, and this sharp reversal reflects mechanical flows as much as renewed conviction.
Consumer Discretionary (+10.89%) – A full unwind of tariff fear trades. Retail, autos, and travel names surged despite no clear policy resolution on China, a sign that today was more about relief than fundamentals.
Communication Services (+10.63%) – Growth and media stocks, previously battered, saw aggressive re-risking. Sector beta amplified the move.
Industrials (+9.96%) – A barometer for global trade sentiment, the group bounced hard, especially in transport and cap goods. But with 125% China tariffs still active, underlying risks remain.
Materials (+8.93%) – Caught in the macro swing, the sector benefited from the global cyclical reset despite structural trade headwinds.
Financials (+8.81%) – Curve relief and improved market functioning supported the group, but earnings visibility is still murky.
Energy (+8.74%) – A big reversal off extremely oversold levels. Crude prices bounced, but demand outlook remains soft.
Real Estate (+7.33%) – Yield-sensitive names joined the risk rally, aided by a partial easing in bond market dysfunction.
Health Care (+6.06%) – A defensive sector that participated, but trailed the high-beta chase. Steadier gains here may suggest lower speculative interest.
Consumer Staples (+4.59%) and Utilities (+4.58%) – Lagged the broader bounce. Investors rotated out of safety and into cyclicals, reflecting short-term risk appetite, not a reassessment of fundamentals.
Analysis
Today was a textbook squeeze rally: the intensity of the bounce and breadth of participation reflect a forced repositioning, not a clear macro green light.
Every sector rallied, confirming this wasn’t just a mega-cap tech move it was a market-wide scramble for upside exposure.
Beta outperformed, and the weakest sectors during the drawdown are now the biggest gainers, a classic feature of short-term bear market rallies.
Volatility remains extremely elevated, suggesting fragility under the surface. Breadth today was strong, but not necessarily durable.
Key Takeaways
A bounce of this scale suggests peak bearishness may be behind us, but policy inconsistency remains a ceiling on conviction.
Macro risks are unresolved: China tariffs were increased, not rolled back. Growth expectations are still impaired.
This is not the start of a new bull trend, it’s a reflexive counter-move in a highly uncertain tape.
S&P 500 Sector Breadth – Bounce
Today’s move stands out sharply on the right edge of all three charts (10D, 20D, and 50D moving averages) as a rare, broad-based spike in sector participation, confirming the extreme nature of the rally. Every sector contributed meaningfully to the upside, with notable surges in Tech, Discretionary, Communication Services, and Financials.

Credit Snapshot – Signs of Stabilization, But Stress Still Elevated
Credit markets saw modest relief today, with high-yield spreads ticking down to 67.98 bps, following yesterday’s panic highs. While still above the long-term average (65.71 bps) and close to the upper end of the 3-year range, today’s move hints at some calming in risk sentiment, likely tied to the sharp equity reversal and easing volatility. That said, the broader context remains fragile:
Spreads remain well above pre-2024 norms, and today’s level is consistent with late-stage credit cycles, not recovery phases.
The spike resembles previous systemic stress episodes from 2016’s oil rout to 2022’s inflation shock suggesting the macro signal remains cautious.
Market participants appear to be watching for policy missteps, funding squeezes, or further trade escalations that could reignite credit stress quickly.

Short-End Rates – Sharp Repricing, But Easing Still in Play
Markets walked back front-loaded rate cut bets sharply today, but still expect 76.6 bps of total easing by the end of 2025 down from 110.5 bps yesterday, a 33.9 bps reversal in just one session.
This shift reflects improved market tone following the tariff pause and equity surge, dialing down immediate recession or crisis fears but not fully unwinding the easing cycle.
Key Pricing Shifts
May 7: Now just 4.7 bps priced (vs. 18.8% of a full cut) down from nearly a full cut yesterday.
June 18: 15.3 bps priced about 61% of a cut, compared to >100% yesterday.
July 30: Down to 37.2 bps (from ~70 bps), erasing nearly 1.5 full cuts in just 24 hours.
By the September 2025 meeting, only ~65 bps of cumulative cuts are priced — a dramatic recalibration of urgency.
Interpretation & Macro Read
"Crisis premium" unwound: The pricing shift mirrors the sharp rebound in equities and stabilization in credit. Traders are walking back bets on imminent Fed action tied to financial stress.
Still easing, but conditional: The curve still implies a full cutting cycle (~94 bps by late 2026), but the pace has shifted back to "data-dependent" rather than "emergency" mode.
Key risk ahead: CPI data, Fed commentary, and geopolitical stability… any re-escalation in trade policy or inflation stickiness could reprice cuts again, especially at the front.
Yesterday was “panic pricing”; today is a “positioning reset.” The market still sees cuts but no longer screams urgency. Expect volatility to remain high as traders reassess whether this is just a tactical bounce or the start of a broader macro turn.

Tactical Portfolio
Two key position where executed some 10 hours before the short end sold off today, (1) short Fed Funds and (2) short Australian Bank Bills (Sofr equivalent). Both a play on excessive cut for each central bank.

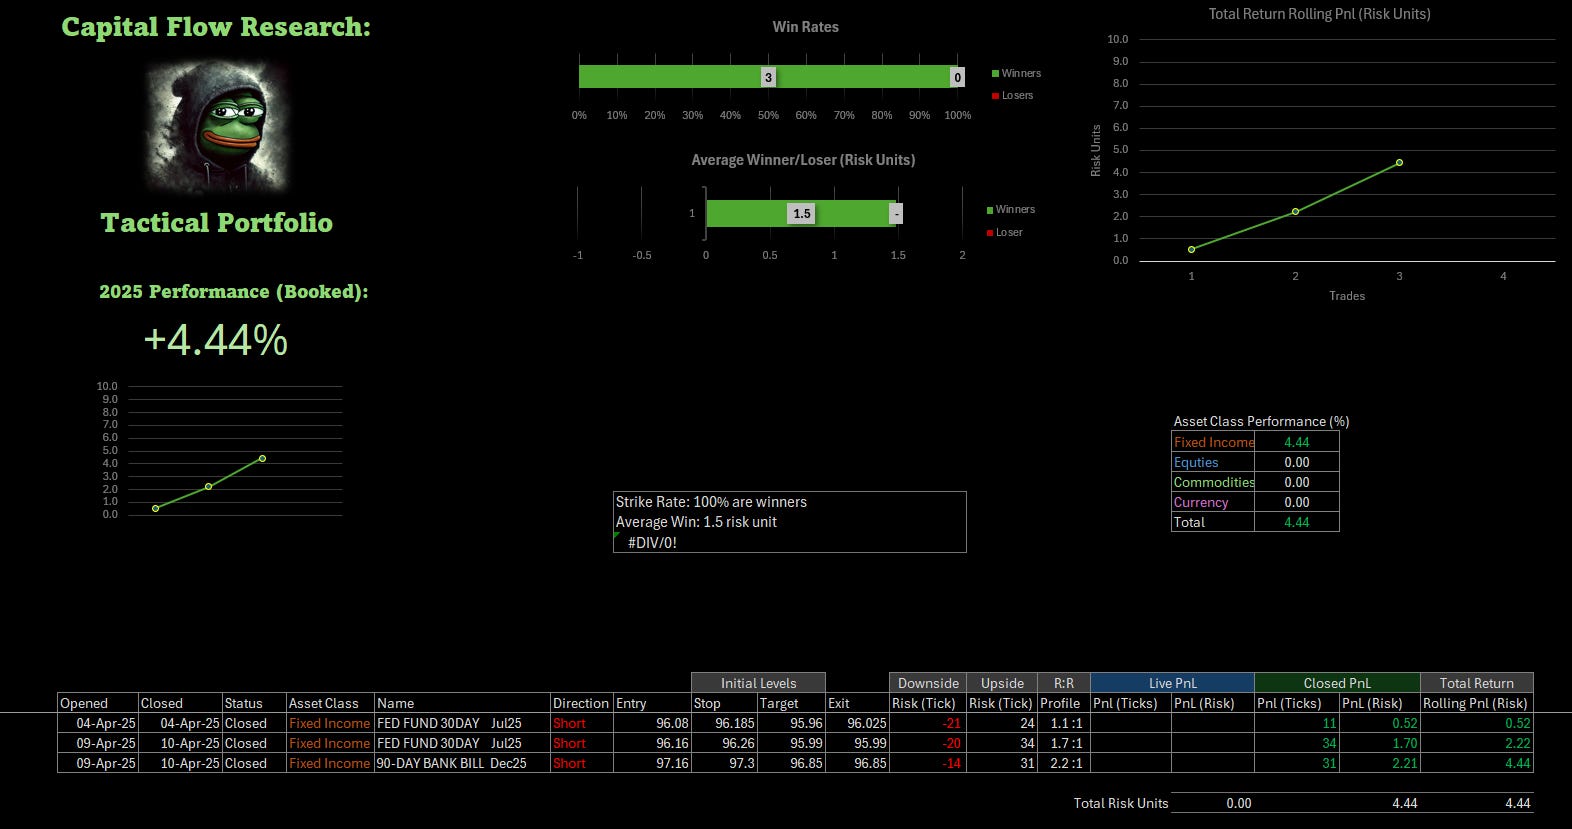

Macro Regime and Positioning Premiums - Strategies:
As of market close, the strategies have updated, and here are the new directional skews.
We are still seeing the ES strategy skew price to the upside still and interest rates on the short end remain skewed to the upside. This relationship will be critical to watch because the TYPE of macro regime we enter into will determine the correlation between stocks and bonds.
Equities (ES)
=================================================
Technical Levels for ES1 Index
=================================================
Daily Range: 191.15
Resistance Levels (Above Open):
------------------------------
R5: 5762.77 | Offset: +260.27
R4: 5573.25 | Offset: + 70.75 *
R3: 5551.00 | Offset: + 48.50 *
R2: 5534.50 | Offset: + 32.00 *
R1: 5531.24 | Offset: + 28.74 *
------------------------------
Open Price: 5502.50
------------------------------
Support Levels (Below Open):
------------------------------
S1: 5495.75 | Offset: - 6.75 *
S2: 5473.50 | Offset: - 29.00 *
S3: 5457.00 | Offset: - 45.50 *
S4: 5433.25 | Offset: - 69.25 *
S5: 5426.42 | Offset: - 76.08 *
==================================================
* Denotes intraday level, likely tested
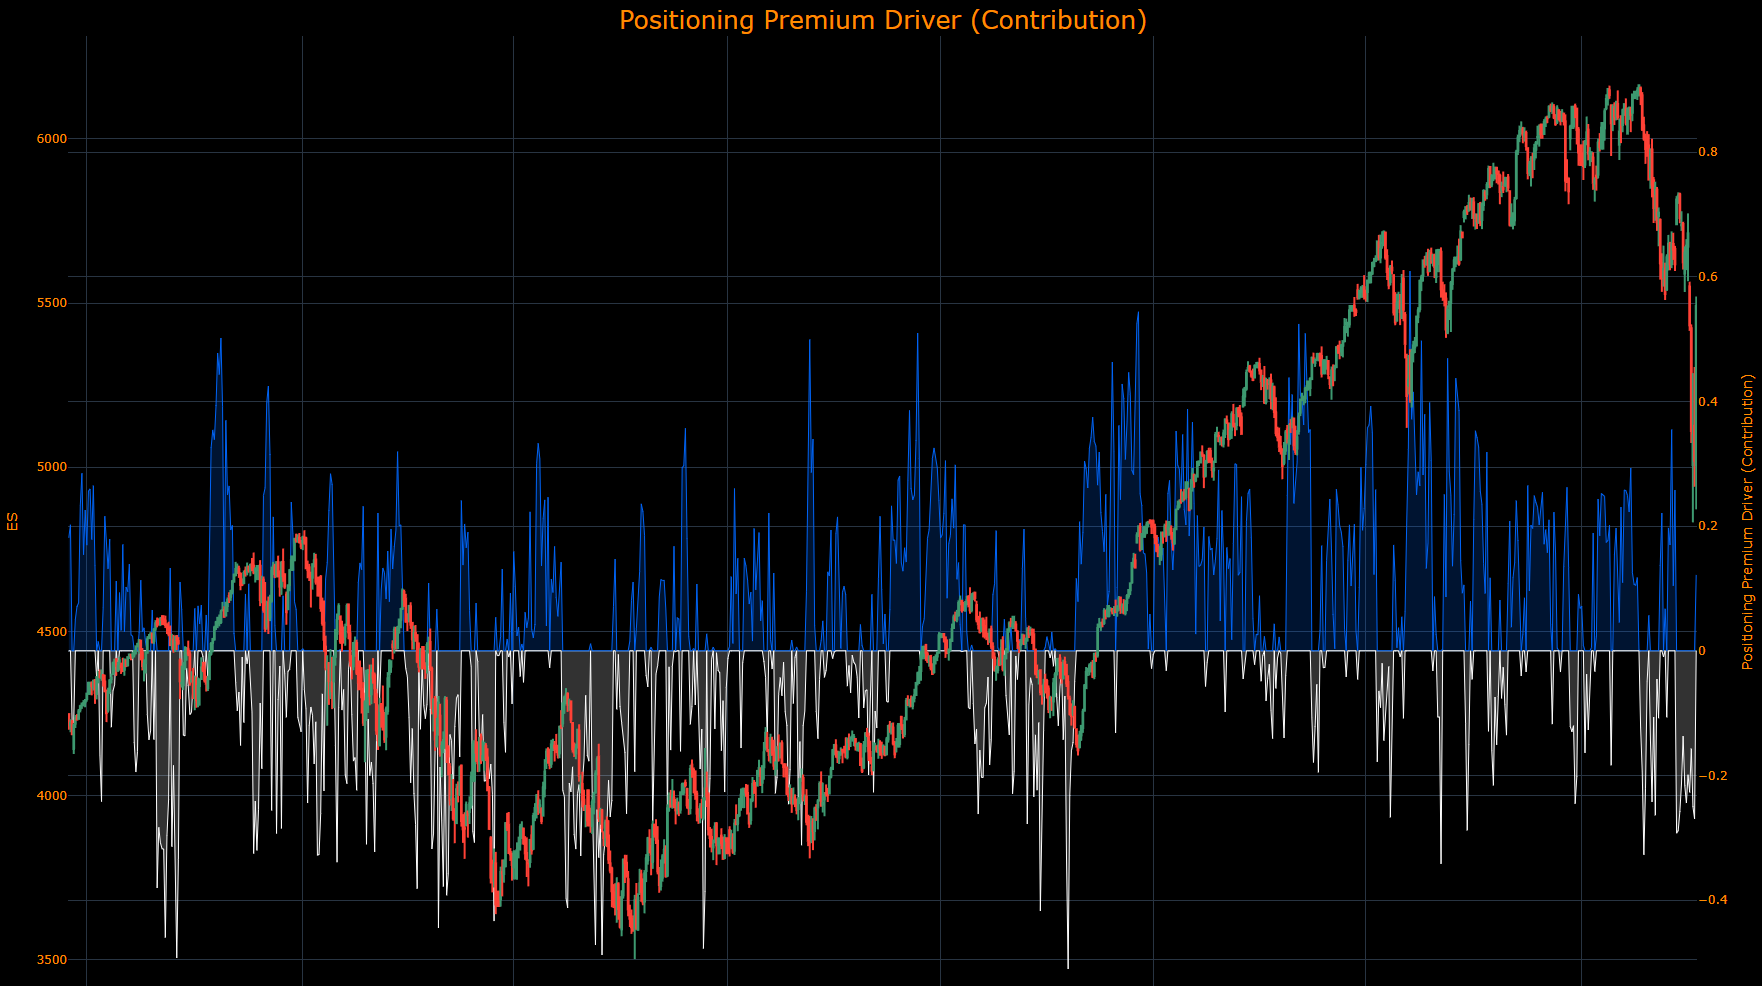
(In the top panel, the total impulse of macro drivers and positioning is illustrated in its strength. The greater the strength in the move, the higher the probability and amplitude of the move that is likely to take place. The bottom panel illustrates if the skew is either bullish or bearish probability.)
The directional skew remains squarely to the upside:

(The next three charts show the underlying contribution for the Total Macro and Positioning Drivers in the chart above. These allow you to see the WHY behind moves.)
(The Equity Risk Premium contribution aggregates major macro factors and the strength of factors driving equity risk premiums. In the same manner, the higher the contribution moves, the more strength the drivers have in pushing the index in a specific direction.)
We are just now beginning to see the equity risk premia driver put upward pressure on the index:
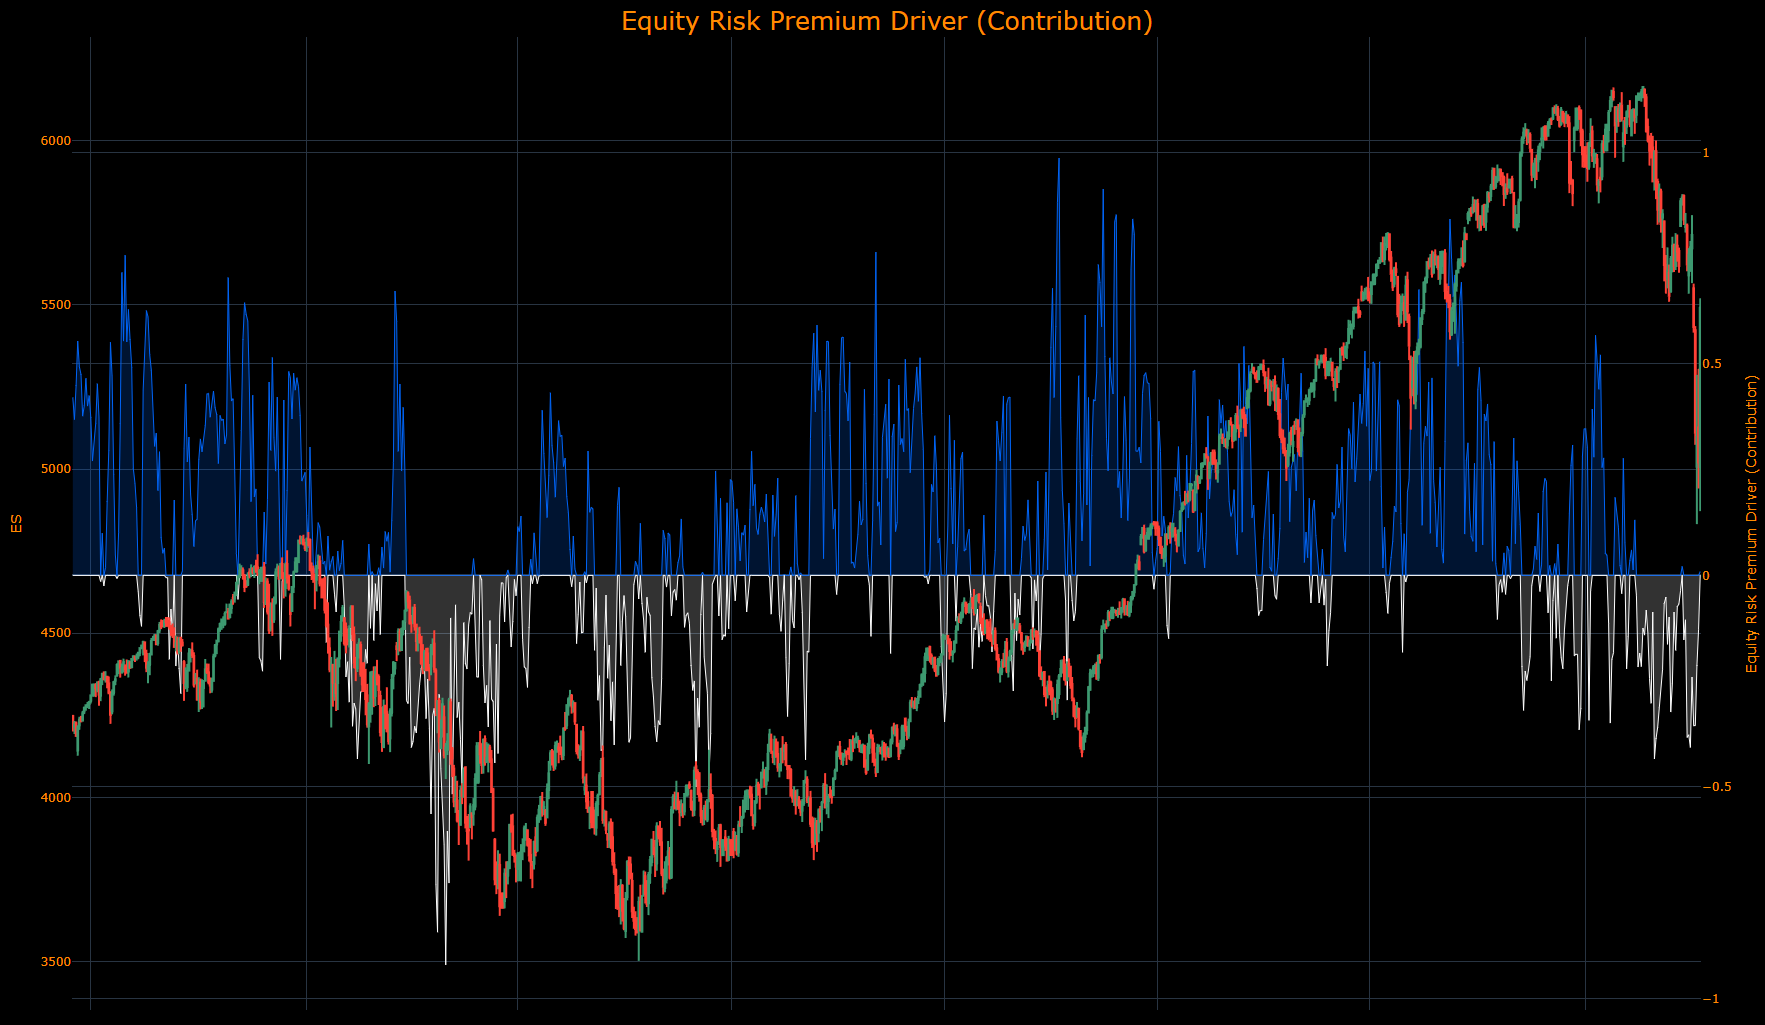
(The Positioning Premium Driver contribution identifies HOW the drivers of positioning are contributing to equity returns. In the same manner, the higher the contribution moves, the more strength the drivers have in pushing the index in a specific direction.)
Positioning is putting more and more upward pressure as hedges unwind:
(The Growth Risk Premium Driver contribution identifies HOW the drivers of growth are contributing to equity returns. In the same manner, the higher the contribution moves, the more strength the drivers have in pushing the index in a specific direction.)
And the entire market is realizing an imminent recession is unlikely:
2-Year Interest Rate
==================================================
Technical Levels for USGG2YR Index
==================================================
Daily Range: 0.13
Resistance Levels (Above Open):
------------------------------
R5: 3.89 | Offset: + 0.19
R4: 3.88 | Offset: + 0.18
R3: 3.83 | Offset: + 0.13 *
R2: 3.83 | Offset: + 0.12 *
R1: 3.80 | Offset: + 0.10 *
------------------------------
Open Price: 3.70
------------------------------
Support Levels (Below Open):
------------------------------
S1: 3.70 | Offset: - 0.00 *
S2: 3.52 | Offset: - 0.18
S3: 3.49 | Offset: - 0.21
S4: 3.49 | Offset: - 0.21
S5: 3.32 | Offset: - 0.38
==================================================
* Denotes intraday level, likely tested
(In the top panel, the total impulse of macro drivers and positioning is illustrated in its strength. The greater the strength in the move, the higher the probability and amplitude of the move that is likely to take place. The bottom panel illustrates if the skew is either bullish or bearish probability.)
The bullish skew in ES is overlapping with a bullish skew in the 2-year interest rate. This is why we were running the trades shorting Fed Fund futures. If the tariff risk changes, it brings a lot more focus back onto the Fed and thereby inflation prints this week.
(The Inflation Risk Premium Driver contribution identifies HOW the drivers of inflation expectations are contributing to 2-year returns. In the same manner, the higher the contribution moves, the more strength the drivers have in pushing rates in a specific direction.)

(The Commodity Premium Driver contribution identifies HOW the drivers of commodities are contributing to 2-year returns. In the same manner, the higher the contribution moves, the more strength the drivers have in pushing rates in a specific direction.)

(The Growth Risk Premium Driver contribution identifies HOW the drivers of growth are contributing to 2-year returns. In the same manner, the higher the contribution moves, the more strength the drivers have in pushing rates in a specific direction.)

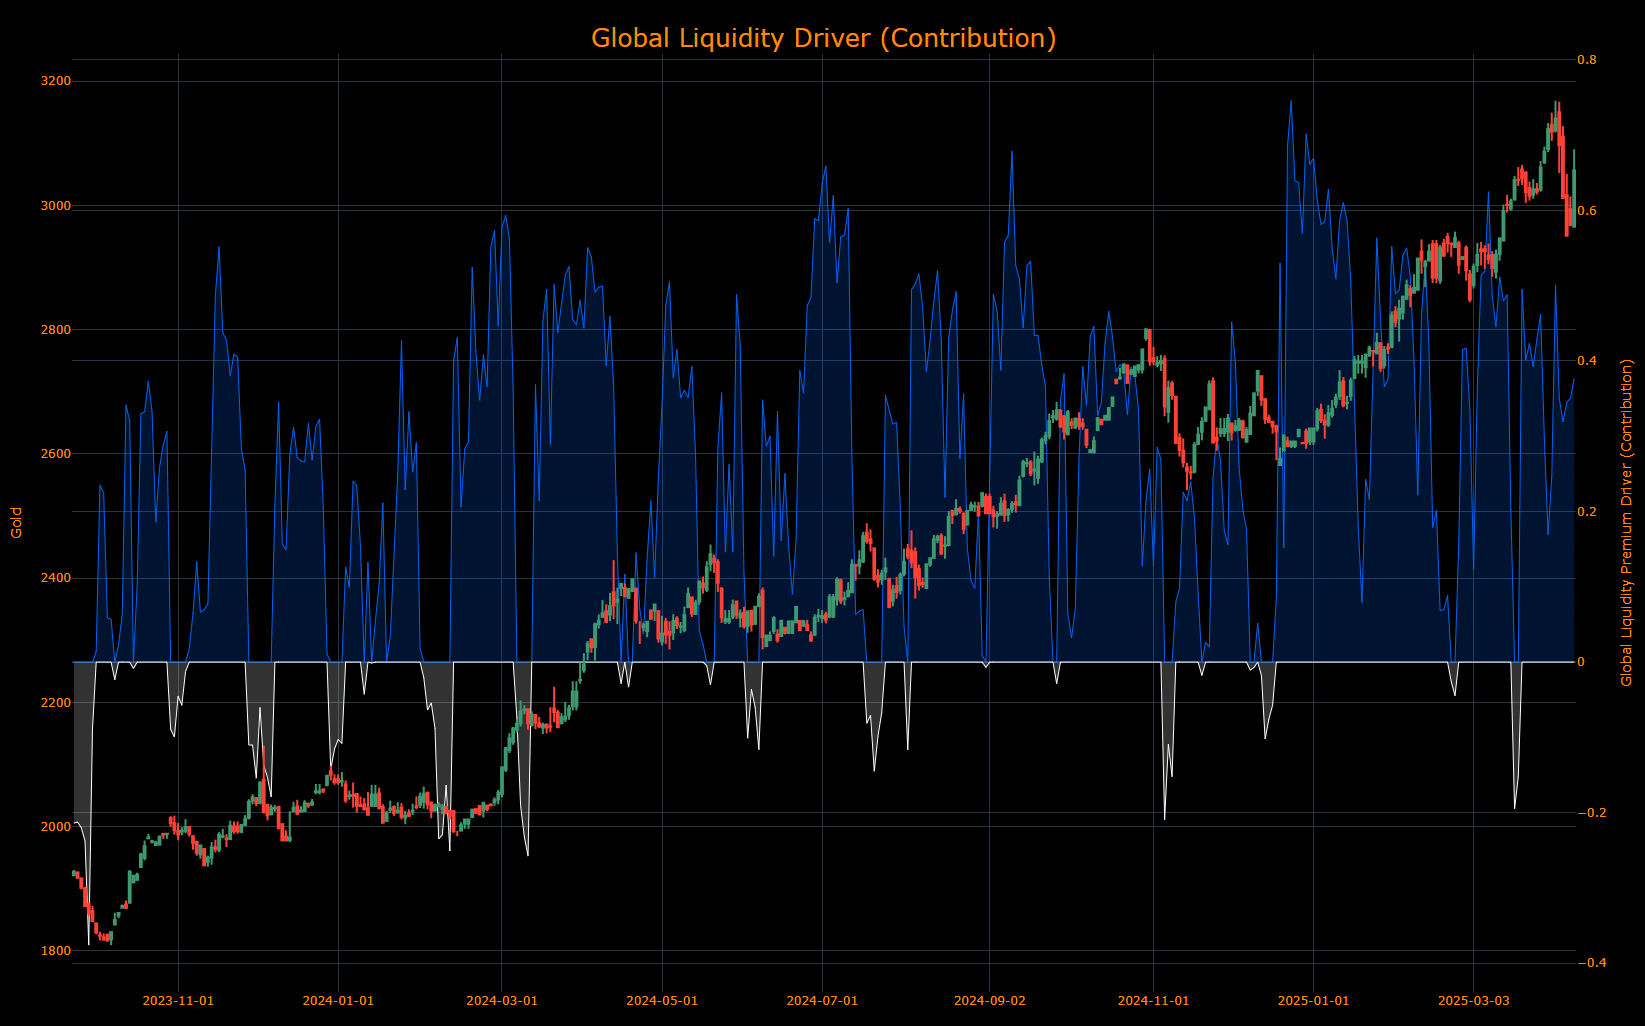
Gold
==================================================
Technical Levels for GC1 Comdty
==================================================
Daily Range: 42.82
Resistance Levels (Above Open):
------------------------------
R5: 3258.70 | Offset: +184.80
R4: 3141.30 | Offset: + 67.40
R3: 3079.17 | Offset: + 5.27 *
R2: 3077.73 | Offset: + 3.83 *
R1: 3074.97 | Offset: + 1.07 *
------------------------------
Open Price: 3073.90
------------------------------
Support Levels (Below Open):
------------------------------
S1: 3070.77 | Offset: - 3.13 *
S2: 3069.33 | Offset: - 4.57 *
S3: 3066.57 | Offset: - 7.33 *
S4: 3062.55 | Offset: - 11.35 *
S5: 3042.82 | Offset: - 31.08 *
==================================================
* Denotes intraday level, likely tested
In the top panel, the total impulse of macro drivers and positioning is illustrated in its strength. The greater the strength in the move, the higher the probability and amplitude of the move that is likely to take place. The bottom panel illustrates if the skew is either bullish or bearish probability.
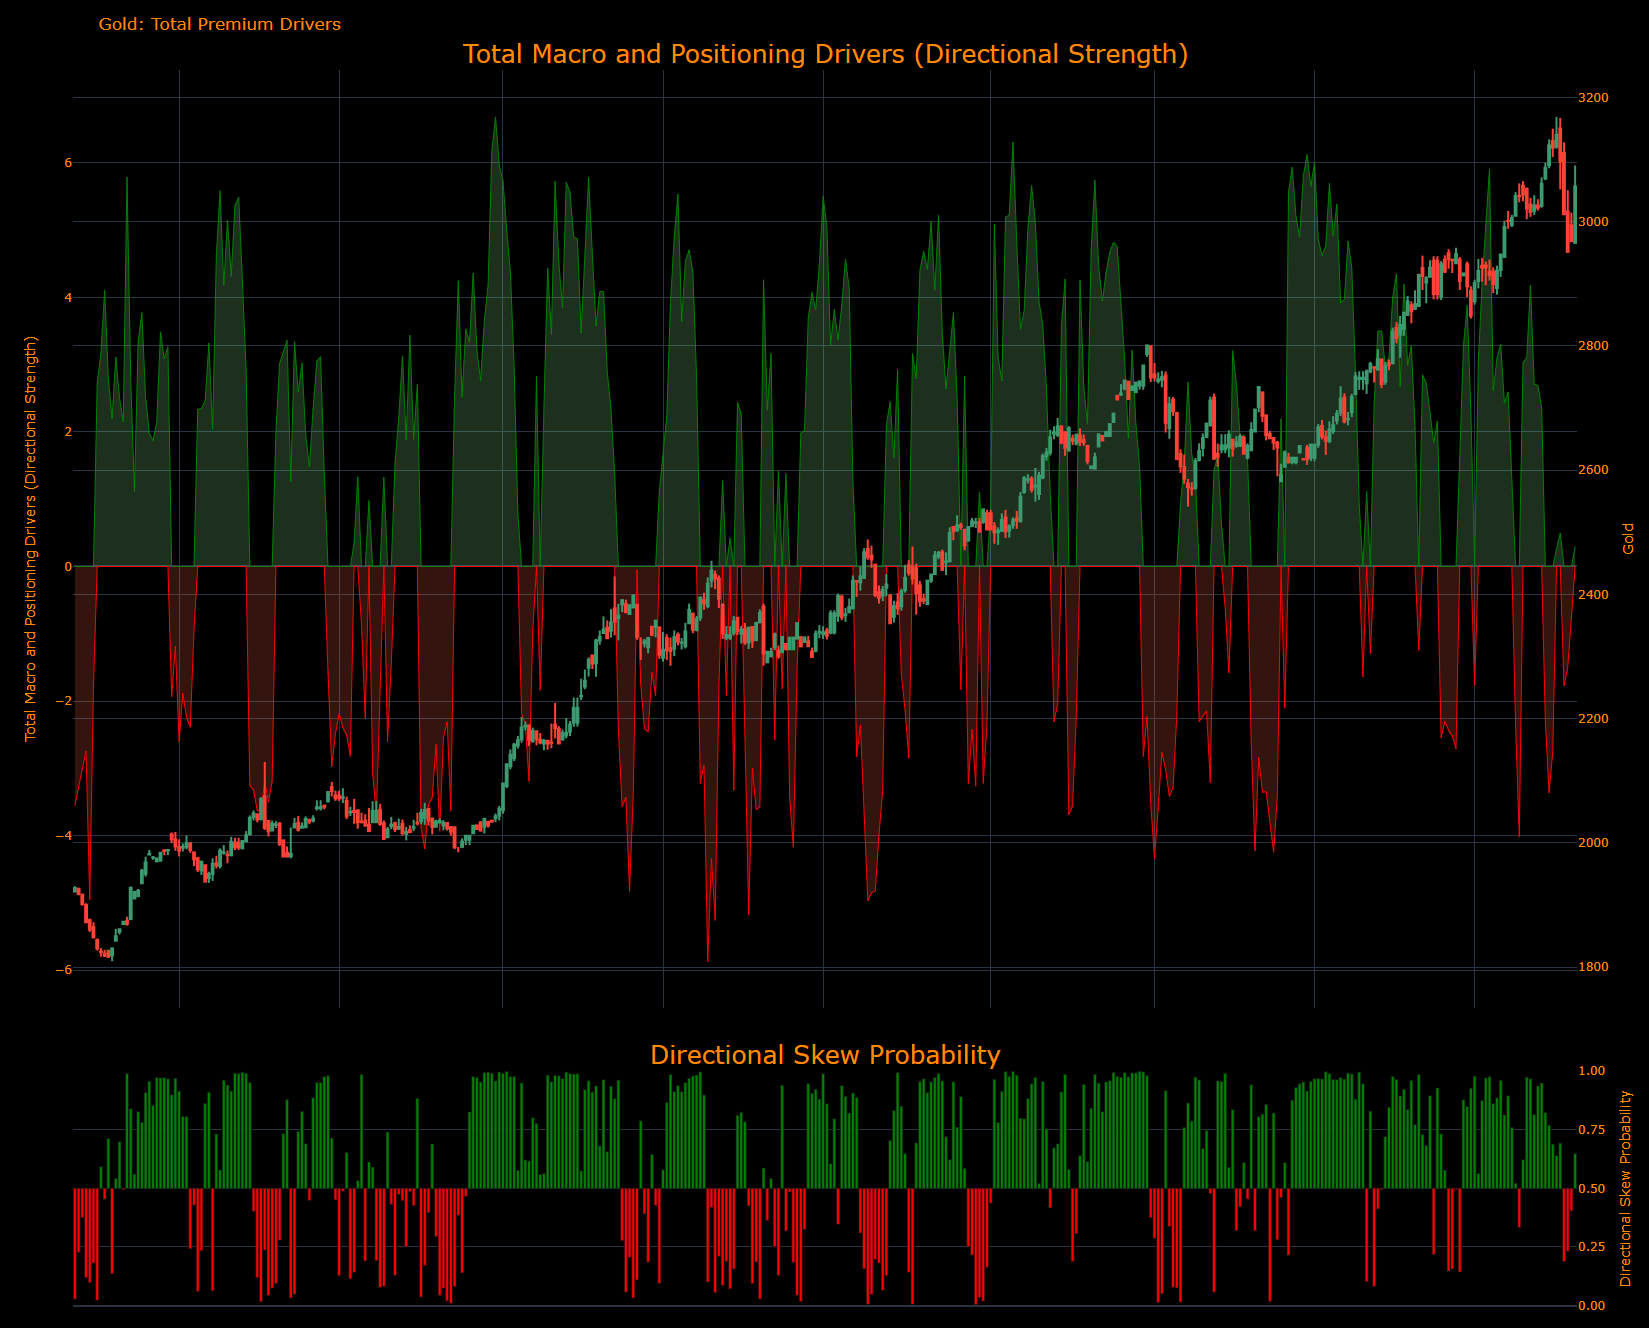
(The US Macro Liquidity Driver contribution identifies HOW the drivers of US liquidity are contributing to the returns of Gold. In the same manner, the higher the contribution moves, the more strength the drivers have in pushing gold in a specific direction.)

(The Gold Risk Premium Driver contribution identifies HOW the risk premium of gold is contributing to returns. In the same manner, the higher the contribution moves, the more strength the drivers have in pushing gold in a specific direction.)

(The Dollar Liquidity Driver contribution identifies HOW the drivers of dollar liquidity are contributing to the returns of Gold. In the same manner, the higher the contribution moves, the more strength the drivers have in pushing gold in a specific direction.)

The Global Liquidity Driver contribution identifies HOW the drivers of global liquidity are contributing to the returns of Gold. In the same manner, the higher the contribution moves, the more strength the drivers have in pushing gold in a specific direction.
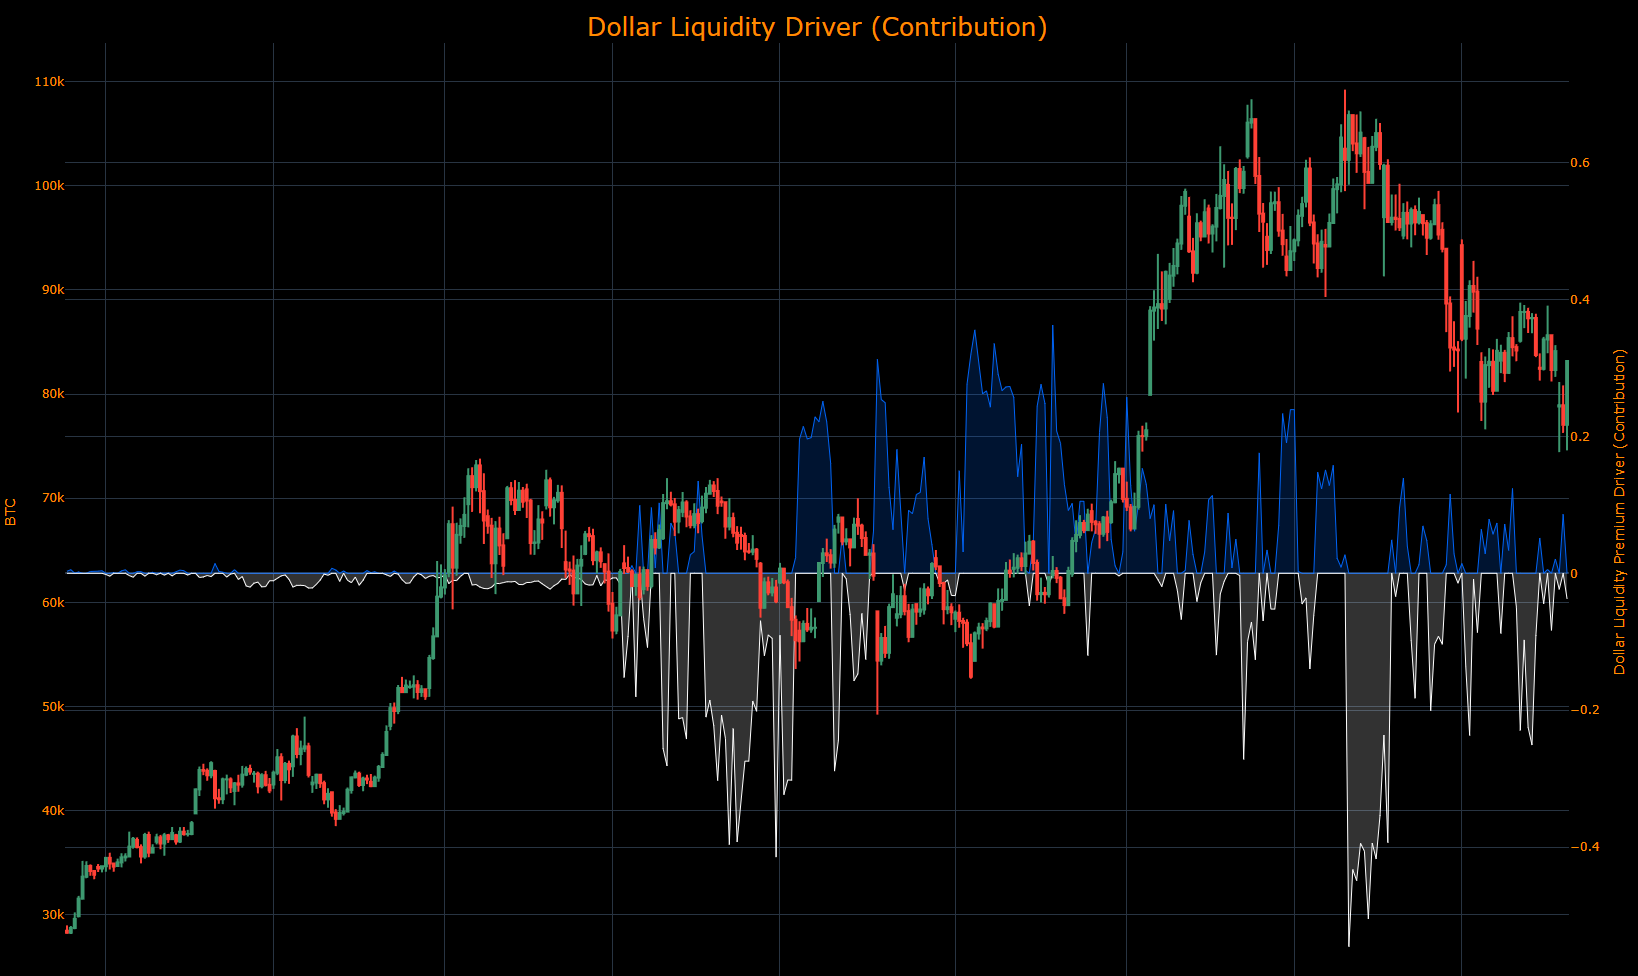
Bitcoin
==================================================
Technical Levels for XBTUSD Curncy
==================================================
Daily Range: 2246.26
Resistance Levels (Above Open):
------------------------------
R5: 90811.85 | Offset: +7638.34
R4: 87509.46 | Offset: +4335.95
R3: 84187.39 | Offset: +1013.88 *
R2: 83878.85 | Offset: +705.34 *
R1: 83344.35 | Offset: +170.84 *
------------------------------
Open Price: 83173.51
------------------------------
Support Levels (Below Open):
------------------------------
S1: 82908.15 | Offset: -265.36 *
S2: 82501.31 | Offset: -672.20 *
S3: 82192.77 | Offset: -980.74 *
S4: 82115.49 | Offset: -1058.02
S5: 81880.43 | Offset: -1293.08
==================================================
* Denotes intraday level, likely tested
In the top panel, the total impulse of macro drivers and positioning is illustrated in its strength. The greater the strength in the move, the higher the probability and amplitude of the move that is likely to take place. The bottom panel illustrates if the skew is either bullish or bearish probability.
I want to cover the WHY behind the strategy skewing Bitcoin bearish on a short-term basis because it is actually very important. Since Friday, the strategy has been skewed bullish. The factors for Bitcoin are always dynamically shifting, though.
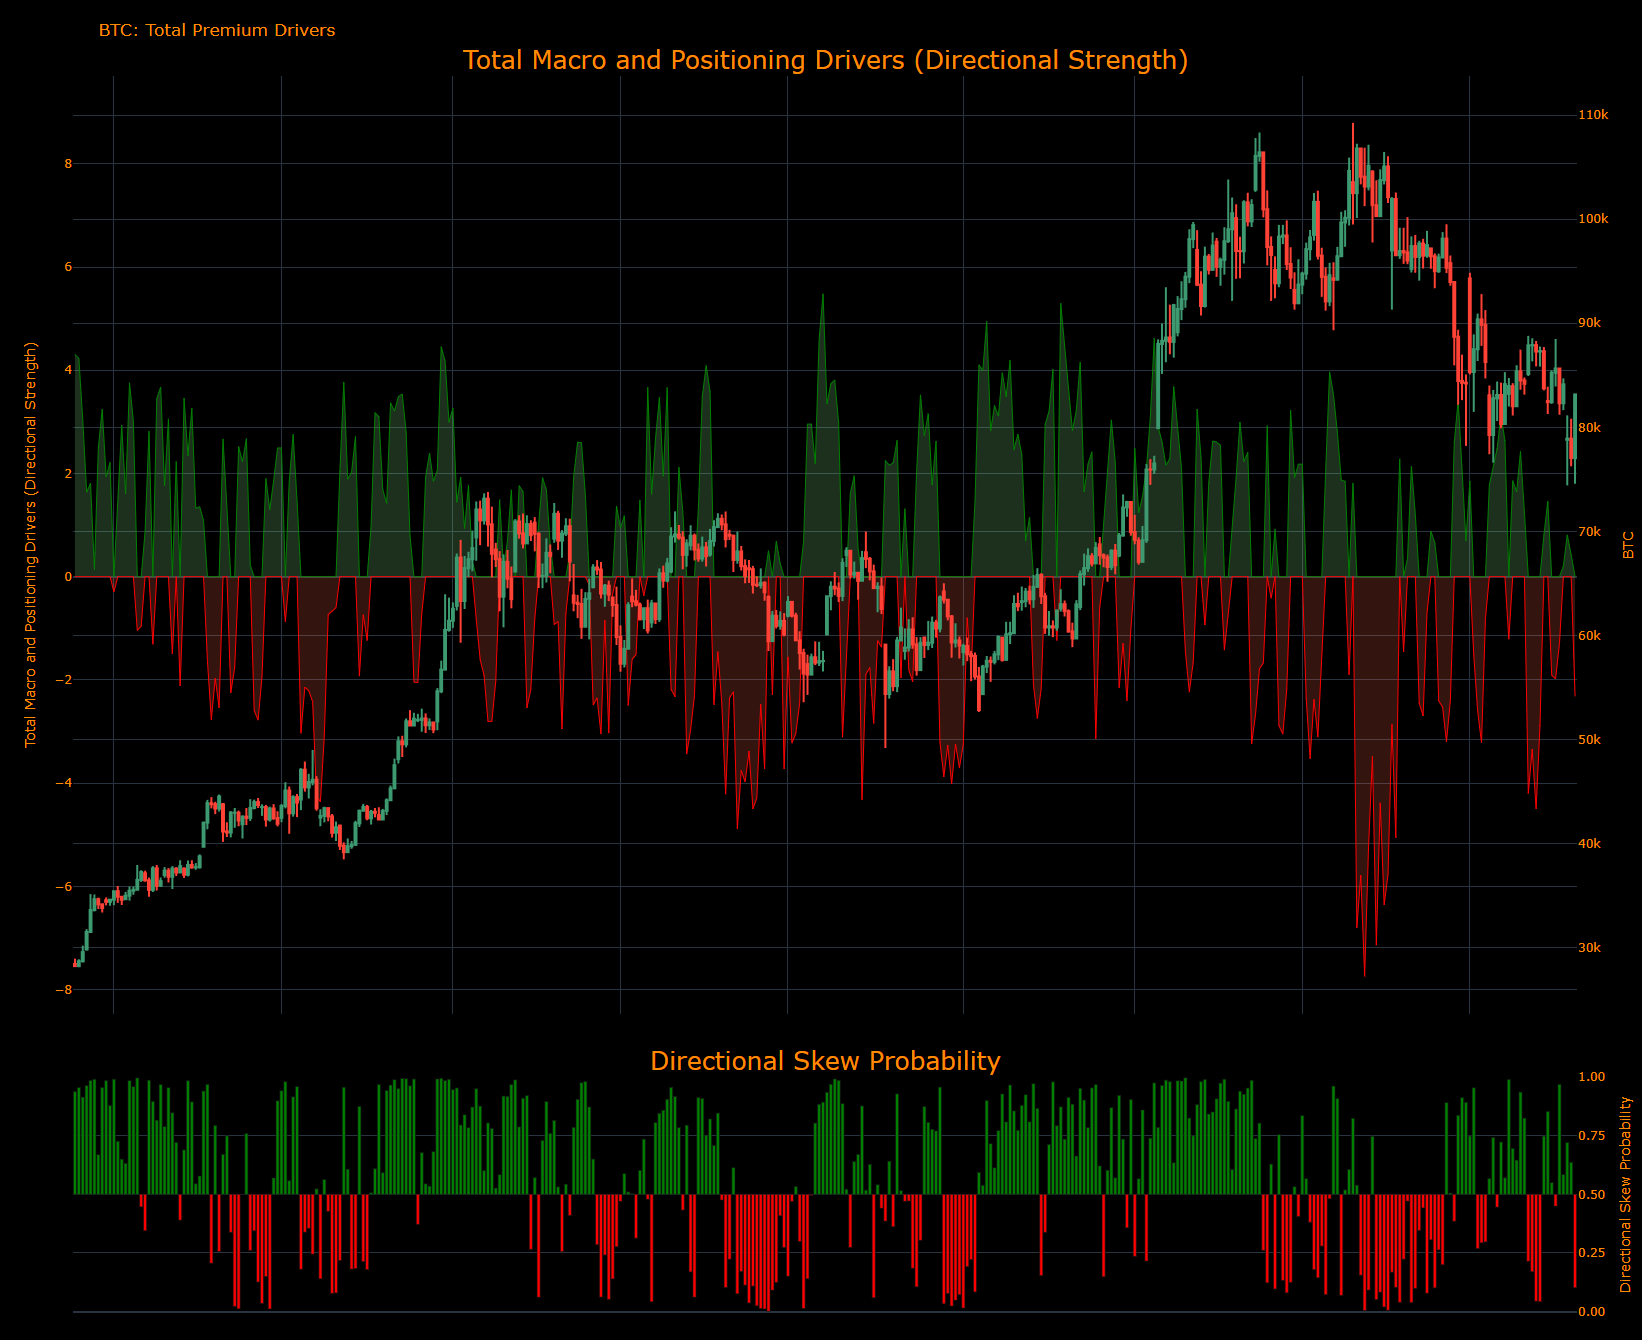
(The US Macro Liquidity Driver contribution identifies HOW the drivers of US liquidity are contributing to the returns of Bitcoin. In the same manner, the higher the contribution moves, the more strength the drivers have in pushing Bitcoin in a specific direction.)

(The Bitcoin Risk Premium Driver contribution identifies HOW the risk premium of Bitcoin is contributing to returns. In the same manner, the higher the contribution moves, the more strength the drivers have in pushing the Bitcoin in a specific direction.)
When we think about the risk premia of Bitcoin, the question is all about HOW ATTRACTIVE Bitcoin is compared to every other asset in the world. The fact that Bitcoin rallied so little today is an indication of underlying macro pressures. While I expect the Bitcoin strategy to turn back to bullish, I would rather be long ES because the risk reward is significantly higher.

(The Dollar Liquidity Driver contribution identifies HOW the drivers of dollar liquidity are contributing to the returns of Bitcoin. In the same manner, the higher the contribution moves, the more strength the drivers have in pushing Bitcoin in a specific direction.)
(The Global Liquidity Driver contribution identifies HOW the drivers of global liquidity are contributing to the returns of Bitcoin. In the same manner, the higher the contribution moves, the more strength the drivers have in pushing Bitcoin in a specific direction.)

Final Note:
Equities are likely to rally higher, but we need to remember that we have not made a complete regime shift. We are going to begin dealing with the market believing the credibility of Trump and Bessent’s statements, which means that there will be a moment when they try to shock the market so it moves back in lockstep with their agenda.
How high can ES go? I expect us to drift back up to the 5800 level, and then from there, if the administration wants to shock equity prices with tariffs, then they will have a little more cushion. After today’s rally, everyone will have a bit more confidence about the downside being limited so the next stage will be determining WHERE complacency develops. It is very possible that we rally and then break down to new lows if positions gets complacent relative to the macro regime. This is why mapping the macro and positioning factors will be so critical over the next 90 days. For now, we are BULLISH.

As always, a Pepe for the culture:

The information on this website/Substack is for information purposes only. It is believed to be reliable, but Capital Flows does not warrant its completeness or accuracy. The information on the website/Substack is not intended as an offer or solicitation for the purchase of stock or any financial instrument. The information and materials contained in these pages and the terms, conditions and descriptions that appear, are subject to change without notice. Unauthorized use of Capital Flows websites and systems including but not limited to data scraping, unauthorized entry into Capital Flows systems, misuse of passwords, or misuse of any information posted on a site is strictly prohibited. Your eligibility for particular services is subject to final determination by Capital Flows and/or its affiliates. Investment services are not bank deposits or insured by the FDIC or other entity and are subject to investment risks, including possible loss of principal amount invested. Your use of any information which is proprietary to Capital Flows or a third-party information provider shall only be used on individual devices without any right to redistribute, upload, export, copy, or otherwise transfer the information to any centralized interdepartmental or shared device, directory, database or other repository nor to otherwise make it available to any other entity/person/third party, without the prior written consent of Capital Flows.
Thanks for posting these in front of the paywall this week. Really educational.
Sure wish I was managing a decent sized portfolio and could do a paid subscription. Your work is the best I’ve seen in many years! Bravo sir.