Macro Report/Insights: Maintain and Adaptive Mindset
The chaos won't stop!
This article is a special one. Why? Because this is the 100th article published on this Substack! I want to express my gratitude to each of you. Your support, kind messages, and encouragement have been overwhelming.
I won't be slowing down in the least bit! The chaos of markets won't cease. The challenge won't decrease, and striving to be one of the best traders in the world remains.
I will cover several topics in this article:
Thoughts on edge
How does the sensitivity of assets change through the cycle?
Inflation is always misunderstood
Rates and FX
Thoughts on Edge:
Talking about having an "unfair advantage" in markets or life isn't usually palpable for people. Most of the time, people assume that there needs to be a "fair match" for a proper market to take place. People think having an unfair advantage means you're not being "nice."
Fundamentally, markets are not mechanisms to measure if people are being "nice" or not. Markets are about providing liquidity as a service. I want to find places where participants are forced to dump their positions and capitulate. I want to find ways to extract returns from other participants. As long as this is conducted in a lawful and ethical manner, you should attempt to obtain every advantage possible against the individuals you are trading against.
This is why reading books like The Art of War by Sun Tzu and On War by Carl von Clausewitz is fundamental for thinking about having an advantage over an opponent.
The final thing I will say about this is that since the market, economy, and life are open systems, the rules are constantly changing. This is in contrast to sports where the rules are fixed. If you can identify when the rules change, there is a considerable edge you can have over others. This is why the challenge of markets is so exhilarating.
How does the sensitivity of assets change through the cycle?
Remember in 2022 when the CPI prints would cause massive moves in stocks and bonds? Notice how the sensitivity of assets to the CPI prints has decreased? This is key to keep in mind.
I have said, momentum and mean reversion in assets connect with the level and rate of change in GIP.
This is SPX and the icons are MoM CPI coming in above (green), below (red), or in line (white) with expectations:
The impact on yields has also been important:
Here is the main idea with inflation surprising expectations and its impact: When inflation was accelerating, it had an outsized impact causing yields to rise. However, since breakevens are remaining elevated and the Fed intends to hold rates elevated, due to the level of inflation, the surprises to the downside haven't caused a comparable downtrend in yields as we saw on the upside.
I am trying to use this point more as an illustration. Information in financial markets always moves on a spectrum from uncertainty to certainty. The impact of information as it moves across this spectrum changes as we move through different points in the economic cycle. Generally, most people don’t talk about this because it requires a lot of work to figure out. On top of that, expectations data is not always incredibly consistent in backtests. However, understanding this logic is helpful when moving through regimes so that you don’t have a linear extrapolation.
Inflation is always misunderstood:
Here is the deal, we all know inflation will come down again one day. We all know inflation will go up again one day. That isn’t the question!
The question is about the timing.
Everyone will explain the “inflation” situation differently depending on their specific goals. For example, some people say there will be “structural inflation.” I have yet to see the definition of “structural inflation.” There will be other people who say inflation is “transitory.” Again, I have yet to see a definition of “transitory.”
Inflation is about timing because it deals with the value of money and interest rates which are directly connected to the time value of money. There is a newer book called The Price of Time that does an excellent job covering this dynamic. I actually wrote an entire article on it (link).
Inflation is fundamentally about the relative relationship between the amount of money in the system and the amount of “stuff” (goods and services representing real output) in the system. Sure, this can be influenced by demographics, supply chains and many other things, but it is really about timing the influences of all those variables.
Monetary regimes, fiscal policy regimes, demographic regimes, transportation regimes, and geopolitical regimes can all influence either the money side or output side of inflation. The real question is about timing these regimes and aligning yourself with them correctly.
There is a false idea out there that if you change your timeframe, “logic begins working.” For example, people will say, “in the long run” inflation will come down. Or “in the long run” valuations need to come down. My problem with this statement is that it assumes there is a higher degree of certainty when you increase your time horizon. The same people will say that there is so much uncertainty “short term” that they only stick to “long-term investments.”
This isn't a question about timeframe. There are many benefits to operating on different timeframes. In fact, making decisions that operate across multiple timeframes is actually better than constraining yourself to a single timeframe. This is fundamentally about the characteristics of uncertainty on different timeframes.
The bottom line is that we truly don’t know what will happen in a day, a week, a year, or even a decade from now. We just don’t know. Given this presupposition, we want to be able to have maximum optionality across ALL these timeframes due to the uncertainty that exists across ALL of them.
It truly is a balancing act across various timeframes. Maybe it makes more sense why people talk about a “balanced portfolio.” (and I am talking about in the real sense where you are diversified across multiple assets and strategies that execute across multiple time horizons):
Rates and FX:
Alright, let’s switch to something more tangible by talking about rates and FX:
The FED funds rate is now above core CPI:
Fed Funds is above inflation swaps:
Inflation is decelerating in BOTH its headline and core components.
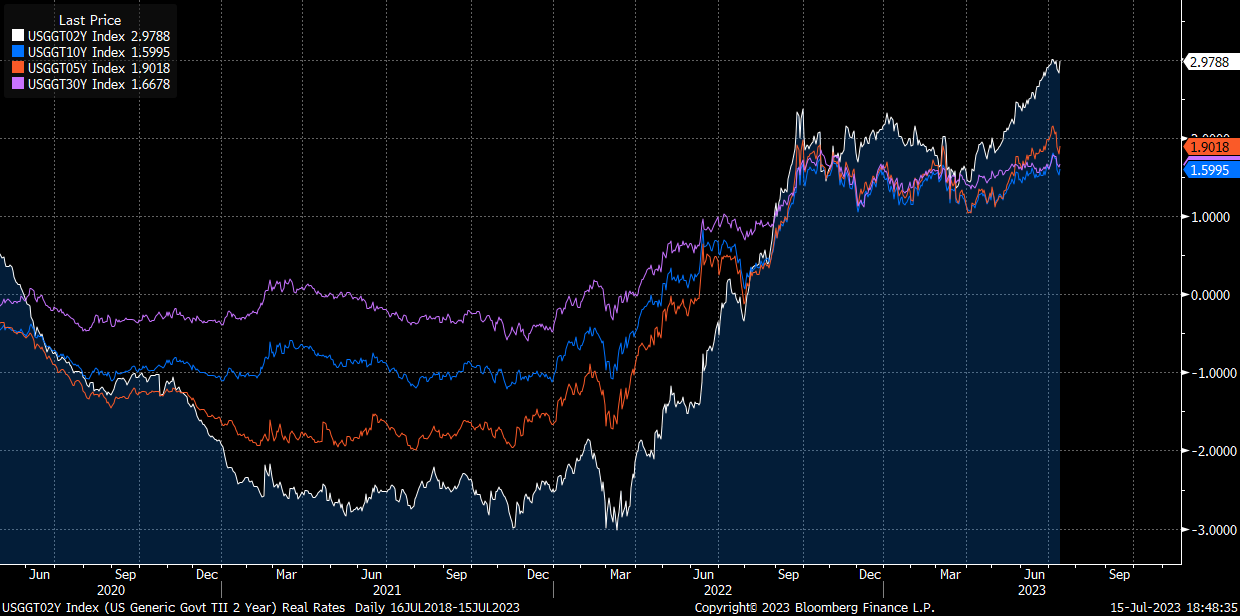
When we are at this point in the cycle, the question is WHEN will the FED pause. Here is a long-term chart of real rates across all durations. Notice that 2-year real rates are far above 10 year and 30 year real rates:
Here is a the same chart zoomed in. Notice rates on the short end have diverged:
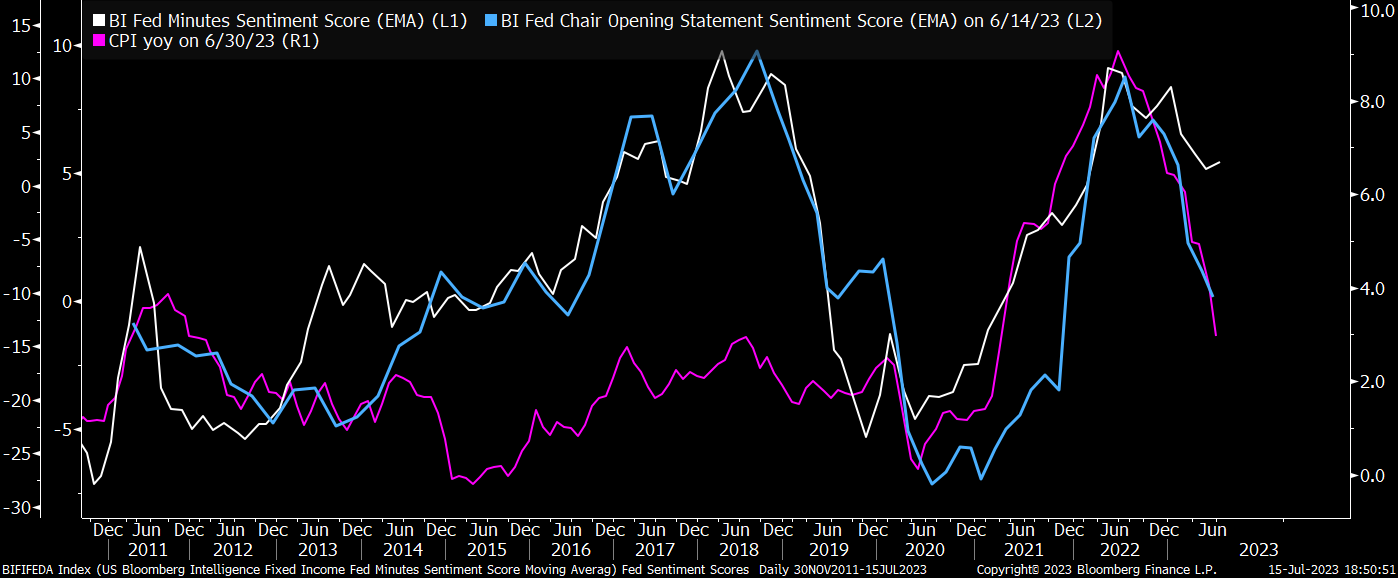
This divergence paired with the change in sentiment by the FED is the reason why rates are likely in the process of peaking:
We could most certainly have another spike in inflation, which is still a risk that needs to be monitored. There is a key tension that exists right now. Inflation just surprised expectations to the downside, which skews Fed decisions to a dovish bias. However, labor market data has come in above expectations over the past month, and Powell has said he intends to do 2 more rate hikes, which skews Fed decisions to a hawkish bias.
Notice that 2-year breakevens have continued to trend down on the CPI prints, and the primary factor pushing up the short end is real rates, which is connected to the Fed's actions:
The question now is, how many more rate hikes will the Fed do before they pause? Why do we need to know this? Because bonds have the highest expected returns when inflation is decelerating, the Fed is cutting, and the yield curve is steepening.
The July contracts are already pricing in a 92% probability of a 25bps hike. The question is, will Powell hike in September as well?
A small observation is that since the CPI print, the September contract has been pricing a lower probability of a hike than the November contract. This is very small, but I will be watching it to see if the spread widens. If the spread widens, it is likely the market pricing a September pause and November hike.
Remember, there is no FOMC meeting in Augest.
The other thing to keep in mind is that the forward curve is pricing cuts beginning in December, and these are unlikely to be realized. What is the implication? Let's say the Fed officially pauses and the forward curve is still pricing cuts; these cuts will have to get repriced as long as the Fed holds rates at an elevated level. This is likely to put some marginal upward pressure on nominal rates. This is why the labor market data is so important. The Fed is unlikely to actually cut until growth deteriorates considerably.
Given the setup with the Fed's intention to hold rates at an elevated level, we are likely to see mean reversion in bonds until labor market data AND inflation data deteriorate together.
Here is a chart of the spot yield curve (white) and the forward yield curves. The main idea behind this chart is that we continue to see the spot yield curve remain BELOW the forward curves.
The question is HOW fast inflation decelerates from here. This is why the MoM inflation data prints matter so much. Basically, the MoM print is used to “extrapolate” the speed of inflation on a YoY basis moving forward:
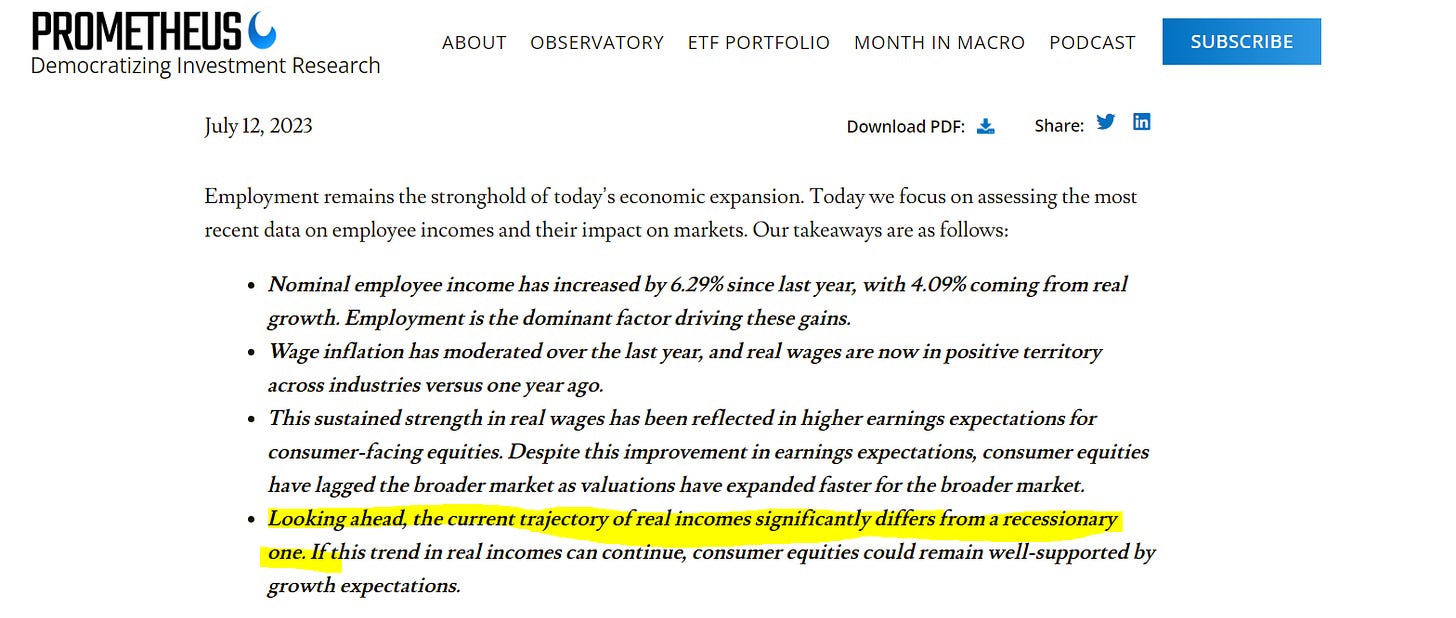
The speed of a deceleration in inflation will likely be dependent on the degree to which growth decelerates. This brings us back to the labor market dynamic. Prometheus had a great note expanding on this tension:
GDP is still running at reasonable levels:
Atlanta FED GDPNOW:
FX:
In connection with these tensions, I am also watching dollar price action, FX volatility, and XCCYs.
I provided a breakdown of the significance of dollar price action in connection with bonds during CPI here: Link
Bottom line, we continue to see dollar positioning moving in lockstep with duration positioning:
XCCYs continue indicating we aren’t in a liquidity crunch yet:
And FX vol remains low:
The implication is that dollar positioning is likely to continue moving in lockstep with duration positioning until we see a divergence in the correlation, overlapping with FX volatility rising and a shift in how risk assets are pricing expectations.
Several additional observations:
Growth data this week will be key to getting a read on how the market prices the growth side of this tension:
I will be sharing some additional thoughts on the week ahead but here is the economic calendar:
Since the dollar continues to move with duration positioning, we are likely to see the dollar move with bonds on the growth prints this upcoming week:
Consensus is bearish on the dollar here. I don't have an incredibly strong view on the dollar at this moment. I want to get long again, but I think it's a little early right now. I would be watching for more consolidation before a bullish move in a week or so.
As we move through Globex this week, watch for USDJPY and USDCNH. The price action of these pairs continues to move with duration positioning as well:
Let's bring a number of these things together:
Rates are likely in the process of peaking, but we have a tension between inflation data and growth data.
We are unlikely to experience an inflection point driven by dollar liquidity until we see the confluence of the yield curve steepening, growth data deteriorating, FX volatility rising, and XCCYs falling.
I will be sharing the risk-reward setups I see across assets for paid subscribers. The main advantage you can have by understanding the flows and scenarios incredibly well and taking asymmetric positions at the extremes.
Keep an eye on the board and maintain a mindset of adaptability.
Thanks for reading!
In the information age, you simply need to be at the right place, at the right time, with the right information to succeed


Apologies if this is a dumb question but what does GIP stand for in this instance ?
wonder if you know currency volatility are present in tradingview or not?