

The Coming Storm in Global Carry: Japan’s Pivot and the Flows No One Is Watching
A hidden leverage cycle is tightening beneath the surface, and the next major volatility shock will come from the places the consensus assumes are safest.

The Coming Storm in Global Carry: Japan’s Pivot and the Flows No One Is Watching
The global system of trade, capital flows, and crossborder debt has fused into a single, tightly interlocked structure. Over the past two decades, institutions and governments have not only financed each other but have effectively cross-collateralized their balance sheets through currency exposure, offshore dollar borrowing, derivatives, and implicit guarantees.

The result is a world where leverage is shared across borders, where liquidity conditions in one jurisdiction cascade instantly into another, and where the margin of error has narrowed dramatically. Think of a massive ship operated by multiple captains who each have different incentives, different maps, and different agendas. They have taken out debt from one another, stacked cargo far above safe levels, and pushed the vessel into waters that are about to turn violent. When the storm hits, the ship’s stability is determined not by any single captain but by the structural imbalances baked into the vessel itself.
This level of integration means that understanding the global picture is no longer optional. Local shocks now transmit globally through exchange rates, interest rate differentials, offshore funding markets, and derivative exposures. What matters is not just WHO is levered but HOW that leverage is interconnected. Nowhere is this more evident than in Japan, one of the most systemically important players in global finance. Japanese government bonds and the yen sit at the center of an enormous web of carry trades, collateral chains, and duration mismatches. For years, investors have treated Japan as the stable anchor in global markets. In reality, the scale of leverage tied to JGBs and the yen means any structural shift in Japan’s policy stance has the potential to reverberate across every major asset class.
This report will map these risks with clarity and precision. It will explain HOW global flows are shifting, WHY consensus is misreading the signals from JGB yields and the yen, and WHERE some of the largest opportunities are emerging as this misinterpretation widens.
The storm is forming. The objective is to understand the architecture of the ship before the waves hit.
The Structural Flow:
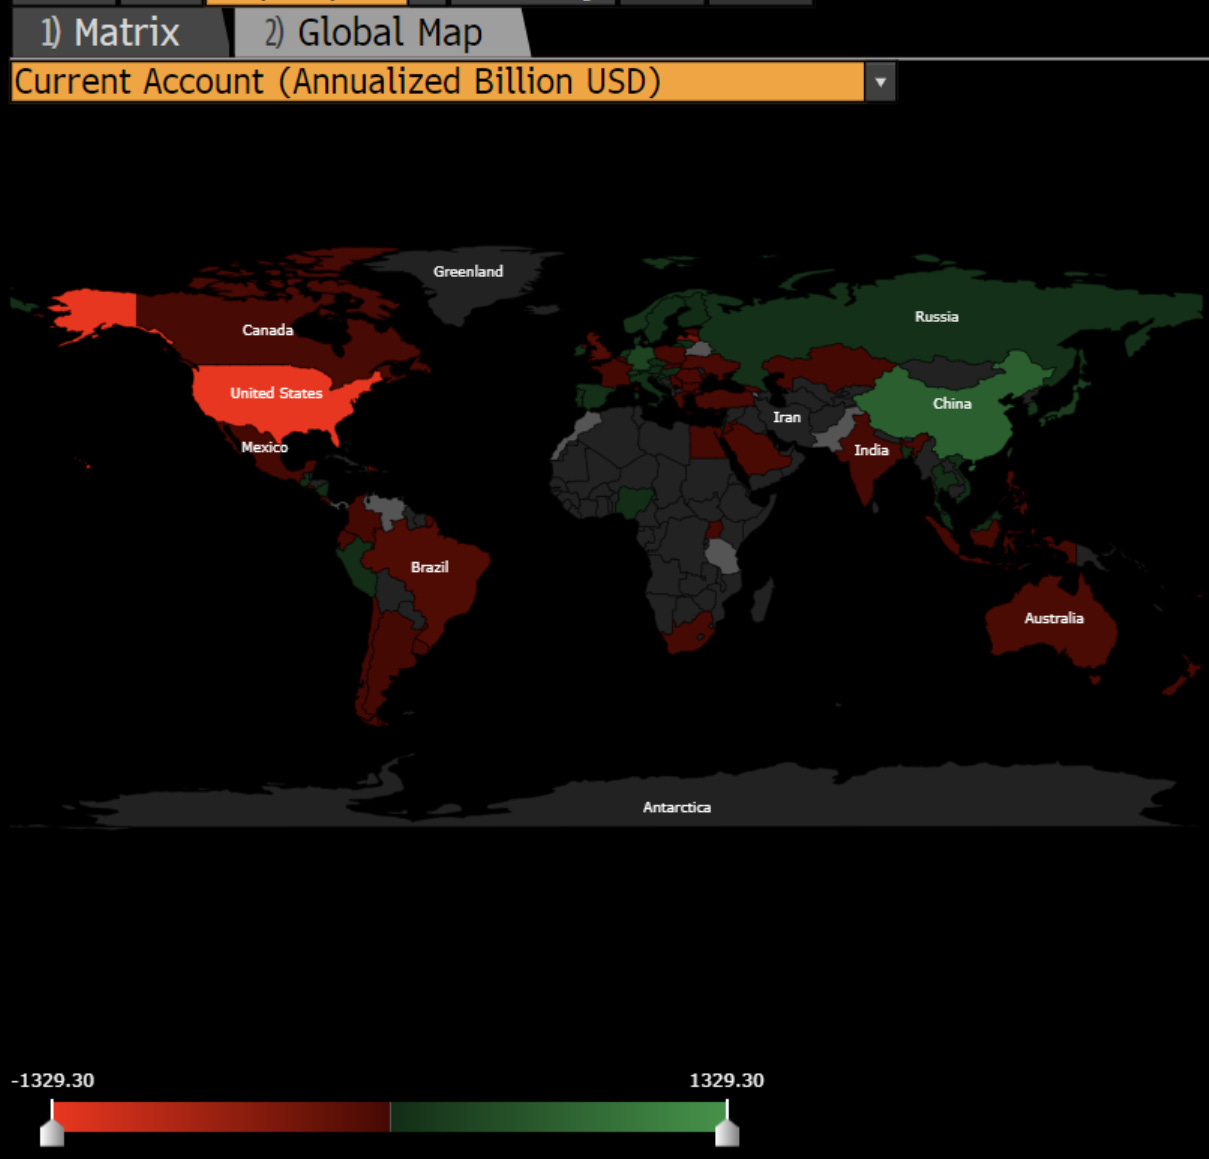
This entire system of global trade is distributed across countries that are either net importers or net exporters. The United States is the largest net IMPORTER in the world (the most red in the map below) while China is the largest net EXPORTER. Every other country falls in between these two countries.
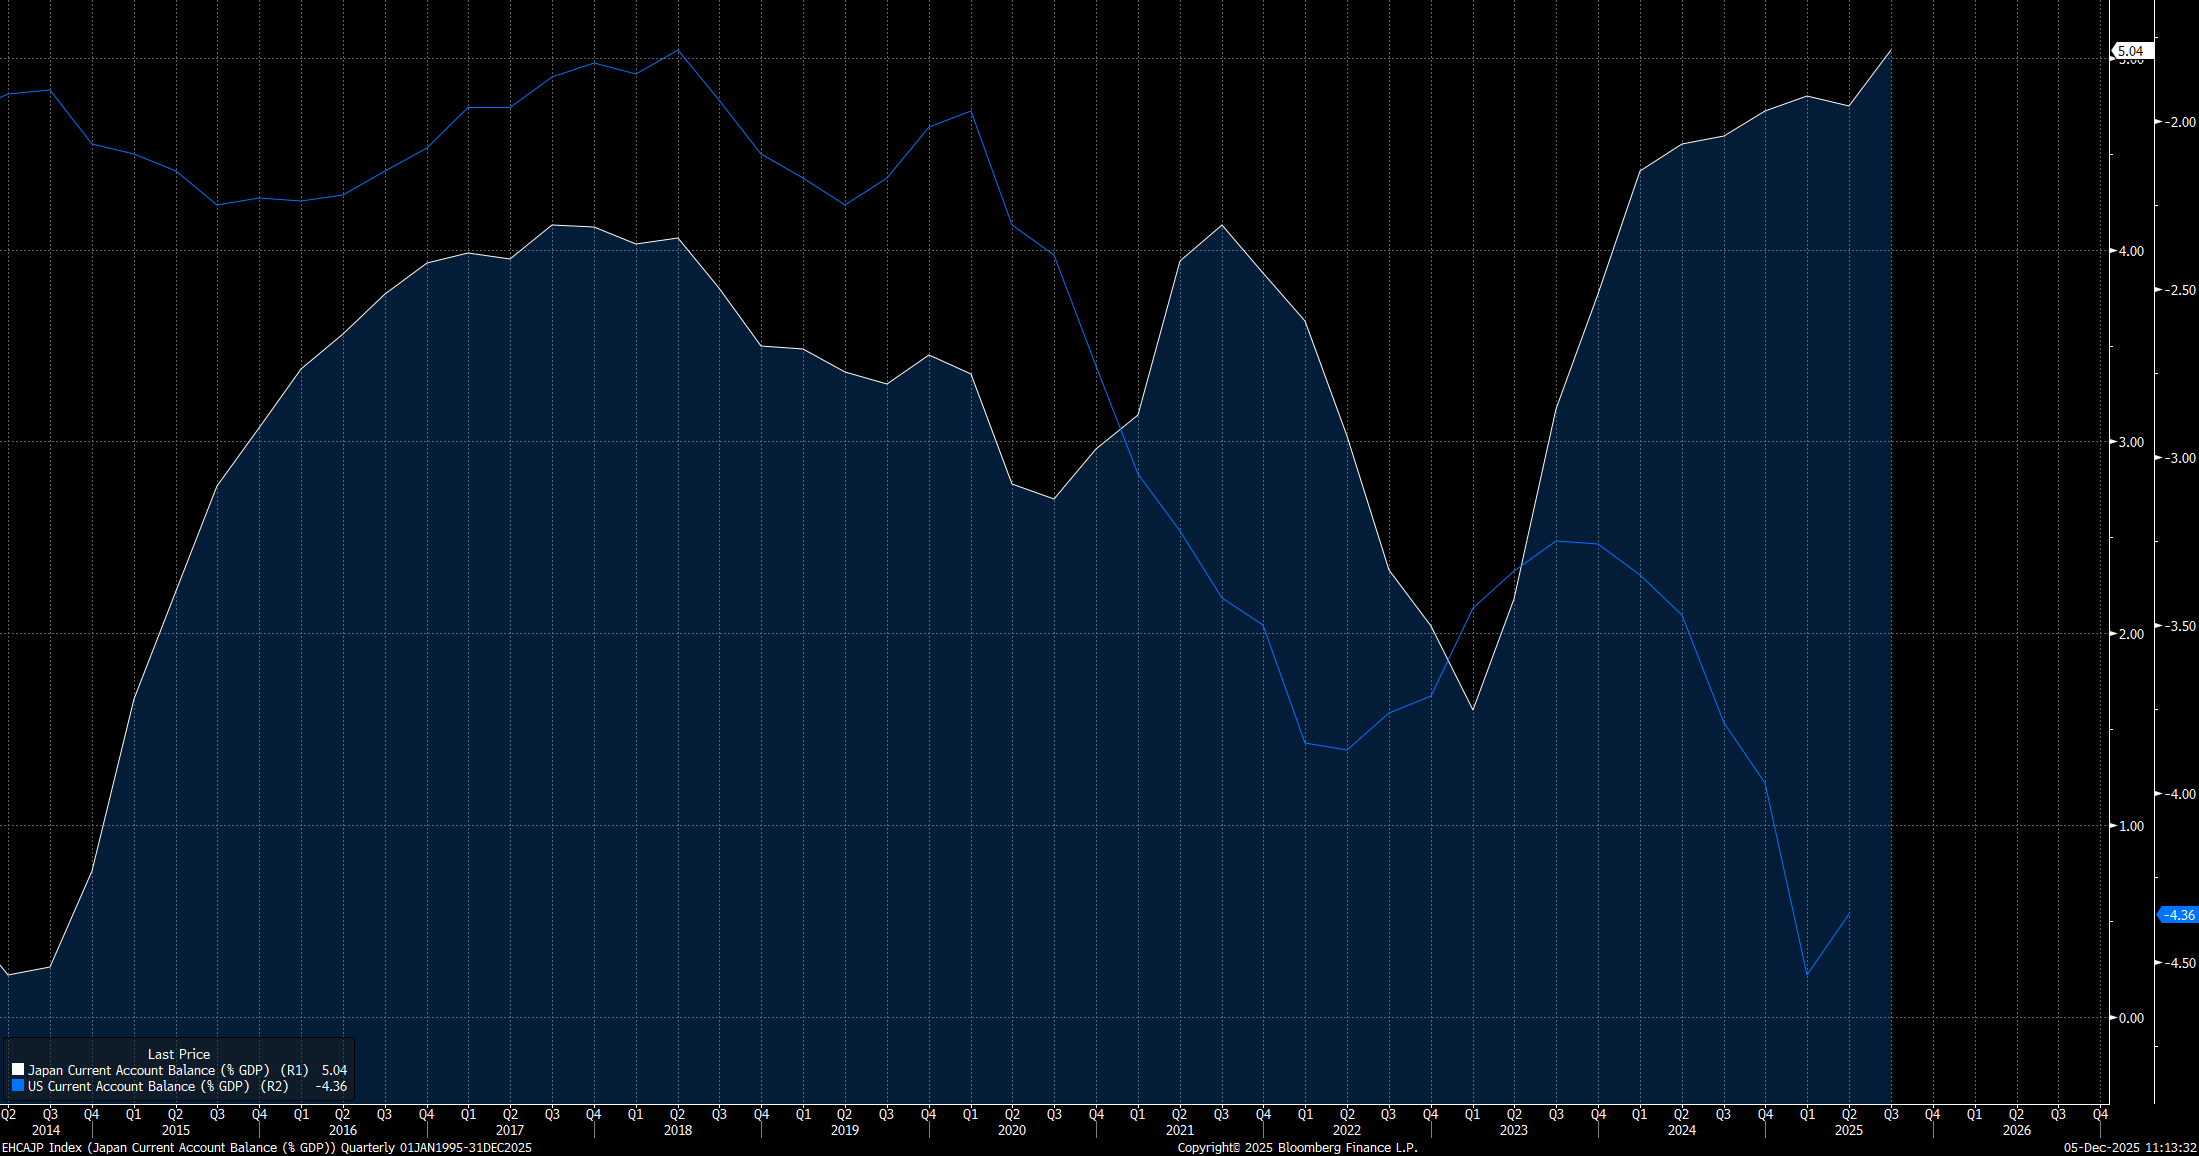
Japan is a net exporter compared to the United States who is a net importer of goods and services. In simple terms, Japan produces more than it consumes, so it ships the surplus (white line moving up) to the United States, which consumes more than it produces (blue line moving down).
Two critical things in the structure of Japan frame HOW it fits into the global system (this will be important to understand for yields and the carry trade):
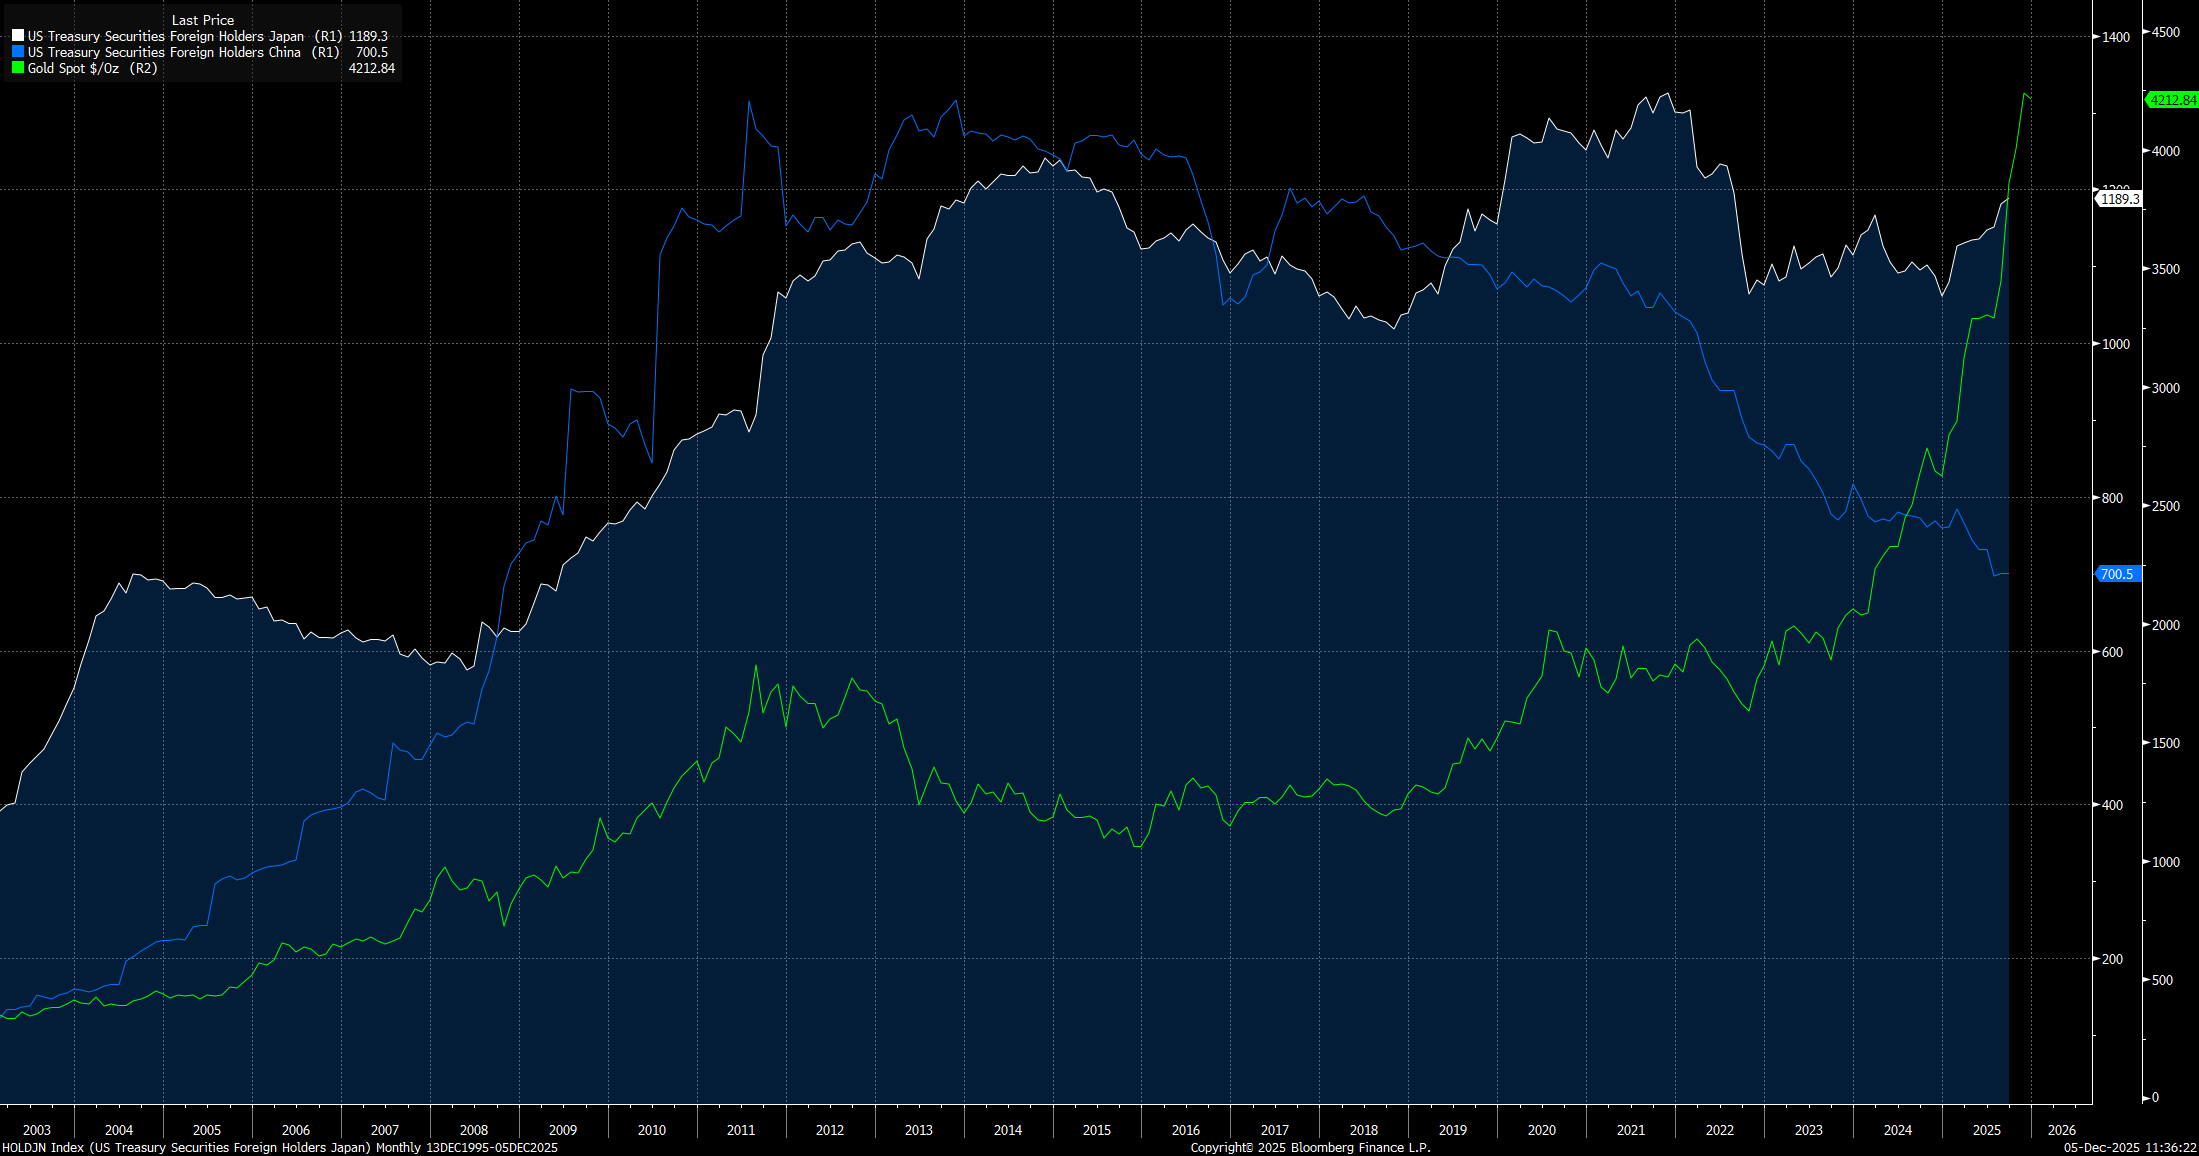
Japan is the largest foreign holder of US Treasuries. The implication of this is that Japanese financial markets are HIGHLY cross-collateralized with the US Treasury market.
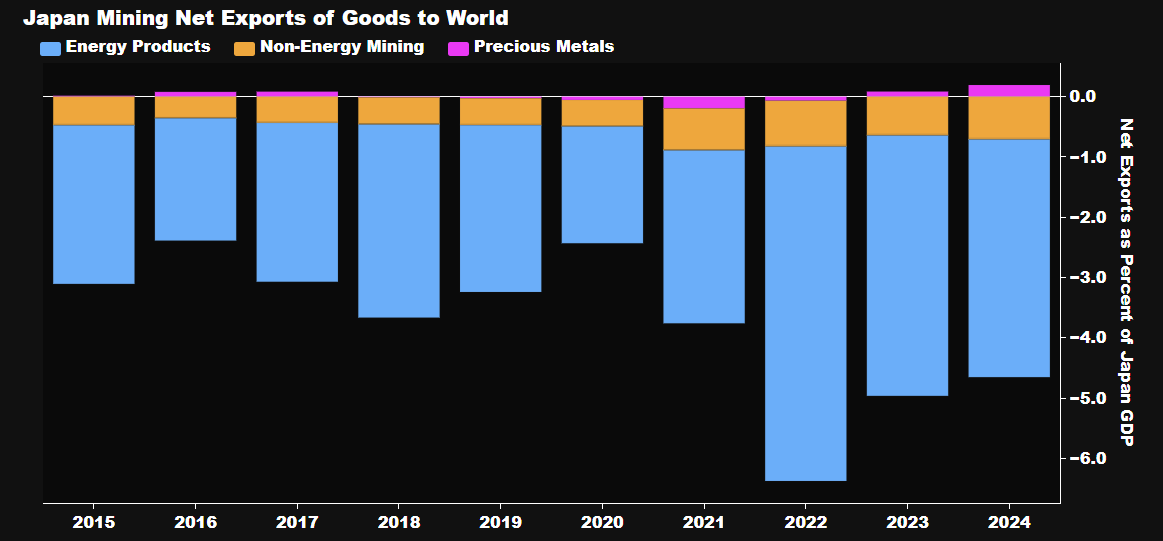
Japan is running a trade deficit with commodity-producing countries because it can’t produce them domestically. In simple terms, it is short commodities.
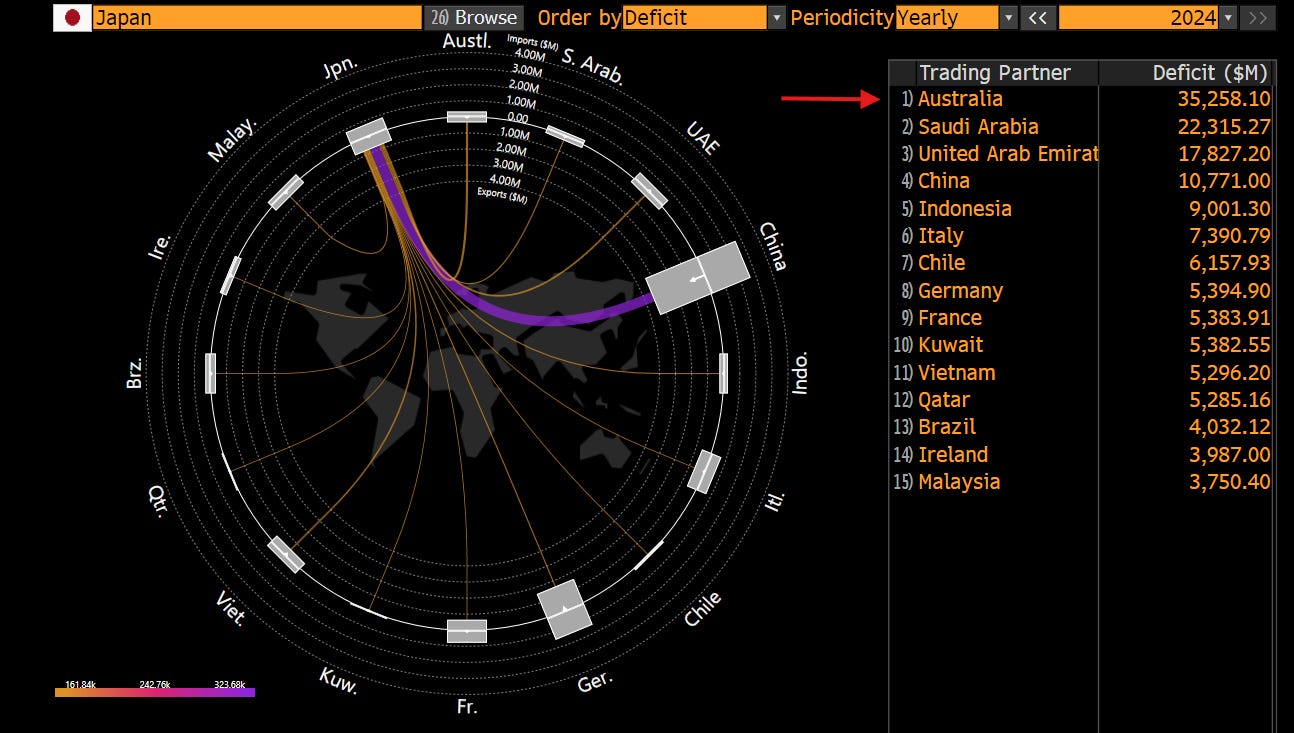
You will notice that Japan is a net importer of food (blue) and energy (tan)
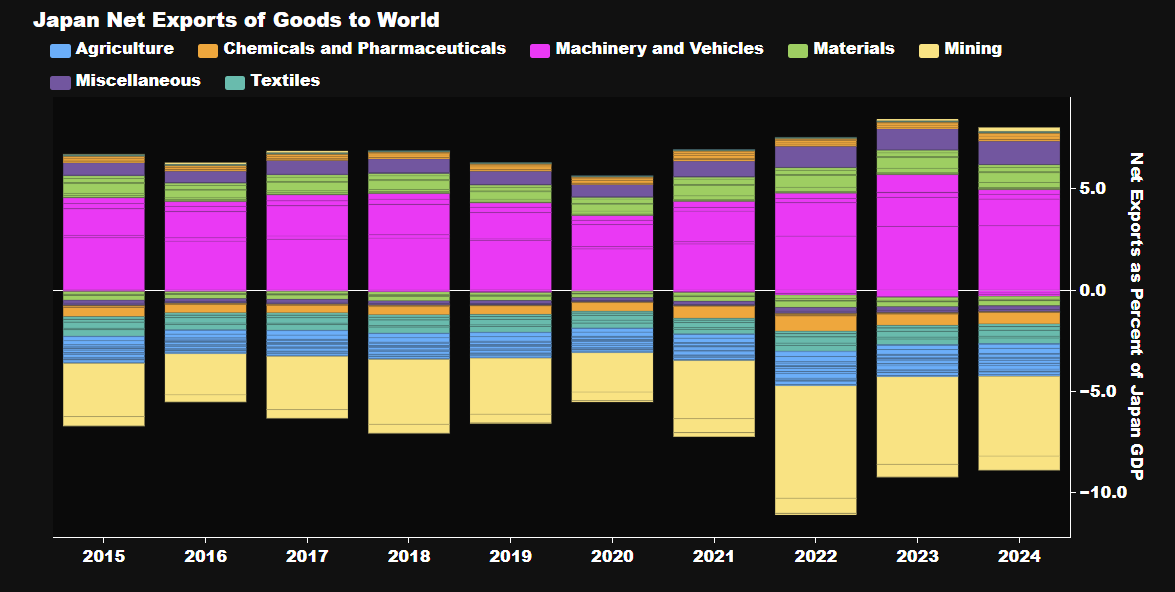
The net result is that Japan is massively short food and energy. The implication of this is that changes in the currency have a much greater impact on domestic inflation than on countries like the US or China:
This structure of global trade and how Japan fits into it frames the reflexive feedback loop we are seeing taking place between yields, the yen, and domestic inflation.
Reflexivity In Japan:
If you understand Japan’s structural regime along with the current reflexive dynamics in markets, you can see the risks that are accumulating and why consensus is fundamentally misreading the carry trade.
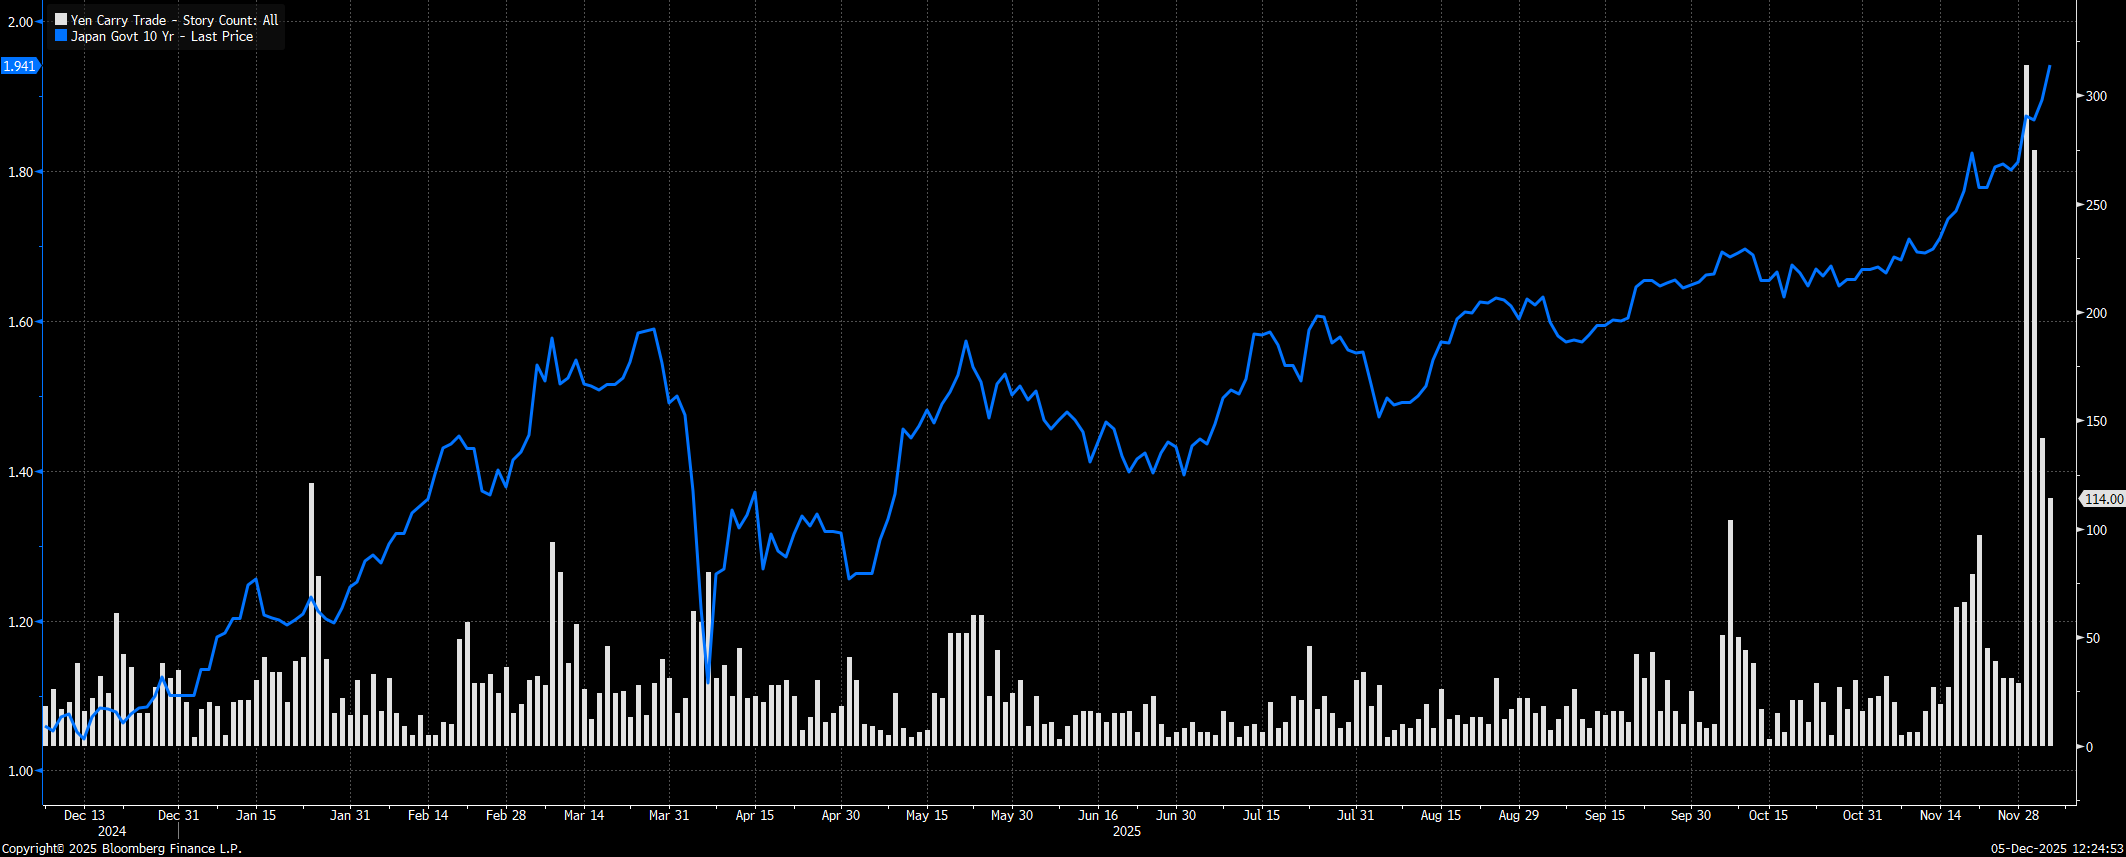
Notice that JGB yields have been rising all year, but only recently have people begun to worry about the Yen carry trade as if the rise in JGB yields creates an imminent risk for the entire system to blow up. The problem with this fear-mongering is that it misinterprets what is actually happening and doesn’t see the opportunity that is actually building.
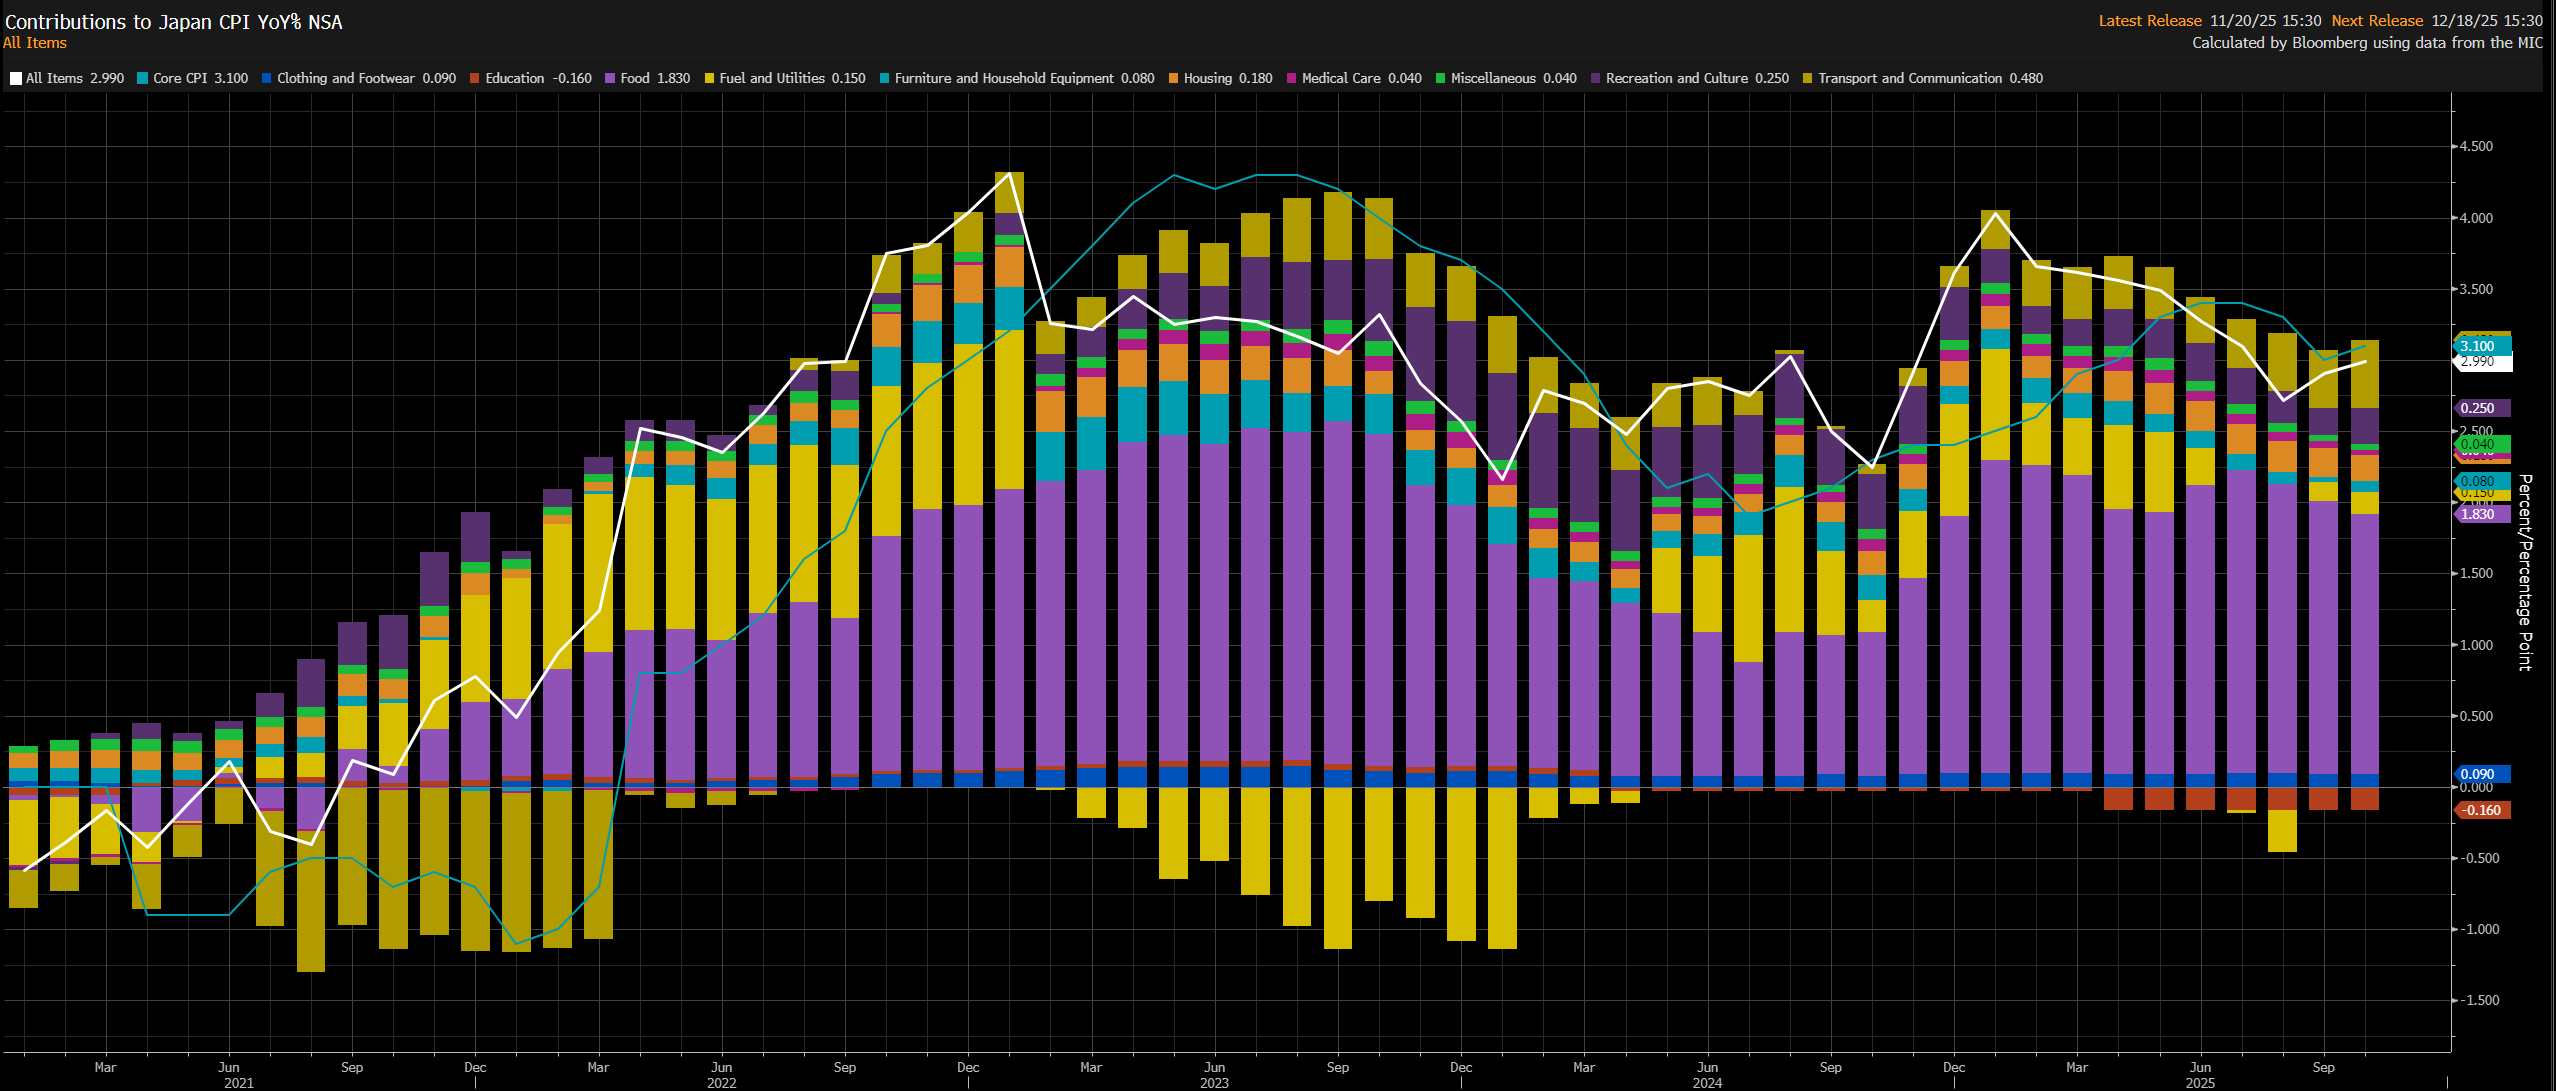
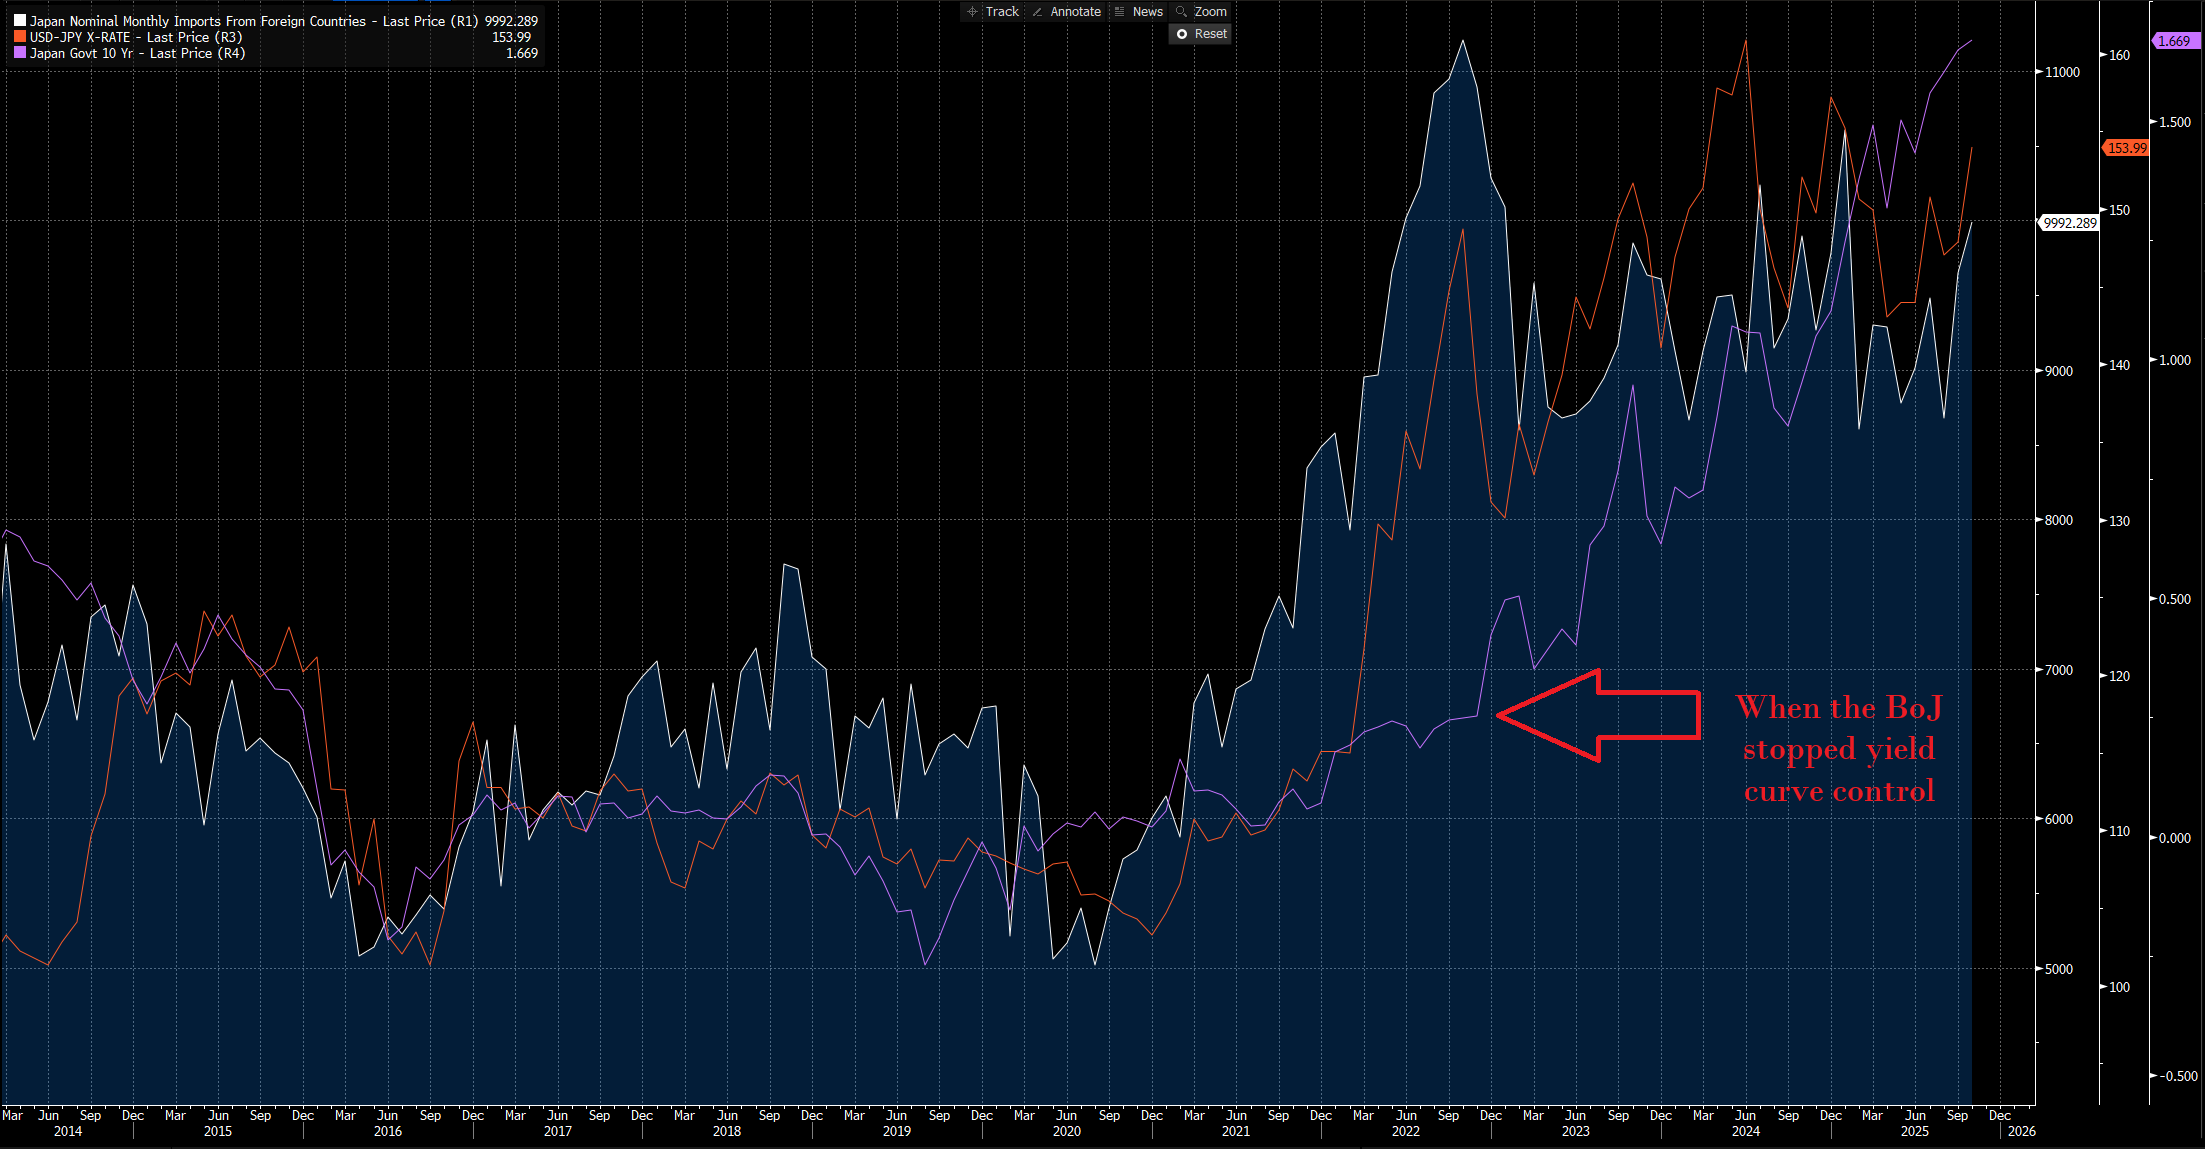
Main Idea: Japan’s inflation is running well above target, creating upward pressure on long-end yields (notice how large food inflation is). A reflexive loop has formed where a weaker yen is importing more inflation, pushing yields higher and driving the currency even lower.
The idea here is that ever since the BoJ stopped doing yield curve control, the inflation from a weaker currency is GREATER than any pressure that higher yields could put on the economy.
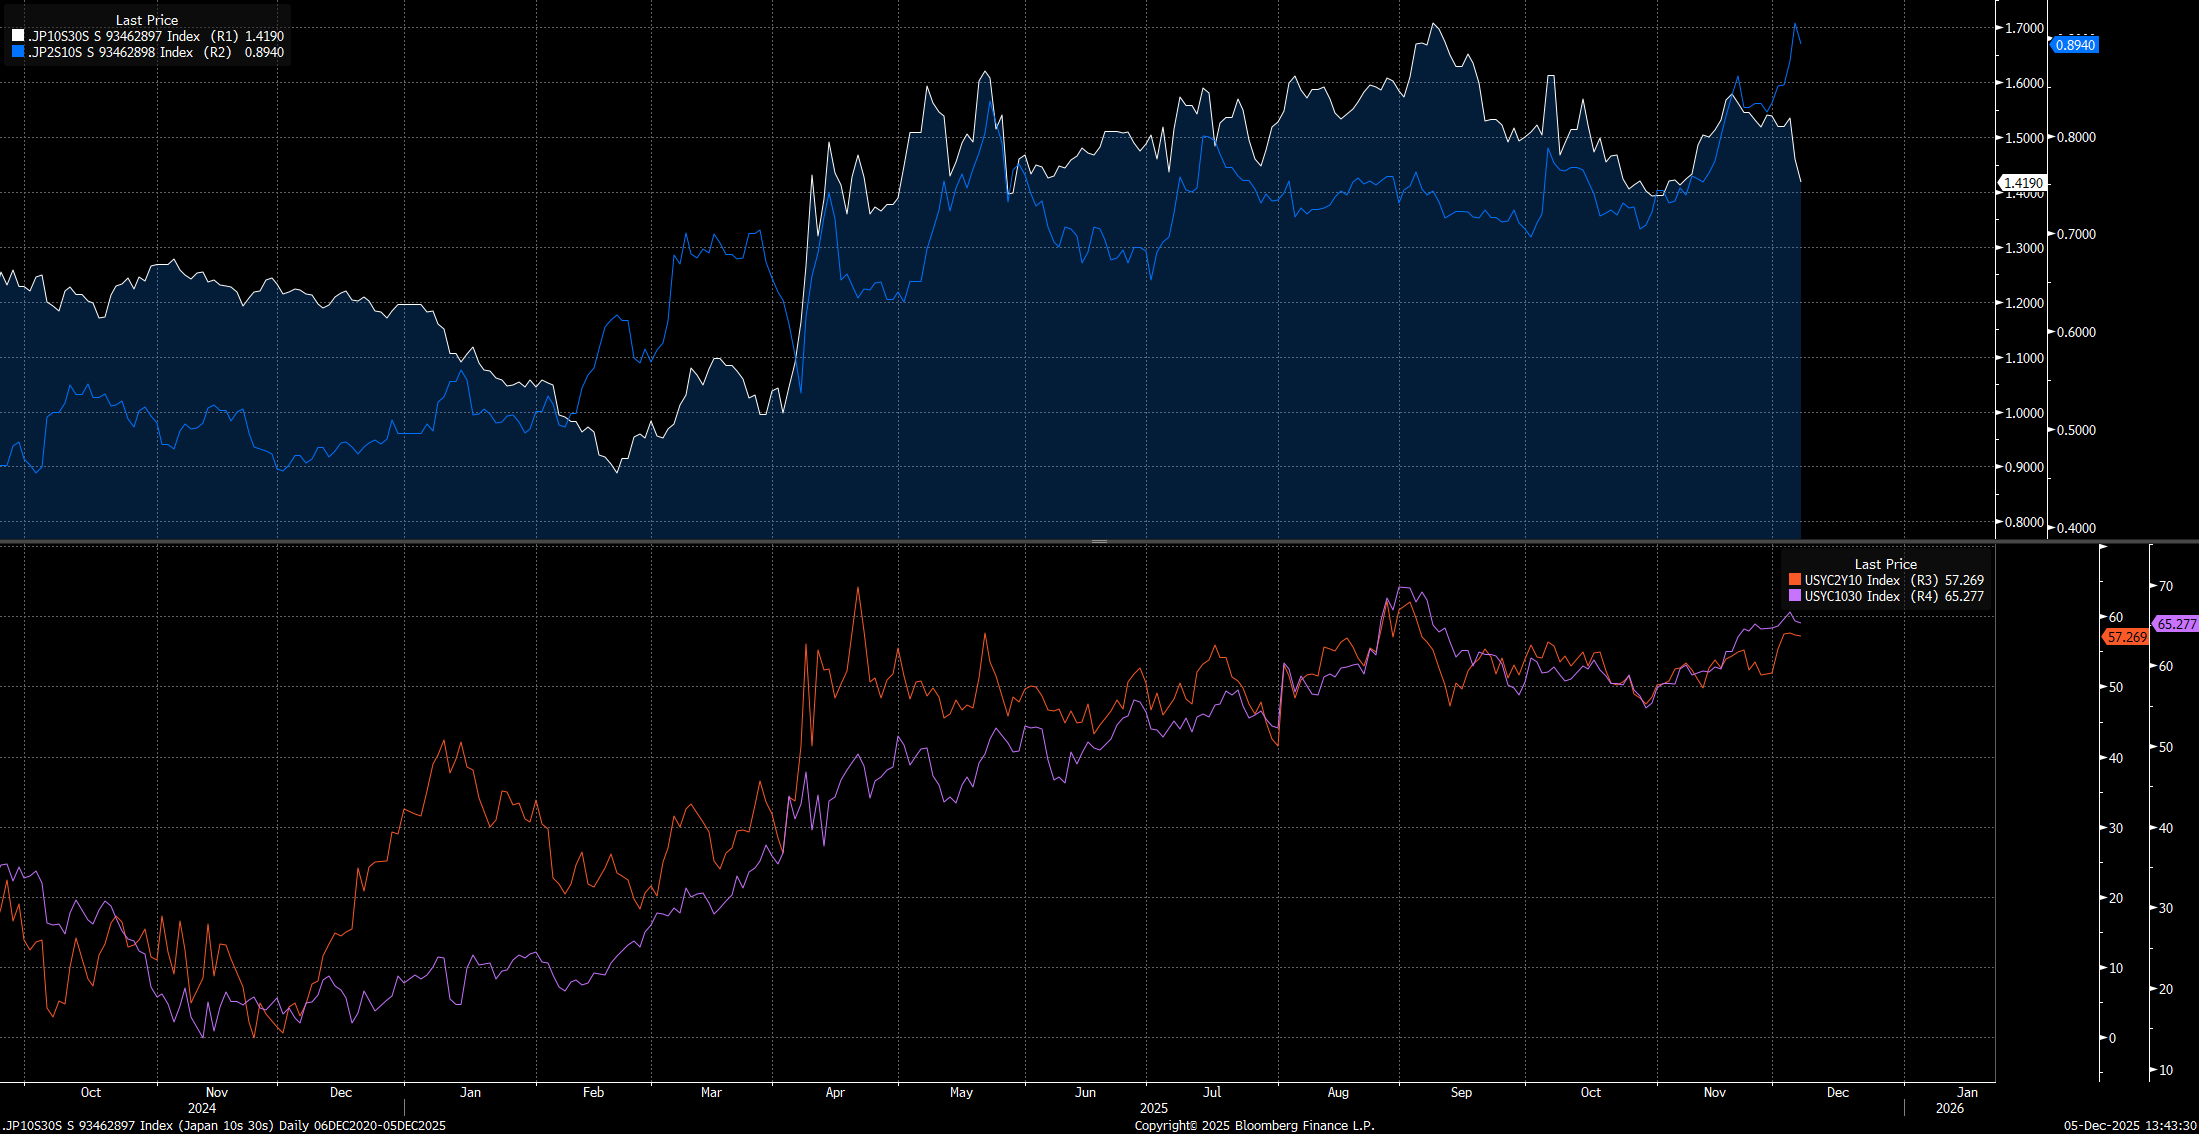
The phrase, “the cure for higher prices is higher prices,” is being felt in real time, and this is where we can connect the import prices vs real imports to the fixed income complex. In the chart below you can see that the 10s30s curve has begun to flatten marginally becuse the higher nominal imports (white) are outpacing real imports (blue). In simple terms, the impulse causing higher yields is fading marginally, which is why 10s30s is flattening. In the pass through mechanism, there is a marginal degree of stagflation as nominal imports run above real imports.
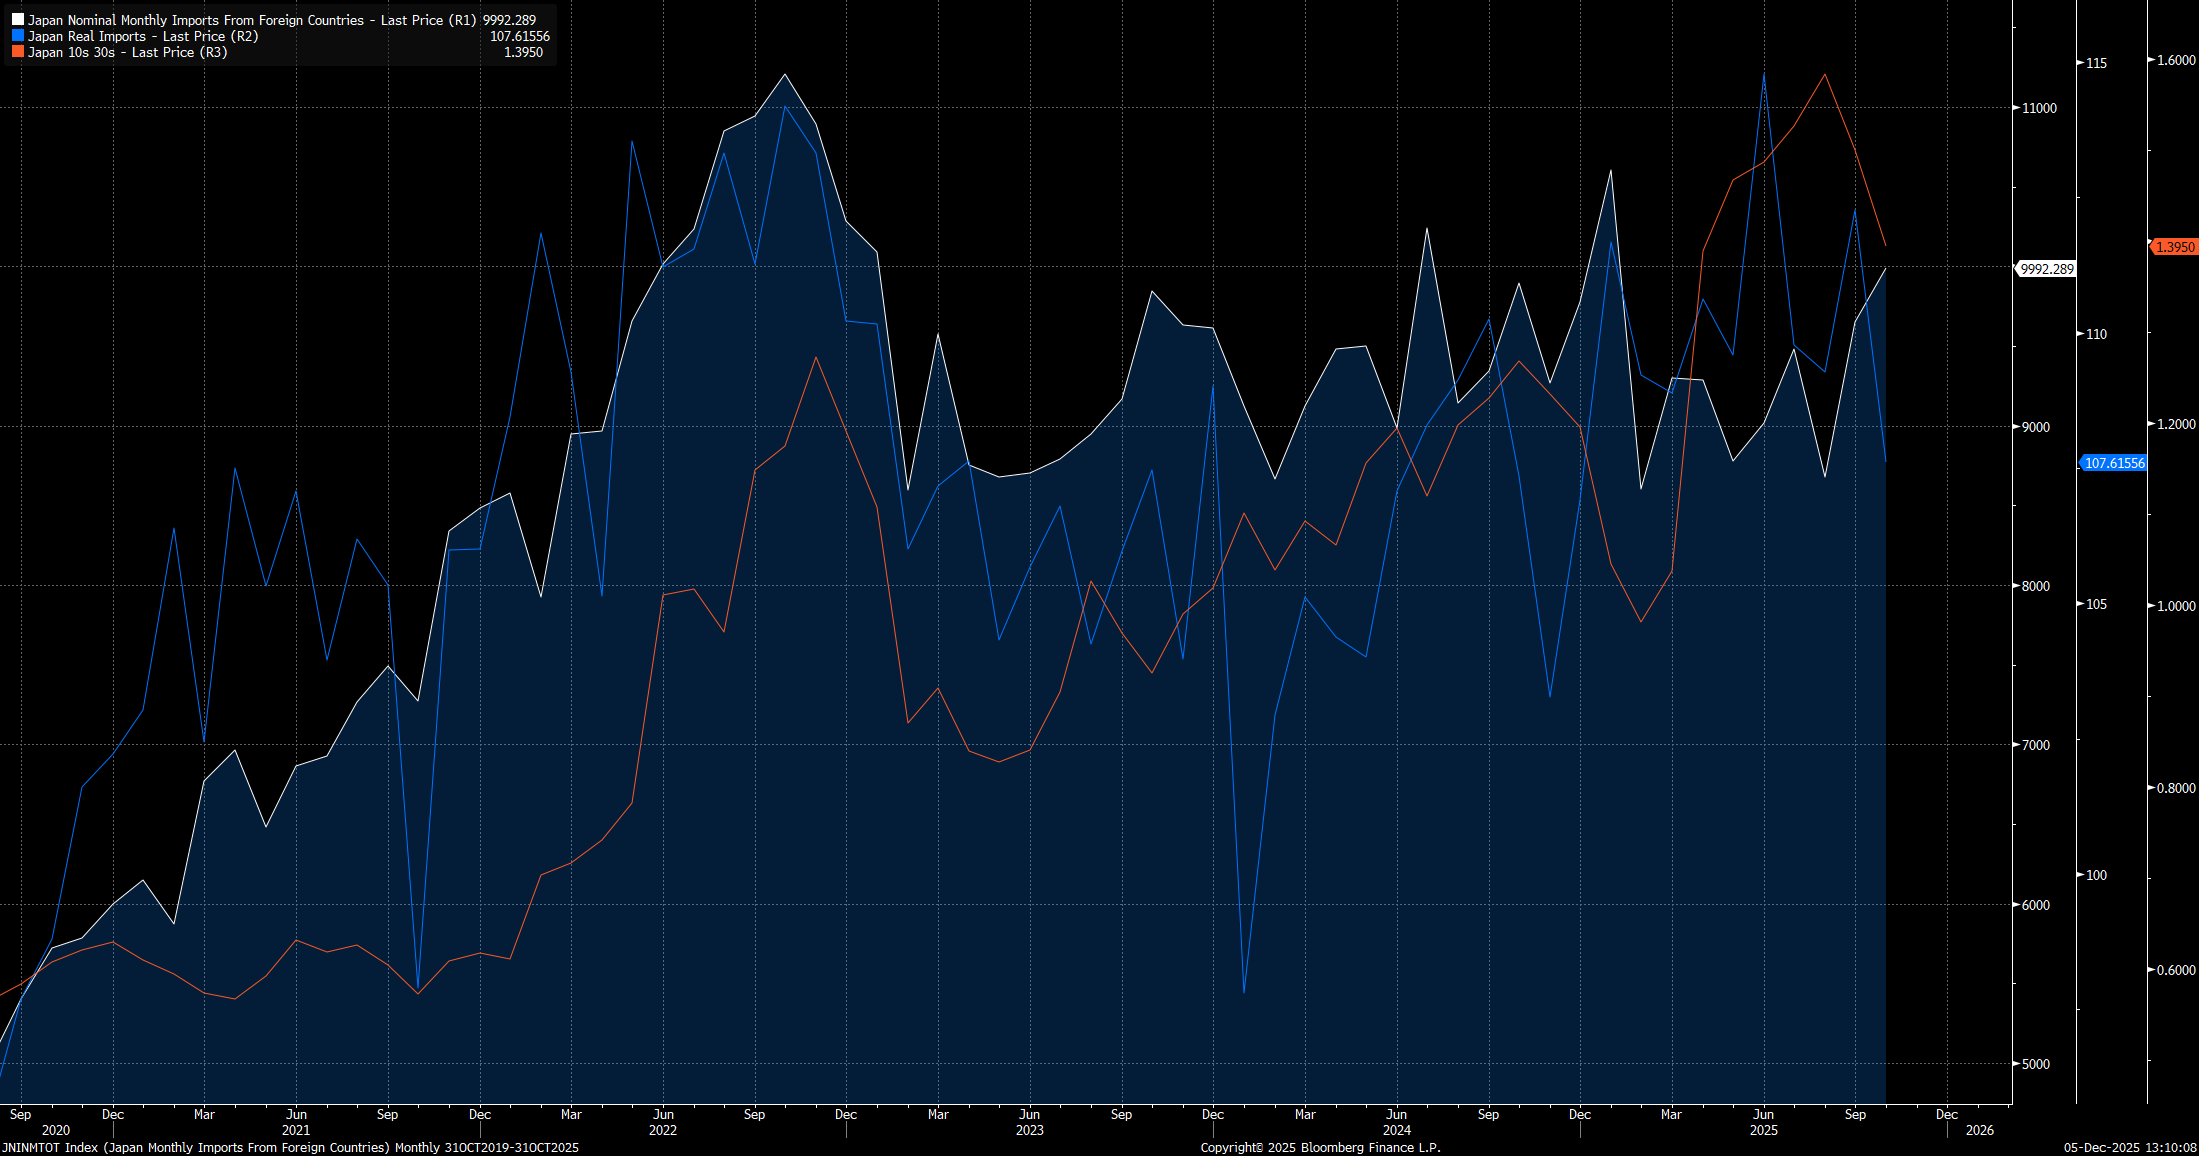
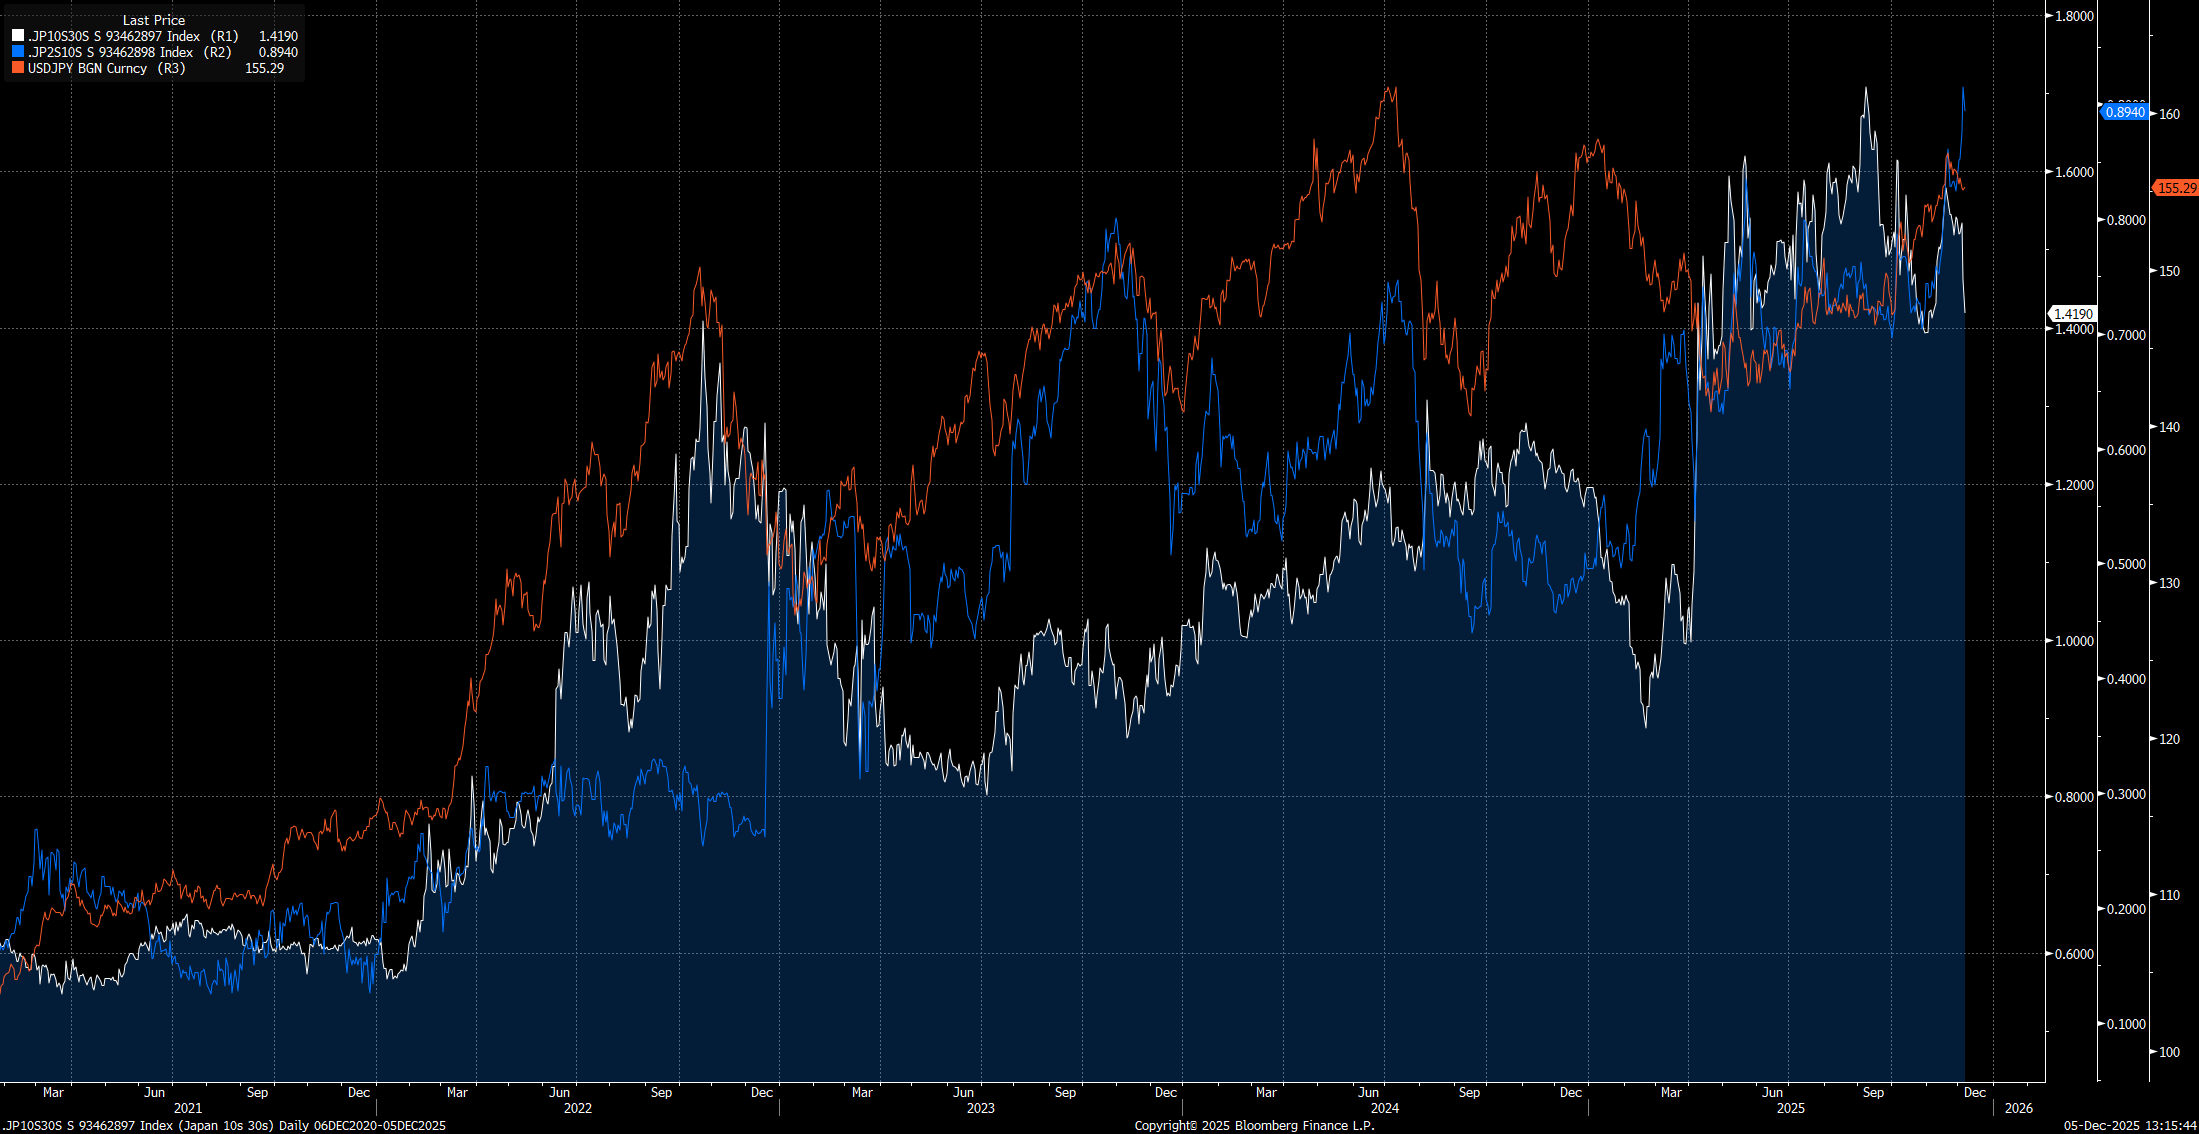
Once 10s30s and 2s10s in JGB yields begin to flatten more, this will likely be an indication that the impulse driving yields higher and the currency lower is beginning to fade.
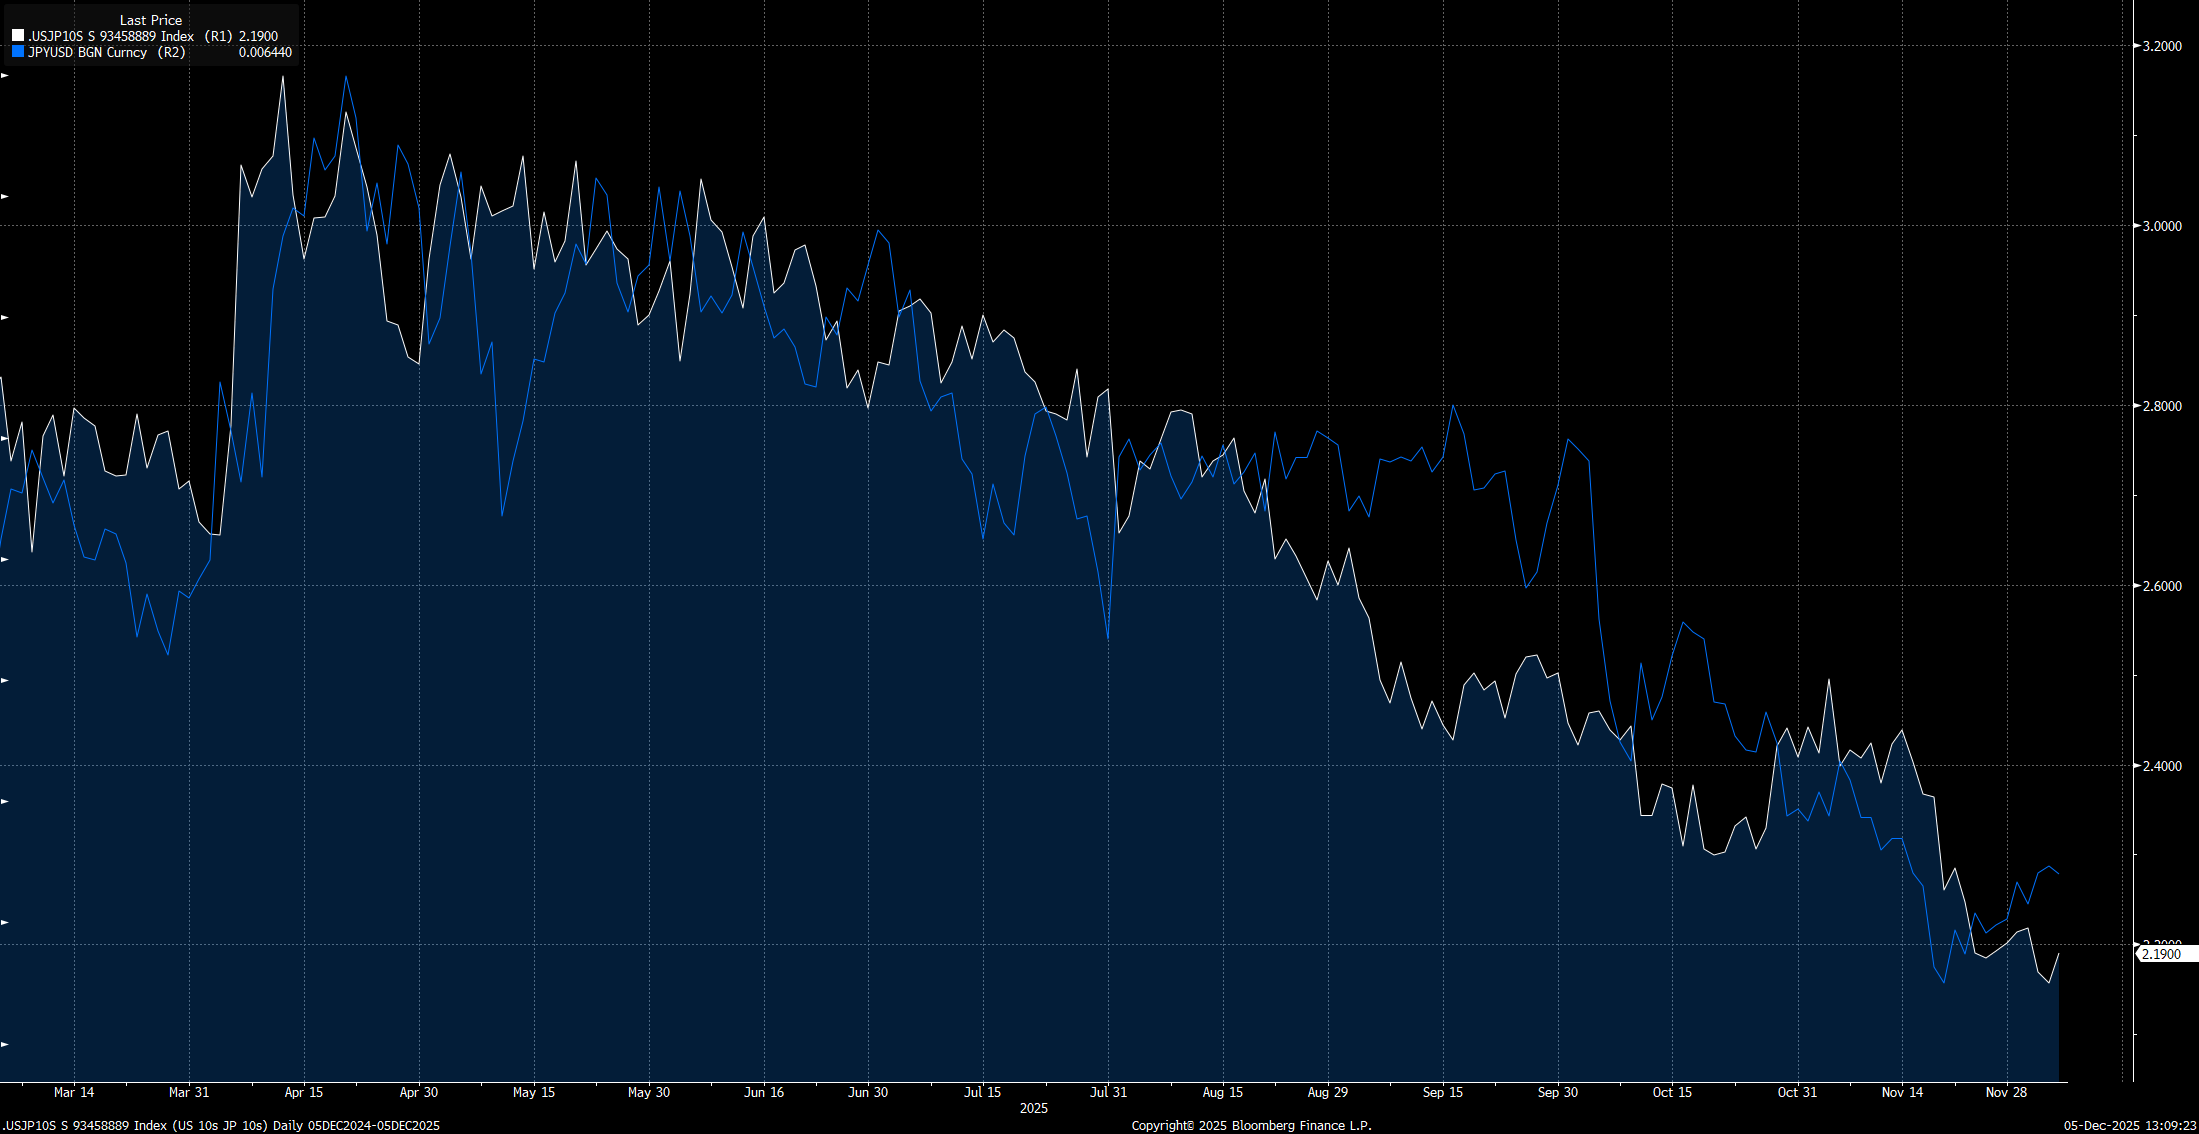
The biggest misconception about the Yen right now is that the higher yields in Japan are going to push US yields higher but the OPPOSITE is actually taking place as US yields fall against JGB yields (white) and the Yen falls against the dollar. In simple terms, this idea that the Yen is going to blow up and cause US rates to explode higher is misguided.
The key insight and opportunity that exists is HOW this is falling into the larger framework about macro risks that are building.
Macro Risks:
I have been mapping the larger macro risks in the system and how they are all culminating in the endgame with the dollar and geopolitics. You can find the report and the connected video providing an overview here:

You can find the allocation playbook where I map the following here:
Mapping portfolio exposures and where they can actually break
Building a path‑dependent decision tree instead of guessing in real time
Setting concrete signals, models, and a framework for action

And the factor models that will provide a clear view into HOW equities are converging in alignment with macro flows here:
All of this is falling into the much larger geopolitical endgame framework I laid out here:
So how does Japan connect to this? We are seeing the weaker Yen bring in inflation AND more liquidity as the Nikkei earnings yield compresses. In simple terms, liquidity is driving the Nikkei higher, not domestic growth. As the quantity of money in the market and inflation in the economy rise, real yields are rising, but it’s clear that it is nowhere near enough for equities to fall.
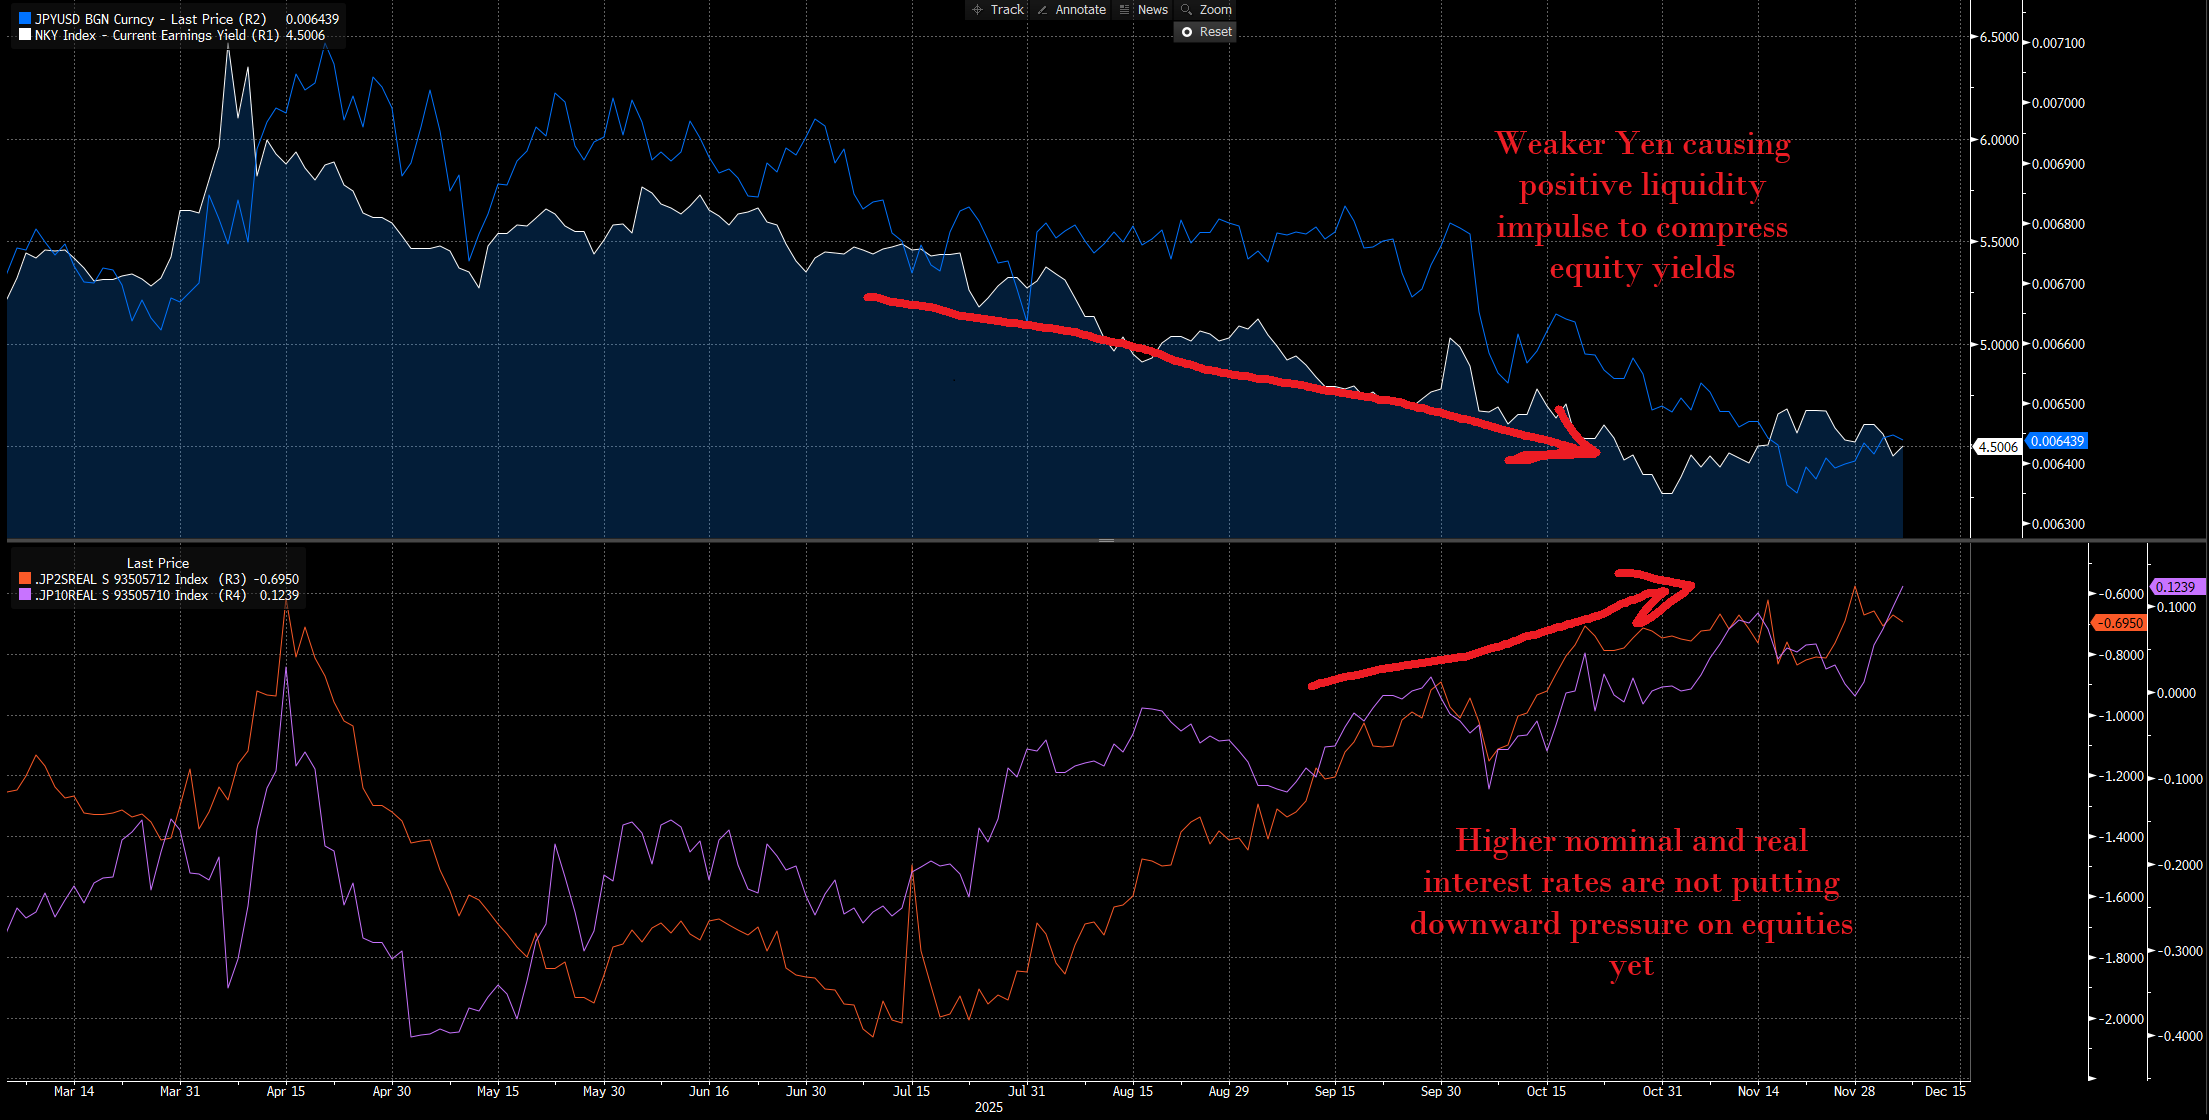
The entire reflexive feedback loop taking place is that higher yields and higher equities are a result of a weaker currency. The problem is that the weaker currency is pushing equities and yields higher. How long can this go on for? Functionally, until we see a significant crack in the Japanese economy that causes lower yields and lower equities. The problem is that if this overlaps with a deleveraging in the US, the amount of volatility injected into markets is going to amplify in a MASSIVE way.
In my view, the yield differential between the US and Japan (white line showing US yields falling against JGBs) is moving in lockstep with gold and silver prices because investors are aware that the current liquidity in markets is highly unsustainable, so they are trying to allocate to the release valves of macro liquidity. This is why there is an almost perfect relationship between the yield differential (white) and the metals.
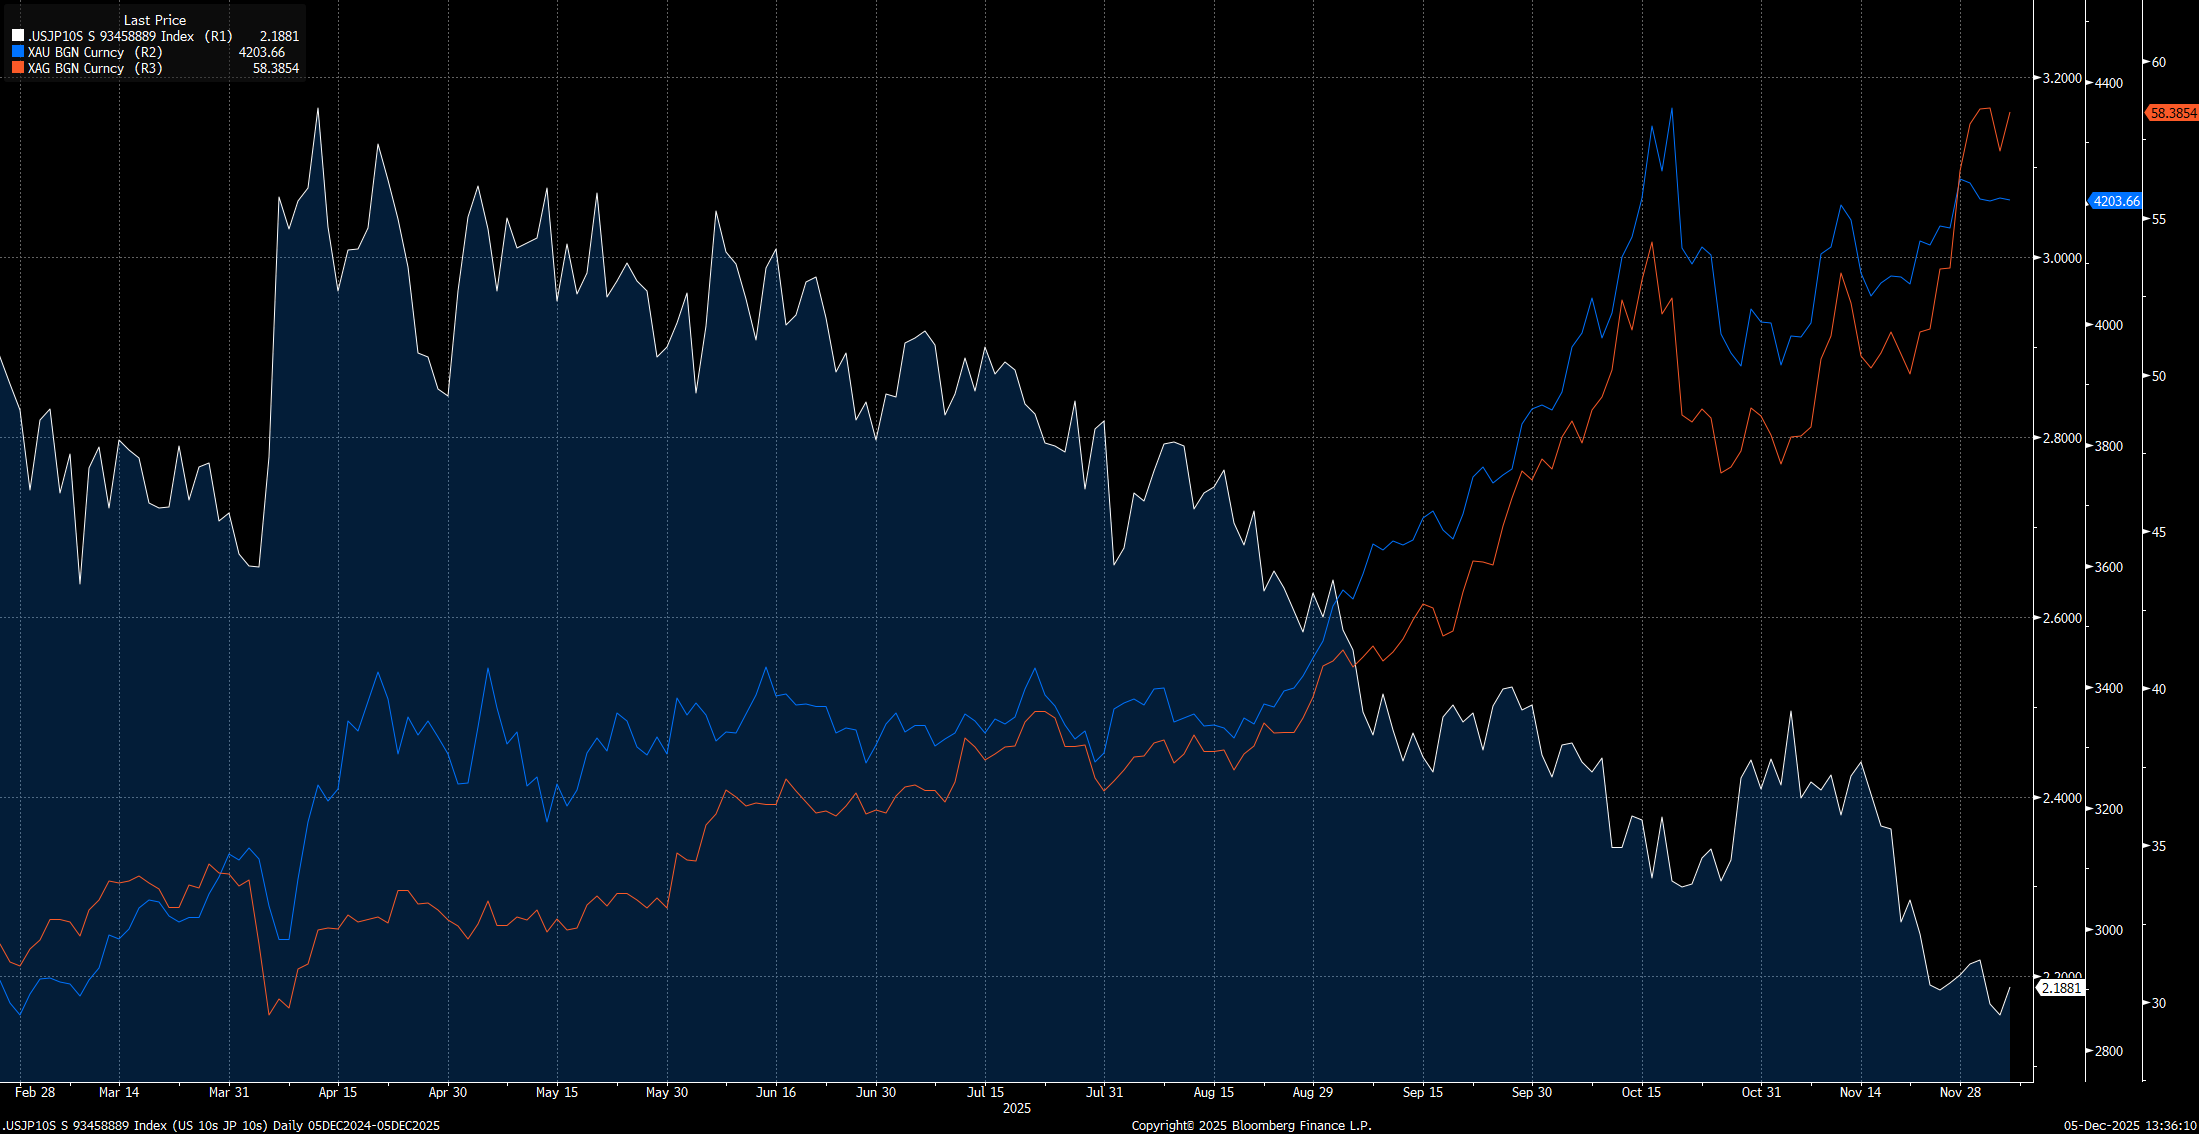
In simple terms, there is too much liquidity and inflation in Japan, which is resulting in higher yields, higher equity prices, and a weaker currency. On the US side, we are seeing too much liquidity in markets, but it isn’t materializing into inflation yet because of the weaker labor market and the fact that the US is not short food and energy prices like Japan.
This is why it will be very important to watch the yield curve differentials as we move into this period of time where macro risk is accelerating.
Pulling Views Together:
The bottom line is that the reflexive feedback loop we are seeing in Japan is unsustainable, but the popular narrative that the Japanese carry trade will crash US equities and send yields higher misinterprets the actual drivers.
It is my belief that macro liquidity is pushing the underlying system to a point where it is unsustainable. The question is all about HOW this links to positioning and the real-time signals in Japanese markets? How does the Japanese yield curve connect with WHERE gold and silver could go from here?
To go deeper and make this as practical as possible, I’m hosting a live, closed‑door webinar for Capital Flows Community Members on Monday, December 8th at 9:00 am EST.
In that session, I’ll walk through the full implementation playbook:
How I’m thinking about allocation decisions as it relates to the Japanese Yen, JGB yields, and the signals for WHEN risks are building.
How to map the scenario analysis and quantify the drivers, so you’re not guessing in real time.
How these connect to the new TradingView models we launched, so that you have the proper modoels to map things in real time. (See Tradingview models here: LINK)
This is a really good moment to step inside the Capital Flows community: become a paid member for a month, get the live webinar plus everything behind the paywall, and if it doesn’t feel like a clear upgrade in clarity and conviction, just cancel after the month and keep what you learned.
Livestream link is below for the Capital Flows Community:
Keep reading with a 7-day free trial
Subscribe to Capital Flows to keep reading this post and get 7 days of free access to the full post archives.