


The chart below shows WHERE we have traded in the Z5 SOFR contract, which is pricing the Fed’s actions between now and December. This contract rallied and then retraced its move multiple times during the NFP print and CPI print, indicating 75bps is likely the MAX amount of cuts for this year in light of the current information.

This rise in the Z5 contract caught positioning offsides and caused implied volatility to rise considerably. We see short-end volatility (white) rise in lockstep with equity volatility. This combination of equity and rate volatility rising together is one of the reasons we have seen such an aggressive sell-off across risk assets.

As I have noted in the macro report, the underlying conditions of the economy continue to create a period of low delinquencies. This means we are unlikely to see growth scares materialize into recessions.
Comprehensive Macro Report: Geopolitics, The Risk In China, and The Carry Trade Unwind

The Monthly Macro Economic Report Is Below:
The fact that we are in a macro regime and unlikely to move into an imminent recession is actually known very well by market participants. You will notice that the 3m2y spread pricing the aggressiveness of cuts on the forward curve was pricing almost 150bps in Sept of 2024. This spread has reconverged closer to zero and is now pricing 27bps. This means that the forward curve might be a marginally rich pricing 75bps vs 50bps for the Z5 contract but it’s not at a crazy extreme.

You will notice that we are currently pricing 65bps for 2025 and 18.6bps for the first half of 2026. The implication is that are in a much tighter range on a cyclical basis.

On top of this, we are beginning to compress in a short-term range on the long end as we move into FOMC.

Now, traders are going to bleed a little bit of premium into FOMC as implied vol premiums (green/red bars) exist in this range.

As long as we maintain an implied volatility premium in BOTH bonds and equities with a negative stock bond correlation, then it’s going to take a significant information catalyst to create a bottom in equities. As a result we operate in the tensions between these premiums, and it is here where trade opportunities present themselves.

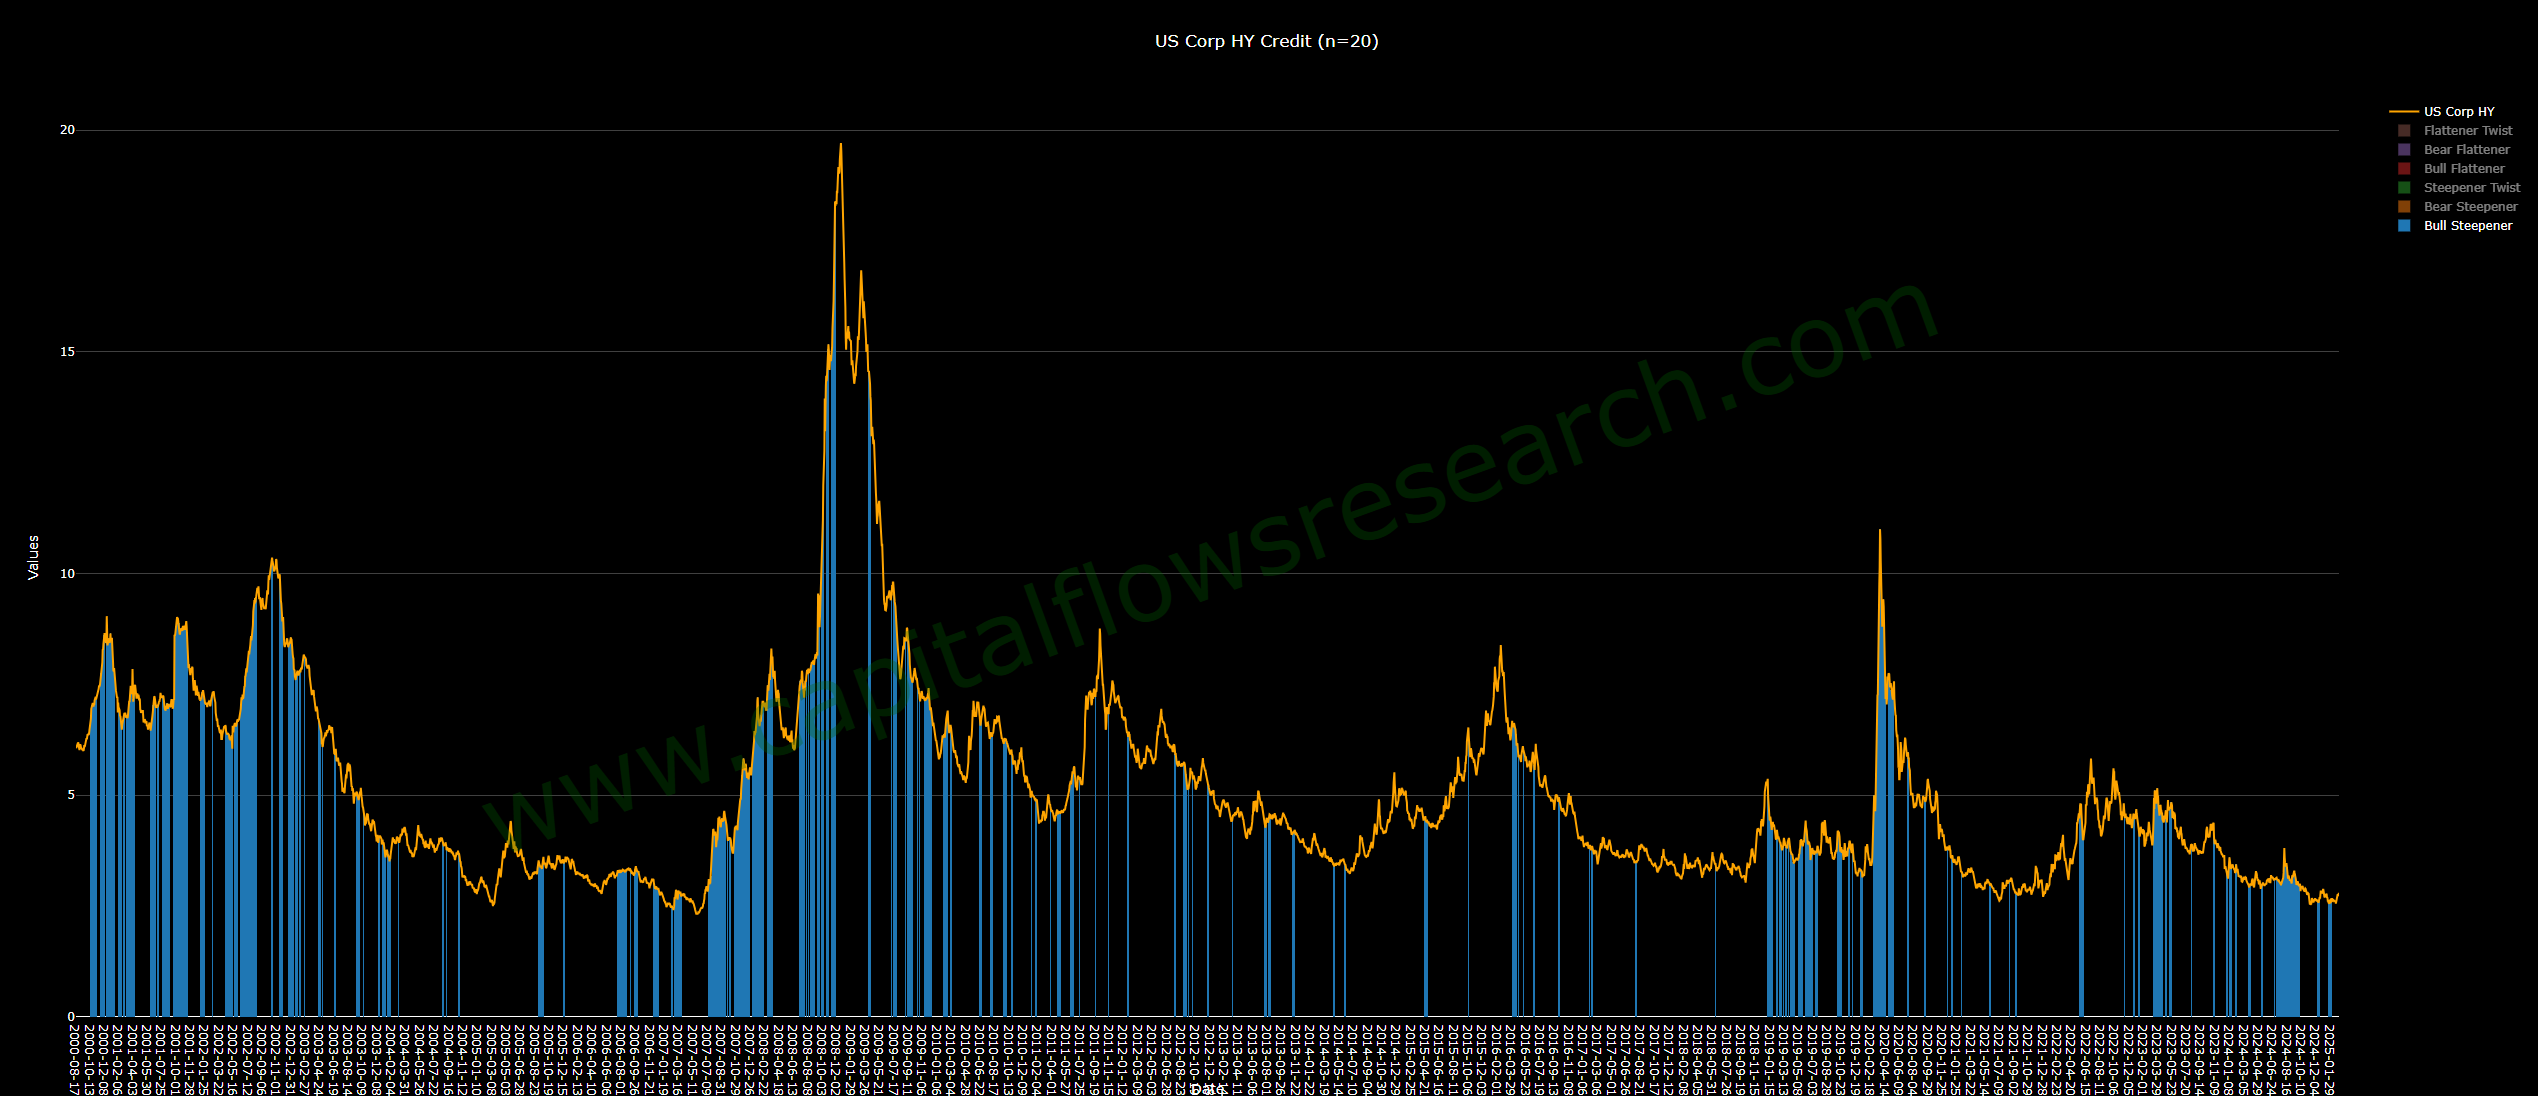
The final thing I want to note before getting into the specific risk reward of assets is this chart that’s in the Macro Regime Tracker every day (link). This shows the rate of change in credit spreads along with the 2s10s yield curve regime. What we have seen is that the rate of change in credit spreads turned positive during bull steepening. What does this mean? Bull steepening occurs when significant rate cuts are being priced AND long-term nominal GDP expectations are falling.

You can see that the majority of the steepening during the 2008 housing crisis was bull steepening as credit spreads rose:
The same happened during COVID-19.
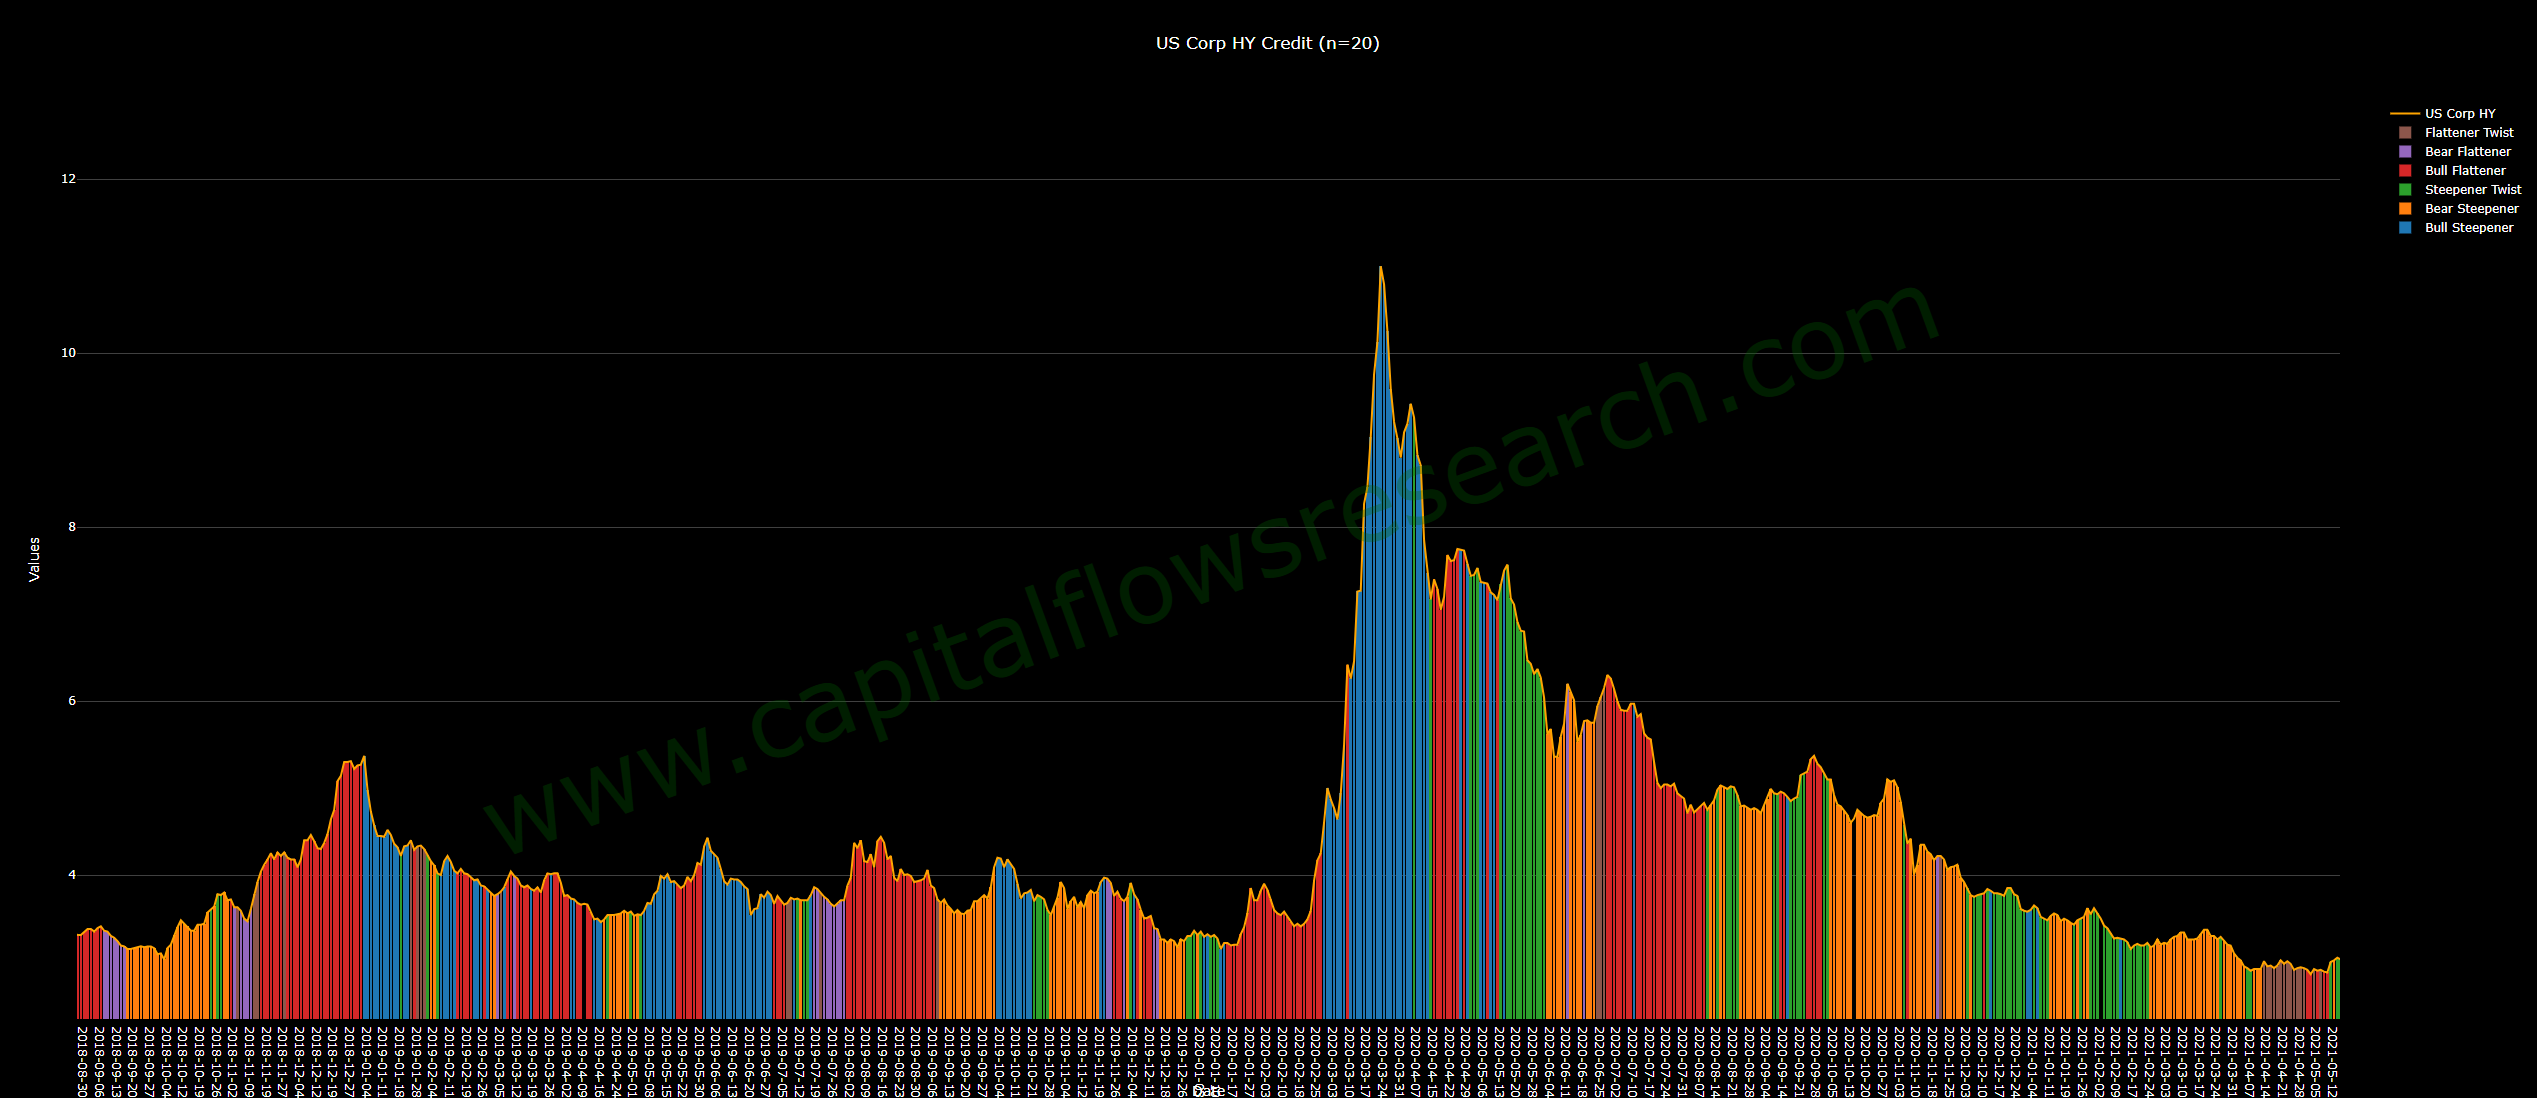
The implication isn’t that bull steepening = recession but that bull steepening + rising credit spreads due to detoirating growth can cause durability in these types of moves. Bull steepening occurs frequently, but we need to ask if the TIMING and DURABILITY are aligned. As you saw from the chart above, even the run up to 2008 wasn’t a clear, straightforward path.
This brings us to the specific trade implications and risk reward of assets for equities, bonds, and Bitcoin.
Trades:
Keep reading with a 7-day free trial
Subscribe to Capital Flows to keep reading this post and get 7 days of free access to the full post archives.