


I want to start this report with one of the most influential ideas I have been faced with in trading:
“You need to devise a way that allows you to have a different risk tolerance than ‘the market’ and a different ‘time period’ than ‘the market’. Neither of these two quantities should be fixed.”
This is from the Vitruvius Twitter account who shared a goldmine of trading wisdom from his time in markets:
What does this idea entail? It means that if I am buying or selling an asset, there is a person on the other side making that transaction with me. I need to ensure that I have a different time horizon than them because they are buying and selling for a very specific reason.
For example, suppose there is a liquidation in equities and someone is forced to sell their position at a specific moment in time. In that case, I need to be able to hold the asset for a longer period of time in order to extract the returns the seller is giving me. If I buy the asset and can’t take the volatility of the asset, then I will be stopped out (or liquidated) which will result in losing money.
This example applies to the constant volatility that is taking place in financial markets. At any one point in time in markets, someone is getting squeezed out of a position.
This is what we saw in August of last year and what we have seen at the beginning of this week.

The question we need to ask comes down too, is the most recent move a short-term unwind or indicative of a larger macro reality? If we can answer this question, then we can understand HOW to move forward properly.
Let’s dig in
Macro Tear Sheets:
One of the most important things you can reference every day are the Macro Tear Sheets. These break down all of the major macro relationships that exist. I would encourage you to continually review these to keep a clear read on the macro regime.
If you are trying to understand how macro impacts every asset class, check out the list of all the educational primers I have written here:
![[FREE] Educational Primers On Every Aspect Of Macro & Markets](https://substackcdn.com/image/fetch/$s_!tfas!,w_1300,h_650,c_fill,f_webp,q_auto:good,fl_progressive:steep,g_auto/https%3A%2F%2Fsubstack-post-media.s3.amazonaws.com%2Fpublic%2Fimages%2F69c49472-3d63-47f0-9b8c-2a682fa625f1_1024x1024.jpeg)
Macro Regime:
If we can understand the macro regime then we can understand HOW MUCH downside there is in equities.
We remain in a period where growth is positive but the higher level of rates is likely to put more downward pressure on growth. The Atlanta Fed nowcast remains just under 3% and we have a GDP print this week that will provide more confirmation about WHERE we are.

Q4 GDP is expected to come in at 2.7% real:

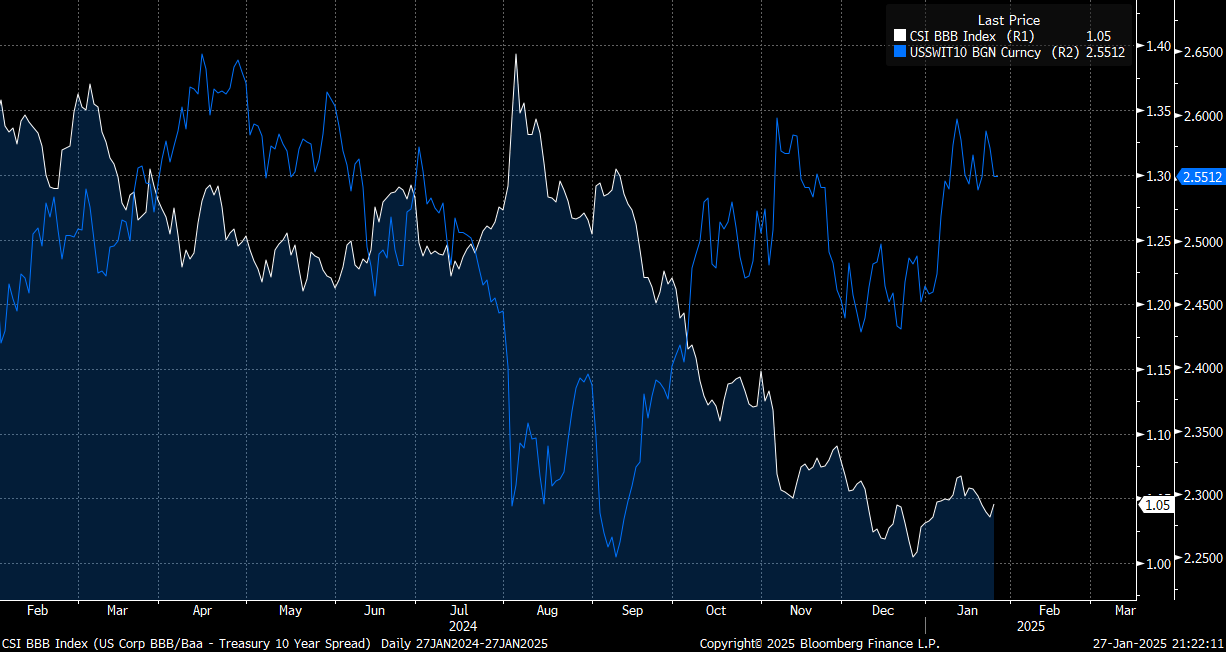
One of the primary relationships that has characterized this period of time is the low level of credit spreads and marginally elevated level of inflation swaps. What does this mean? It means the market is pricing low credit risk (from credit spreads) and a marginal degree of inflation risk (inflation swaps):
I laid out how this tension connects to the equity view in this video:

The main ideas for the shift in equities were laid out here:

We already know there are specific macro risks surrounding equities. Macro liquidity is contracting at the same time valuations are at a level where they have greater sensitivity. But HOW MUCH downside is there?
Equities:
Keep reading with a 7-day free trial
Subscribe to Capital Flows to keep reading this post and get 7 days of free access to the full post archives.