


Thesis:
US equities have shown historic performance in 2024 with the index up 23% (total return at 25%). This exceptional performance was driven by a combination of macro factors that are now clearly shifting. This report will provide a comprehensive analysis of the macro regime, HOW equities connect to the current regime, and WHY we are likely at a short-term inflection point. The implication of the research is that there is an asymmetrical risk-reward betting on the left tail in equities (downside). HOWEVER, the only way this thesis could be monetized correctly is by understanding the macro drivers intricately AND the proper signals for execution.

In markets, the RULE is dynamically orienting oneself toward the highest risk-reward bets and noting being deterministic in thinking about a single outcome. This means redundancy planning ALL bets. While most macro bears are trying to shill attention-grabbing headlines, our job in markets is to think clearly for the purpose of making exceptional returns.
“Clear thinker” is a better compliment than smart
-Naval
Initial Tools:
Before we dig into the macro regime and specific tools to extract returns from it, I want to start by covering HOW to think about equities from a first principles perspective.
When we take a view of the S&P500, we are implicitly taking views of the specific underlying drivers (earnings and valuation). If you can correctly interpret the underlying drivers and connect them to the macro regime, then you can properly interpret the risk-reward.

On top of these drivers, there are positioning premiums and discounts that occur. These are functionally the price that positioning is paying for exposure to the upside or downside.

While there aren’t any hard and fast rules on the interaction of positioning within the macro regime, typically the the macro regime creates specific constraints in which positioning premiums/discounts oscillate. In other words, specific types of variance are explained by positioning, and the macro regime explains other types (typically higher timeframe and persistence in standard deviation). I wrote extensive primers on HOW to connect these moving parts in the Macro Alpha Primers. The goal is to properly align ALL of them for a thesis.
Macro Alpha Primers:
Macro Alpha Primer: Credit Risk and Duration Risk and Macro Podcast: Macro Alpha Primer
Macro Alpha Primer: Correlations and Macro Podcast: Macro Alpha Primer
Macro Alpha Primer: Macro Catalysts, Hedging Pressure, and Positioning and Macro Podcast: Macro Alpha Primer
Macro Alpha Primer: Positioning Premiums and Macro Podcast: Macro Alpha Primer
All the educational primers on macro and markets can be found here: Link
When you understand HOW these moving parts connect, then you can understand WHY rules in the game change:
"Financial markets are generally unstable. The concept of equilibrium has no relevance. The key to understanding financial markets is to realize that they don’t tend toward equilibrium; they are always in a state of flux, with the rules of the game constantly changing."
-George Soros
This is WHY we have the Macro Tear Sheets. They contextualize WHERE we are in positioning premiums and discounts as well as show the macro correlations taking place.
The Macro Rate Matrix Dashboard further connects with the Macro Tear Sheets to show the yield curve regime and connection of economic data to interest rates (an updated version of this will be released this week with more data).
From here, we cover the macro picture from a 30,000-foot view, then zoom into the specific drivers taking place, and finally go over the specific tools/signals to use for navigating the next 90 days in equities.
30,000-ft Macro:
The 30,000-ft view can be summarized as follows: ALL of the drivers that generated above-average performance in equities during 2024 have flipped and the entire market is being misdirected by the narrative surrounding the new political administration.
2024 had the following factors pushing equities up:
Accelerating growth supported by rate cuts
Falling inflation creating a Goldilocks regime
Expanding valuations as macro liquidity increased considerably
Positioning expecting a recession at the beginning of the year and being net short (forcing them to unwind and push equities higher)
Each of these factors has begun to shift to the opposite, especially relative to expectations. The market is sitting at elevated valuations and instead of focusing on macro liquidity, the entire market is being misdirected by the themes surrounding the new administration.
Mentions of “Trump” across news sources:

Deregulation is being used as an excuse to make a linear extrapolation for S&P500 returns:

Tariffs and trade wars are being focused on even though the majority of US onshoring has already taken place.

Constructing spending for US manufacturing went through an explosive period of time DURING the hiking cycle due to the onshoring. This is one of the primary reasons that cyclical sectors have shown such a considerable degree of resilience to the higher level of interest rates.
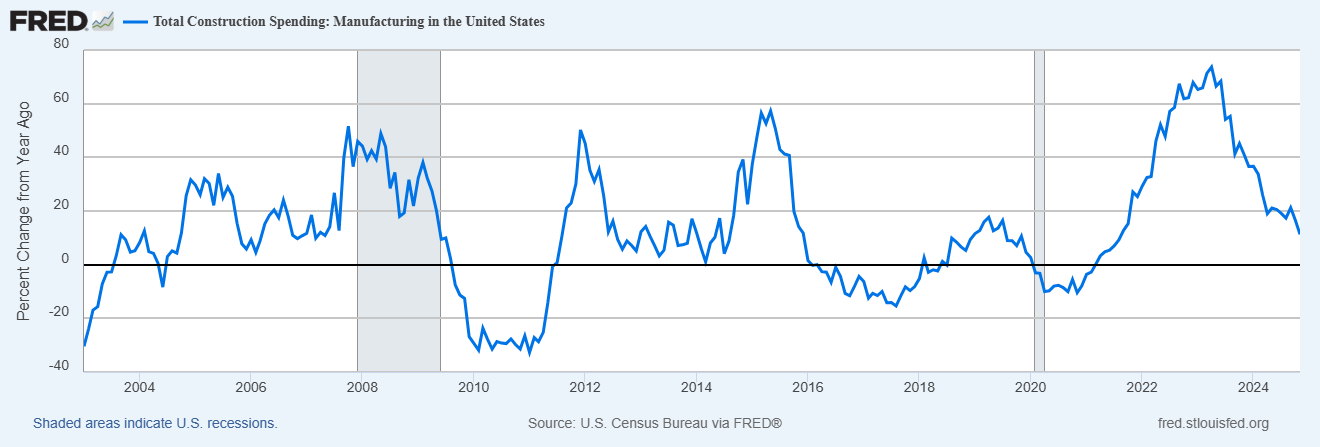
This impulse in growth is now fading AT THE SAME TIME the 10 year interest rate has moved higher and the curve has bear steepened (charts from the Fixed Income Macro Tear Sheets linked above):


While there are changes taking place beneath the surface, passive ownership of the market continues to create greater inelasticity in the market as well as a concentration in the Mag7 names (this will be important later for the specific signals to watch).

This is partially WHY we have seen such violent moves to the upside AND downside. (chart is from Michael W. Green)

The increase in passive ownership has made the tails on the distribution much fatter which means crazy moves to the upside or downside are more likely. The implication of this is that it is very possible that it takes smaller and smaller impulses in macro to cause a melt-up or meltdown. This is one of the reasons we see equities go to much higher valuations in 2021 and this year. The macro regime creates an environment for upside and then the passive dynamics of the market amplify it.
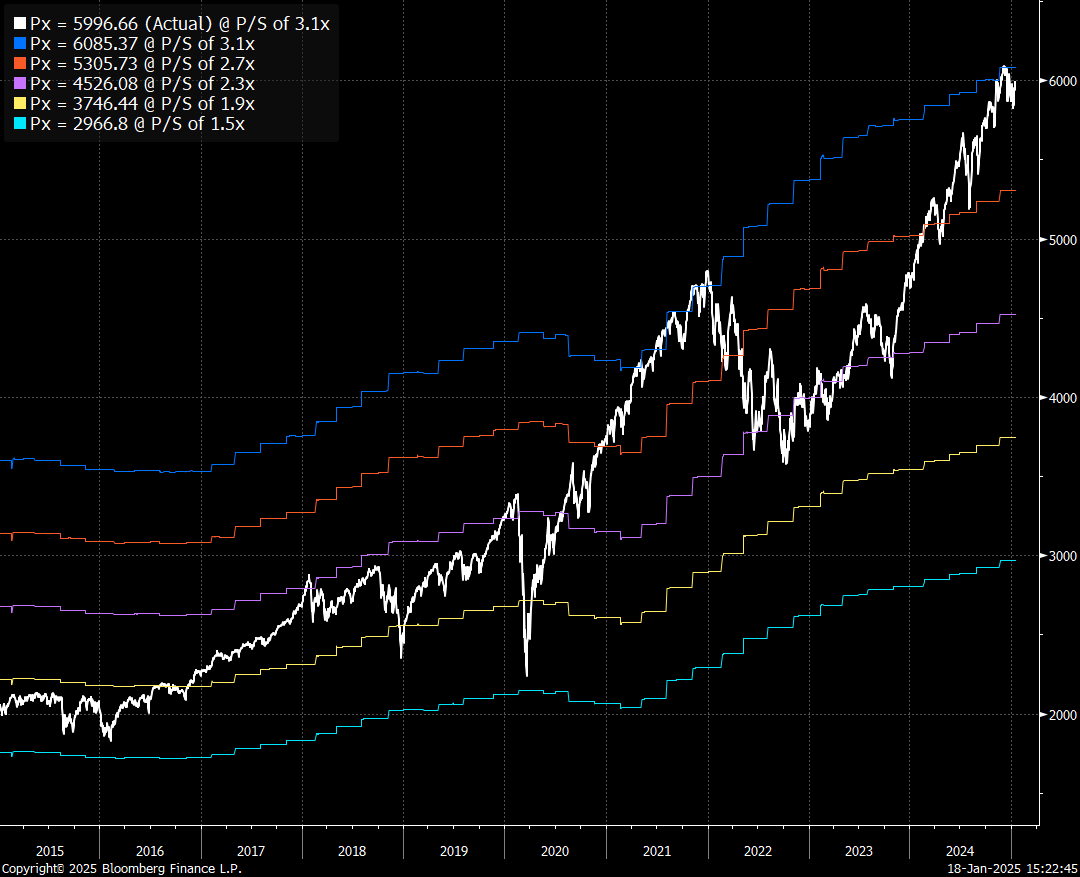
These heightened valuations and macro liquidity are actors behind the scenes that cause investors like Howard Marks to go on “Bubble Watch” (link).


In my view using “irrational exuberance” and “sentiment” as tools to identify “bubbles” is going to have incredibly poor predictability. There is no standard definition for “sentiment” or “bubbles” that we can employ in a testable framework for action. However, liquidity and its impact on valuations is something we can employ into a testable hypothesis and connect to the price action of markets!
The most interesting dynamic we are seeing right now is how macro liquidity is converging with the misdirection of the Trump narrative. Trump has launched a crypto coin that moved to a $6 billion market cap in under 24 hours.

High valuations are NEVER a reason to become cautious or bearish on equities. It is when we see high valuations AND a shift in the underlying liquidity conditions that creates the potential for an inflection point or short-term drawdown. This is WHY understanding the macro drivers intricately AND the proper signals for execution are critical for making any bets on the left tail in equities.
The remainder of this report will operate in the context laid out above and connect the drivers to specific signals in the equity complex to explain the asymmetry and signals for action.
(The remainder of this report is reserved for paid subscribers but free trials are available here: Link. There will be some very important research pieces and models released this week for paid subscribers).
Zooming In To The Macro Regime:
Keep reading with a 7-day free trial
Subscribe to Capital Flows to keep reading this post and get 7 days of free access to the full post archives.