Macro Alpha Primer: Positioning Premiums
How you pay a premium or discount for exposure to expected vs realized returns
Today I am going to explain how the option market connects with the macro flows laid out in the previous Macro Alpha Primers. Even if you don’t trade options, they are one of the most important signals you can watch when trading macro. Many people will have alternative data positioning signals like fear and greed indexes. At the end of the day, if dollars are not an input into the signal, it’s unlikely to provide much value. For example, the premiums and discounts we see in the options market are a reflection of actual supply and demand traders are paying for exposure to assets. The surveys people send out to get a pulse on “sentiment” are not used by major money managers for decisions. Bottom line: SHOW ME THE MONEY!
Please reference the Macro Alpha Primers and respective podcasts that I have done thus far here:
Macro Alpha Primer: Credit Risk and Duration Risk and Macro Podcast: Macro Alpha Primer
Macro Alpha Primer: Correlations and Macro Podcast: Macro Alpha Primer
Macro Alpha Primer: Macro Catalysts, Hedging Pressure, and Positioning and Macro Podcast: Macro Alpha Primer
The structure of this primer will be as follows:
The primary signals in the options market to watch
How do these signals connect with the price?
How these signals connect with positioning and macro
How the correlation of assets and the correlation of their premiums/discounts in the options market are connected
Primarily signals in the options market to watch:
The first thing you need to know when approaching the spot market and option market is that both are pricing future probabilities. The spot market is pricing a distribution of outcomes via a single price. The option market is pricing the same set of future probabilities but with a higher degree of nuance so that you can isolate the causality of your probabilities across the Greeks.
Main Greeks to know:
Delta (Δ):
Definition: Measures the sensitivity of an option's price to changes in the price of the underlying asset.
Interpretation: A Delta of 0.5 means the option price will move by $0.50 for every $1 move in the underlying asset.
Gamma (Γ):
Definition: Measures the rate of change of Delta with respect to changes in the underlying asset's price.
Interpretation: High Gamma indicates that Delta can change rapidly, which can lead to larger changes in the option's price.
Vega (ν or V):
Definition: Measures the sensitivity of an option's price to changes in the volatility of the underlying asset.
Interpretation: A Vega of 0.10 means the option's price will change by $0.10 for every 1% change in the volatility of the underlying asset.
Theta (Θ):
Definition: Measures the sensitivity of an option's price to the passage of time, also known as time decay.
Interpretation: A Theta of -0.05 means the option's price will decrease by $0.05 each day, assuming all other factors remain constant.
Rho (ρ):
Definition: Measures the sensitivity of an option's price to changes in interest rates.
Interpretation: A Rho of 0.02 means the option's price will increase by $0.02 for every 1% increase in the risk-free interest rate.
This is the main book to read if you want to start understanding options: Link
What you need to remember is that each of these Greeks is isolating a specific part of causality pricing future probabilities. The implication of this is that the spot market and option market are inherently linked. The institutional players that trade the most money in both of these markets utilize BOTH actively.
The main signals we watch:
Implied Volatility vs. Realized Volatility
Implied Volatility (IV):
Definition: The market's pricing of the future implied movement in the price of the underlying asset. It's derived from the option's price and reflects the market's expectations of future volatility.
Realized Volatility:
Definition: The actual volatility of the underlying asset over a specific period. It is calculated based on historical price movements and reflects what has already occurred.
Implied Volatility Premium/Discount:
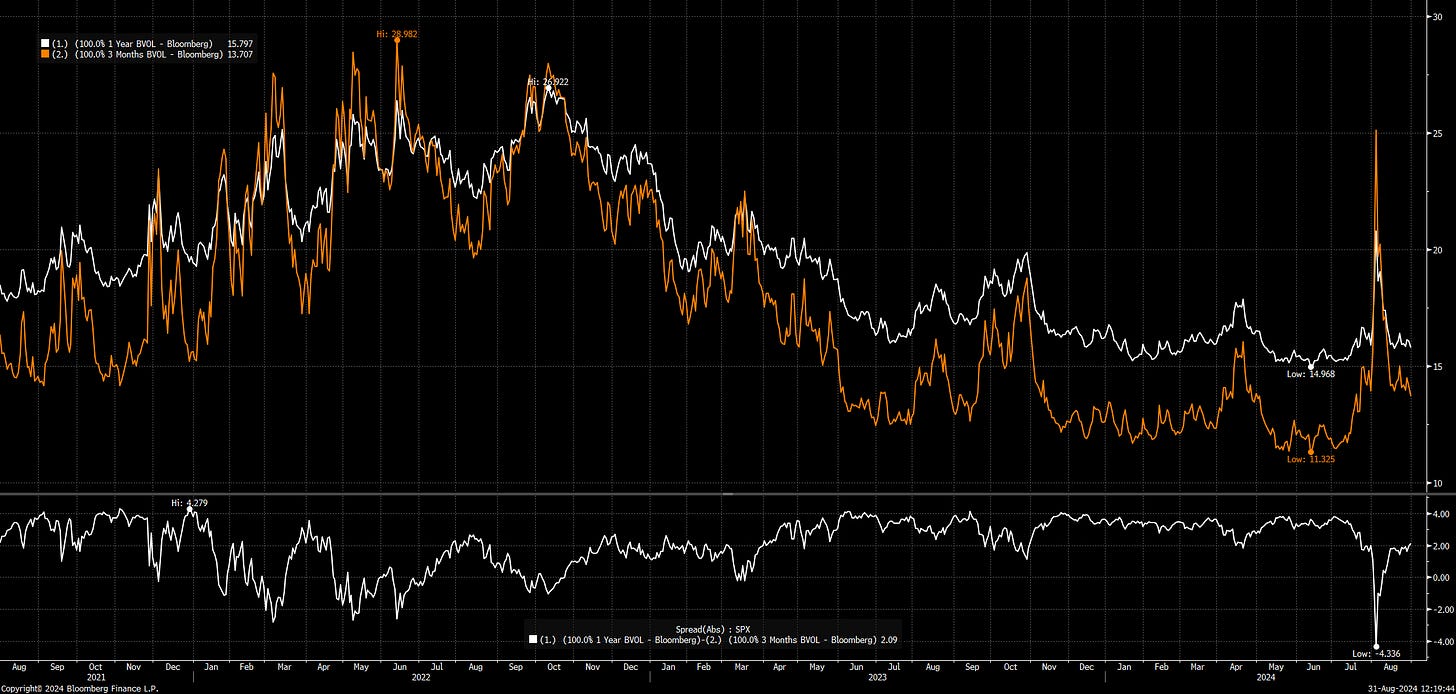
Definition: The difference between the implied volatility of an option and the realized volatility of the underlying asset. A premium occurs when implied volatility is higher than realized volatility, suggesting the market expects future volatility to increase. A discount occurs when implied volatility is lower than realized volatility, indicating the market expects future volatility to decrease.
Example chart for SPX:
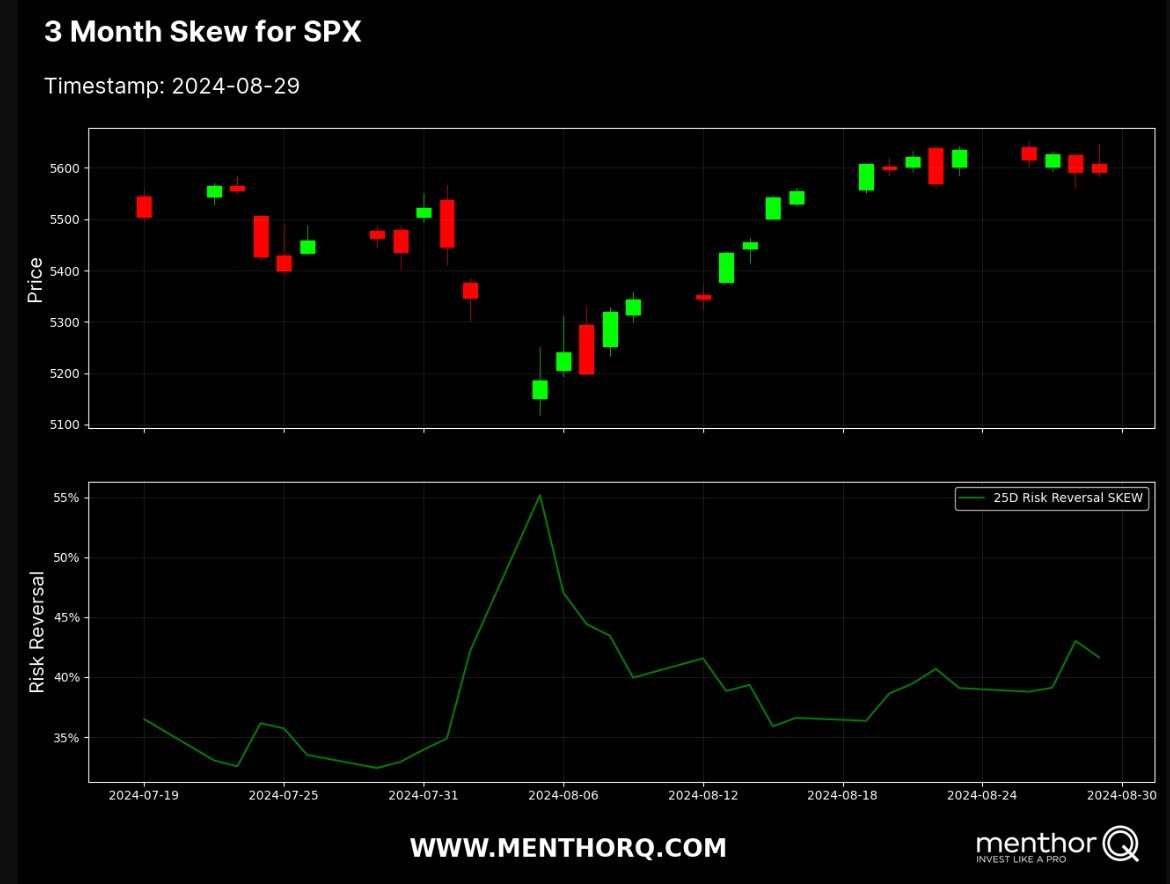
Skew
Skew:
Definition: The asymmetry in the distribution of returns of an asset, often observed in the pricing of options. Skew reflects the difference in implied volatility between out-of-the-money puts and calls, indicating market expectations for the tails.
Example chart from SPX:
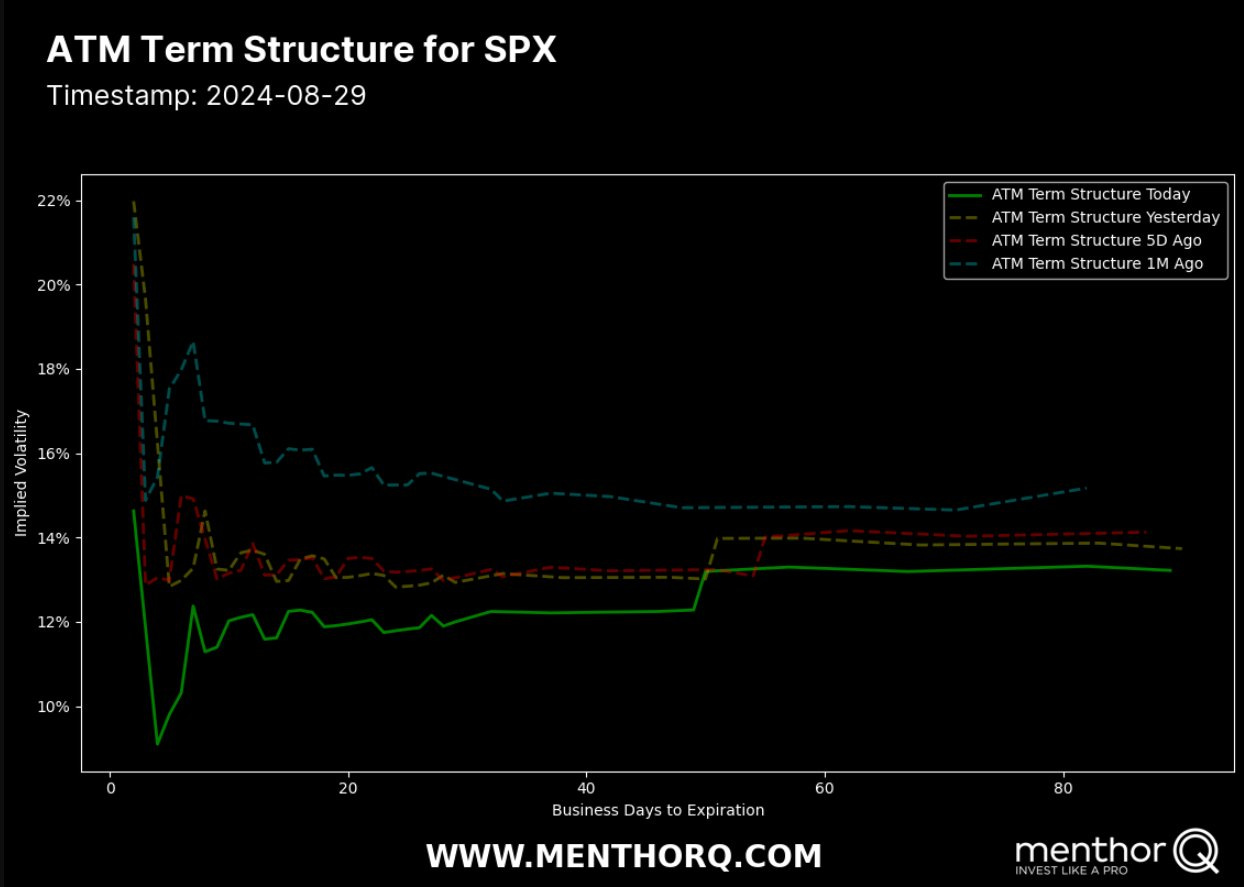
Term Structure
Term Structure:
Definition: The relationship between the implied volatility of options with different expiration dates. It helps traders understand how volatility is priced through time.
Notional Outstanding, Open Interest, and Total Volume
Notional Outstanding:
Definition: The total value of all contracts (e.g., options, futures) in the market, calculated by multiplying the contract size by the number of contracts outstanding. It provides a sense of the market's exposure to a particular asset.
Open Interest:
Definition: The total number of outstanding derivative contracts (e.g., options or futures) that have not been settled. It gives an idea of the level of activity and liquidity in a particular market or strike.
Total Volume:
Definition: The total number of contracts traded during a specific period. It indicates the level of trading activity and market interest in a particular option or futures contract.
Catalyst Dates
Option Expiration Dates:
Definition: Specific dates when options contracts expire, and the holders must decide whether to exercise the option, let it expire worthless, or roll. These dates often lead to increased market activity and volatility. See CBOE Calendar here: Link
Hedging into Macro Catalysts:
Definition: The practice of adjusting positions or using derivatives (like options) to protect against potential market movements ahead of significant macroeconomic events, such as interest rate decisions or inflation reports.
How these signals connect with the price:
Ok, we know 3 things now:
The options market is inherently linked with the spot market
We know the primary signals to watch from the section above
We know how credit risk, duration risk, correlations, and macro catalysts function from the previous articles.
We are now going to take these ideas and STACK them on top of each other in their signals to get a full view of the market. Thankfully, we have a perfect example in the mini-liquidation of equities that took place at the beginning of August. Let’s go through the list of things:
The options market is inherently linked with the spot market. In other words, the selling in SPX pulled SPOT SPX away from analysts’ price expectations. When this happened, implied vol premiums increased, skew blew out and term structure shifted considerably (this is reflected in all the charts shared above).
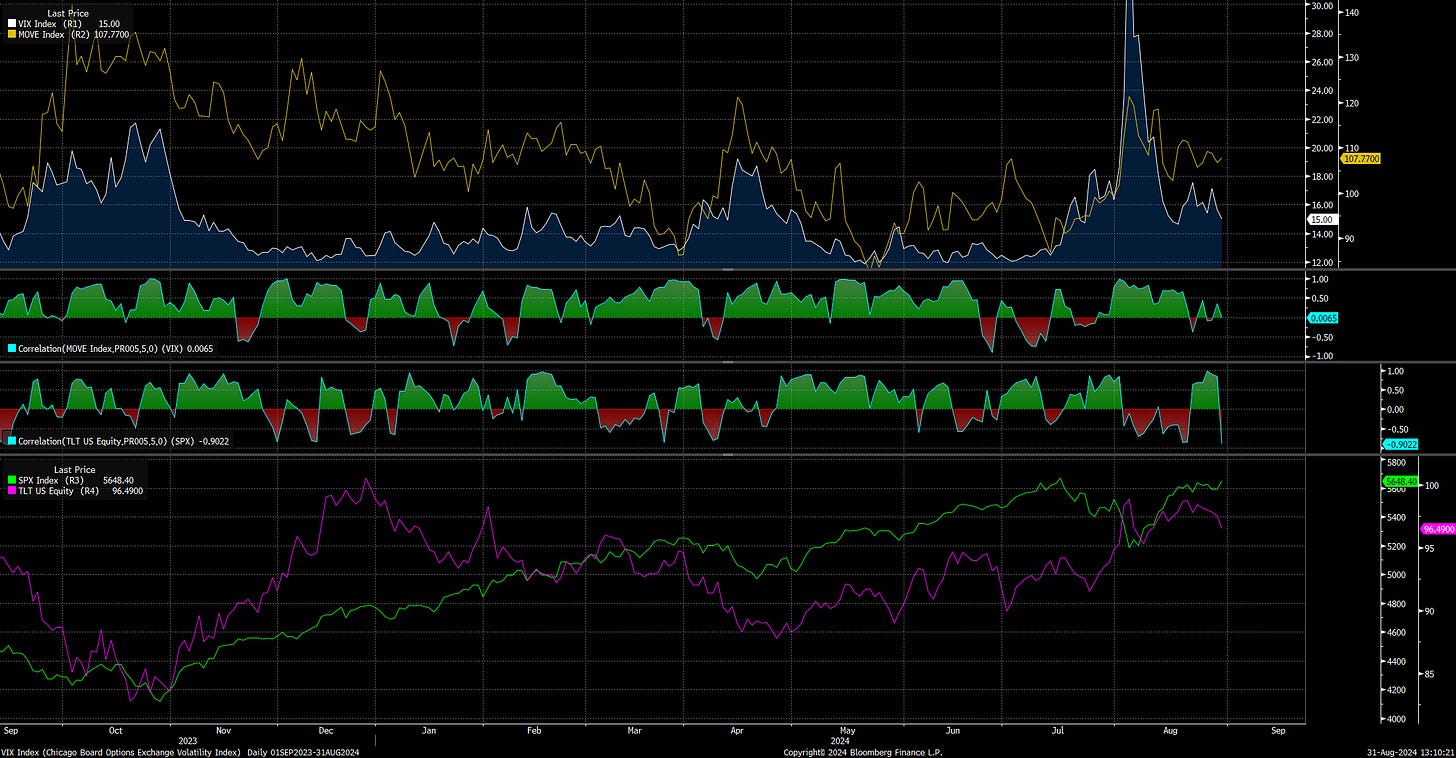
How do we know WHY people are paying a premium for hedging? At the lows, a huge premium existed for implied vol vs realized volatility. The way you figure out this WHY is by looking at the correlation of assets WHEN the premiums begin shifting. Notice how implied volatility premiums (shown in the bottom panel with the green and red shaded data) have DIFFERENT drivers in both of the situations I noted. The stock-bond correlation is the opposite in these instances but equities sold off each time.
This is why if you have an individualized view of each of these assets in terms of its credit risk and duration risk, the correlations make way more sense. On top of this, when positioning is pricing premiums or discounts, you know if these are realistic or unrealistic. This sets the context for you to know if you should take the other side of the trade.
Fundamentally, you ALWAYS need to know the WHY behind things, or else you will never know if you should take the other side of a specific move.
How these signals connect with positioning and macro:
Let’s pull these building blocks together to set the stage for real-time action. If I accurately grasp the current macro regime and the market's pricing of future probabilities, I can then establish a framework for determining the right moments to take the opposite position against the market when its pricing is unrealistic.
If you want some simple examples of this, check out the recent reports I have written here:
When we pull these building blocks together, we are consistently mapping growth, inflation, and liquidity in the economy (see all educational primers here: Link). We are modeling how these are reflected in duration risk and credit risk through assets in the market. We are mapping the correlations in order to have a multidimensional picture of flows AND we are watching how information moves across the spectrum from uncertainty to certainty as it’s priced into markets (all of this was laid out in the previous Macro Alpha Primers). On top of this foundation, we map how premiums and discounts in positioning via the options market reflect trading opportunities for the macro views we have.
Synthesizing all of this in real time is what generates high-quality trade ideas. If this seems like a lot to synthesize in real-time, you are 100% right. This is why I write the macro reports every month for paid subscribers. It breaks down and synthesizes all of these moving parts so that you have the proper foundation for action.
Since we are at such a critical juncture in equities sitting right below all-time highs, I will be writing an equity report for paid subscribers explaining the current moving parts and the probable skew in the S&P500 moving into September. This will be published tomorrow and available to all paid subscribers. You can also try a free trial during this time to have it sent to your inbox tomorrow.
I want to cover one final thing before we end this primer and its the additional correlations we have in the options market.
How the correlation of assets and the correlation of their premiums/discounts in the options market are connected
We have already covered correlations between the outright price of assets like stocks and bonds. What we also want to do is map the correlations of implied volatility, implied vol discounts/premiums, skew, and term structure.
For example, here is a chart of the VIX and MOVE Index (top panel) with their correlation just under it. SPX and TLT spot (bottom panel) with their correlation as well. The main idea here is that many times shifts in implied vol correlations or outright spreads (functionally the value of vol subtracted from one another as opposed to a correlation based on % change) set the conditions for changes in correlation in the spot market. When you overlap these with technical signals, you are significantly increasing your edge in markets.
We can run these same metrics for ALL global macro assets. Beginning to watch these relationships as volume, opex and open interest at expirations change is what allows refinement of a view to ultimately increase the risk-reward of trades in entries and exists.
If you are trying to dig into this more, I would recommend the following resources:
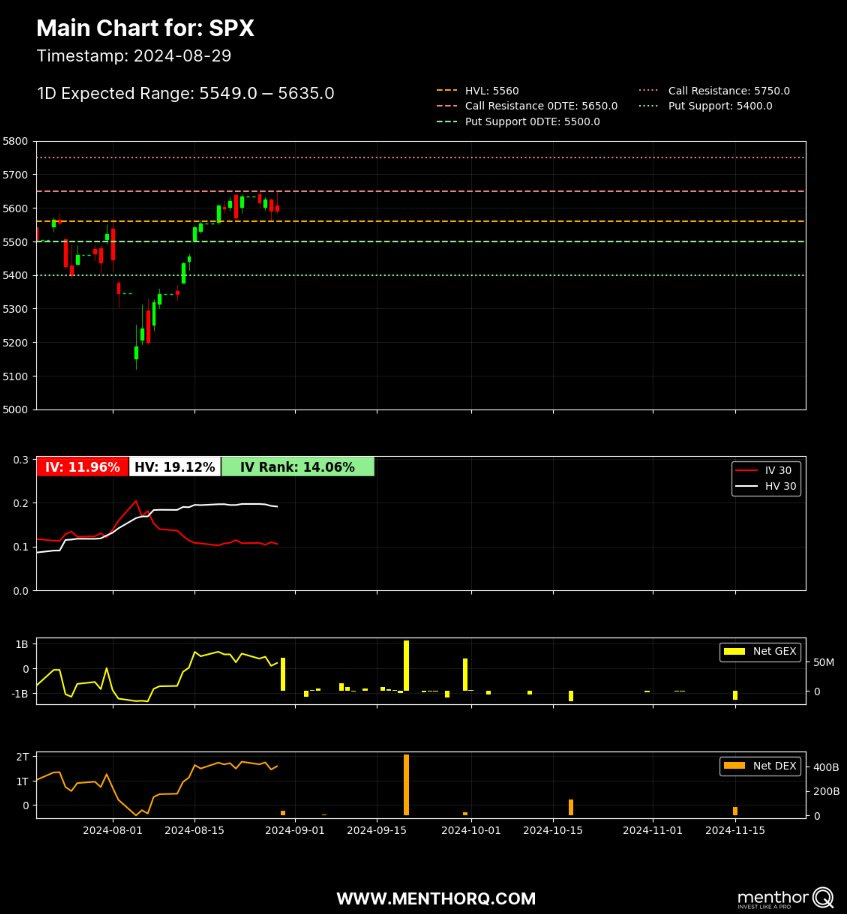
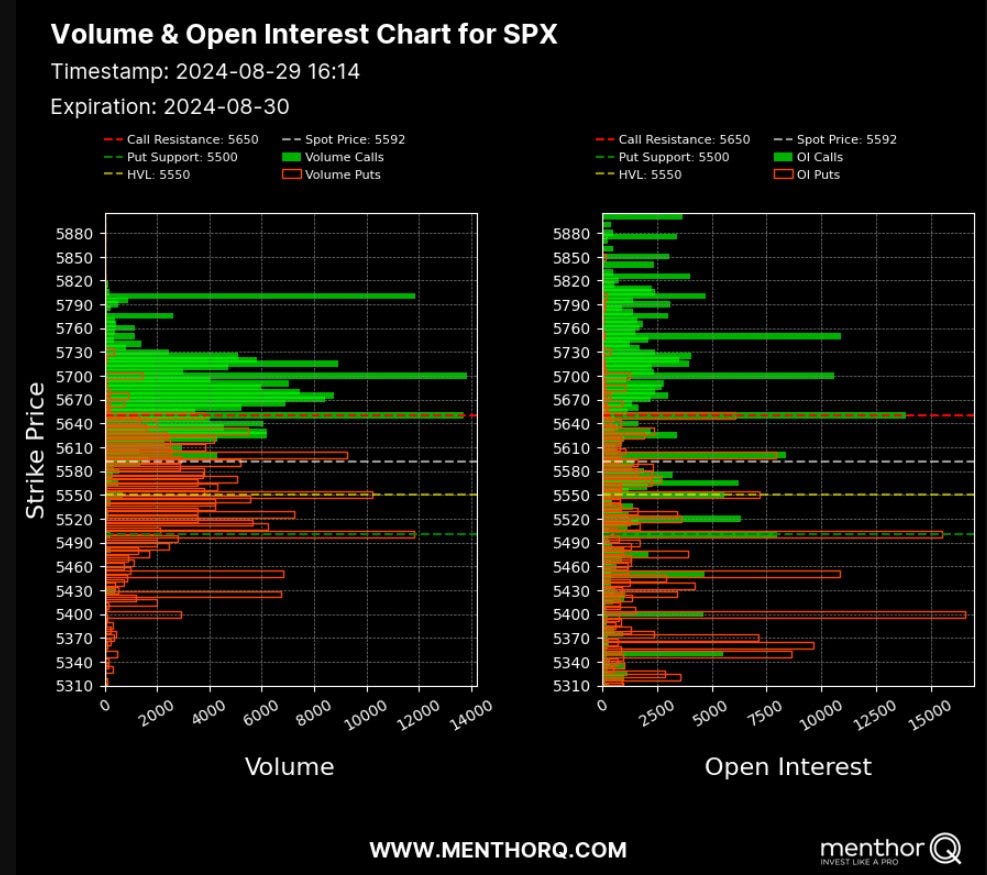
Menthor Q has a great display of the options market and you can follow their work here: Link. Check out some of their charts below:
VolSignals is a great account to follow for SPX option flow: Link
Pulling Things Together:
We have covered a lot of moving parts in the Macro Alpha Primers so far. The best is yet to come though! I will publish the final primer next week and all I can say is you don’t want to miss it.
Keep an eye out for the equity report that I will publish tomorrow for paid subscribers as well. We will continue moving forward with intensity and volume to generate alpha in markets.
As always, nothing is financial advice!
The information on this website/Substack is for information purposes only. It is believed to be reliable, but Capital Flows does not warrant its completeness or accuracy. The information on the website/Substack is not intended as an offer or solicitation for the purchase of stock or any financial instrument. The information and materials contained in these pages and the terms, conditions and descriptions that appear, are subject to change without notice. Unauthorized use of Capital Flows websites and systems including but not limited to data scraping, unauthorized entry into Capital Flows systems, misuse of passwords, or misuse of any information posted on a site is strictly prohibited. Your eligibility for particular services is subject to final determination by Capital Flows and/or its affiliates. Investment services are not bank deposits or insured by the FDIC or other entity and are subject to investment risks, including possible loss of principal amount invested. Your use of any information which is proprietary to Capital Flows or a third-party information provider shall only be used on individual devices without any right to redistribute, upload, export, copy, or otherwise transfer the information to any centralized interdepartmental or shared device, directory, database or other repository nor to otherwise make it available to any other entity/person/third party, without the prior written consent of Capital Flows.






position dn
Thank you Flows