

Alpha Report: Flattening In The Curve
Curve regimes and its implications for capital flows

Intro:
This report will lay out the TYPES of yield curve moves we have seen over the past 6 trading days and WHY understanding it is an important signal for interest rates and all risk assets this week.
Big Picture:
Fundamentally, there are four main TYPES of moves in the yield curve.
Bull Flattening: The yield curve flattens as long-term rates decrease more than short-term rates.
Bear Flattening: The yield curve flattens as short-term rates increase more than long-term rates.
Bull Steepening: The yield curve steepens as short-term rates decrease more than long-term rates.
Bear Steepening: The yield curve steepens as long-term rates increase more than short-term rates.
All of the technical resources for interest rates are laid out in the Interest Rate Primer here:

It is critical to understand the TYPE move and where it’s taking place on the curve. The reason for this is that it provides a holistic view of the entire interest rate complex and the risk-reward that exists.
For example, you will notice that many different TYPES of moves have taken place in the 2s10s yield curve over the past 25 years.

If you have a clear understanding of the outright moves in interest rates AND the TYPES of curve moves, this allows you to have much higher predictability for ALL assets.
Historically, the largest rallies in bonds are during BULL STEEPENING. This is a regime where the Fed is cutting aggressively due to growth AND inflation falling. You will notice in the chart above that every major recession saw a bull steepening during this period.
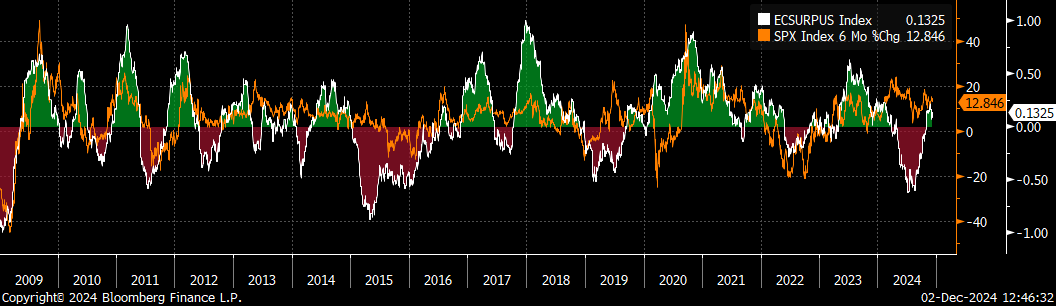
We are not in a recession but the economic surprise index is in the process of making a short-term top:
And real rates (white) remain elevated as inflation swaps (blue) are rolling over:

All of this sets up the TYPE of curve moves we are likely to see in the month of December. These dynamics along with the macro context have already been laid out in the following reports: Alpha Report on macro liquidity
Alpha Report: Macro Liquidity and It's Impact On EVERYTHING

If you are here, it is because you recognize the importance of how macro drives every aspect of financial markets and our lives. When you realize how instrumental changes in the macro regime are, you can never unsee them. This sets the stage for you to know HOW you should adapt.
And the podcast explaining the bond long:
Macro Podcast: Interest Rate Are Going DOWN

Today we are going to cover WHY we are at an important inflection point in the macro cycle. All of the trades my strategies have opened are shared here:
If we understand the TYPE of curve moves that are likely to take place, we can correctly interpret WHY assets are moving. This is what we are going to dig into in the second half of this report.
If you are new, you can do a 7-day free trial by clicking on the link below. There is zero downside and you can review all of the research that has been written as well as receive all of the reports that will be published this week:
The Curve and SOFR:
Keep reading with a 7-day free trial
Subscribe to Capital Flows to keep reading this post and get 7 days of free access to the full post archives.