Macro Alpha Primer: Macro Catalysts, Hedging Pressure, and Positioning
Connecting economic data to hedging pressure and positioning
We will continue moving forward with the Macro Alpha Primers. I have already covered economic data, implied expectations of the future via various forward curves, and positioning in the educational synthesis article. Please reference all of the articles here because I will be pulling on the information and presuppositions to construct second and third-order conclusions for interpreting markets:
Please reference the Macro Alpha Primers and respective podcasts that I have done thus far here:
Macro Alpha Primer: Credit Risk and Duration Risk and Macro Podcast: Macro Alpha Primer
Macro Alpha Primer: Correlations and Macro Podcast: Macro Alpha Primer
Today we will cover the following:
How economic data connects to markets without being “lagging” or irrelevant as many misconstrue for their own bias.
Future expectations and readjustments
Information spectrum for relevant information, news, and data.
Hedging pressure and informational edge
Positioning
CPI data prints as a case study
Economic data:
You will often hear that economic data is useless because it’s “lagging” or doesn’t provide a “real-time view” of what is occurring. This presupposition is both wrong and completely misses how every trading professional in the industry utilizes economic data. On top of this, wouldn’t a great starting point on economic data be asking how the market views it?
On a fundamental basis, any source of information becomes “lagging” after it is released. This could be a speech by a Fed Chair or inflation data. How does economic data function then?
When we model economic data, the purpose is simple: to have some type of edge in predicting future data points. The reasoning behind this is that there is ALWAYS path dependency in economic data and financial markets. What does this mean? It means the future (which is unknown) is a derivative of the present (which is known).
Any regular economic data model is conducting the following: Projecting out what future data prints will be and then as future data is released, it updates its projections. For example, an incredibly simplistic illustration of this is running linear extrapolation models on inflation data. If YoY Core CPI is decelerating by 5-10bps increments, when will we reach x by y date? Typically we are mapping the level, rate of change, and base effects of economic data to accomplish this. Even if we have a marginal degree of predictability then we can stack that edge with other edges in order to inform a market view.
So is economic data “lagging” when it is released? The people who discount the relevance of economic data because of its “lagging” are misunderstanding (or many times intentionally ignoring) that the market isn’t pricing the past. The market is pricing some type of unknown future based on what is currently known. Economic data shows WHERE you are currently which sets the context for WHERE you are going (which contains uncertainty).
What you will find is that you can easily manipulate the datapoints you choose and also how you interpret the temporal elements to confirm your own bias. This is one of the reasons why so many people fail in macro. It is incredibly easy to see whatever you want in the data.
Future expectations and readjustments
After we have a projection of some type of economic data, we connect this to the implied future priced in markets. As we move through data prints, both the economic model we run and the forward curve adjust. The economic model adjusts for all relevant known information and the implied future expectations use all that information to price what is UNKNOWN in the future.
For example, inflation swaps are settled at future CPI inflation prints.
Fed Fund futures are settled at realized Fed Funds:
Even implied vol is pricing a specific implied future of realized volatility:
So the question comes up, if markets are always forward-looking, why do they move on economic data prints that are of the past? This is what brings us to the next section.
Information Spectrum:
We now have this spectrum of information that we need to hold in tension. Economic data provides us with the basis to make projections about the future. The market uses this information to price an implied future (which could be realized or not). As we move forward through time and information moves across the spectrum from uncertainty to certainty, the market dynamically adjusts its implied future expectations eventually to what is realized.
In the same way you can see partial outlines of things on the horizon and as you get closer it becomes clearer, the market is always adjusting its expectations of the future as new information comes to light.
The question becomes, what information is relevant and important to model/watch for taking views on assets?
The expected vs realized settlement of the asset/contract: Let’s use the example of Fed Fund futures. These contracts are settling at a very specific interest rate and date in the future. Any relevant information that gives you an edge into having a high-probability view of the realized future is important. You fundamentally need to determine what the specific asset is laying claim to because this will set the context for how it’s pricing an implied future about that claim.
You can begin to see why the information you have and your interpretation of information is your most valuable asset in markets.
In the information age, you simply need to be at the right place, at the right time, with the right information to succeed
This brings us to the discussion of an informational edge and how we hedge our ignorance.
Hedging pressure and informational edge:
No single individual can have a monopoly on all informational edges in markets. By necessity, you need to have some degree of specialization in order to extract returns. As a result of this, managers will hedge their exposure in order to isolate the specialty around their informational edge. For example, if there is a manager who is exceptional at analyzing individual stock fundamentals but is self-admittedly poor at understanding macro, they can hedge their macro risk.
Managers can also hedge their risk to macro catalysts simply because they don’t believe they have an informational edge for a specific period of time. There are always a plethora of reasons managers hedge their risk. Typically, there is a concentration of hedging around major macro catalysts. What are these major macro catalysts? Fundamentally, a macro catalyst has weighted significance if the release of its information significantly impacts the implied future of an asset. Hedging will typically come around specific data points (such as CPI or NFP) or events (like FOMC or Jackson Hole). However, we are always moving through various macro regimes with varying degrees of strength. This means that things like inflation prints can have higher significance in some periods of time which will result in more hedging pressure surrounding these prints.
This hedging pressure, its connection with economic data, and the markets implied future set the stage for positioning to be put up and taken down by managers as they are wrong or right.
Positioning:
Positioning is one of the most important things you can understand in markets. Why? The way managers are positioned for the future determines how asset prices respond to information as it moves across the spectrum from uncertainty to certainty. If everyone is expecting a specific future reality and it materializes then the market did its “job” in pricing the future.
Let’s use a theoretical example here: If the market in both stocks and bonds prices a recession perfectly in its degree of contraction and duration then theoretically, the market would not move at all when the actual negative real GDP prints come out. Inversely, if the market prices a recession and it doesn’t happen, then the market needs to reprice to show the realized future isn’t what was expected (aka stocks higher like in 2023).
In reality, all of these things take place dynamically and the market is pricing a multiplicity of future outcomes with varying probabilities for each. This shows the principles for how positioning functions though.
How do we map positioning? By aggregating all information sources about the market's pricing of an implied future. All of these have been laid out in these articles: Link
CPI Case Study:
We have covered all of the major principles behind macro catalysts, hedging pressure, and positioning. Let’s move to how these function in a real-world case study with CPI prints since January 2022.
Let’s contextualize the macro regime: The inflationary impulse in the economy began in 2021 creating a large spread between inflation and Fed Funds. Asset priced this differential by rallying as they were driven by the cash flow component and valuation expansion. As we entered 2022, the Fed began its rate hiking cycle and shifting its stance to being “data dependent.” As inflation expectations began to be unanchored, inflation prints began to be THE PRIMARY FACTOR in the Fed’s decisions. Since the hiking by the Fed was causing equities to fall, inflation prints became paramount in determining the direction of equities.
The logic:
Fed hiking is pushing equities down > Fed hiking is being driven by inflation > Once Inflation tops, the Fed will stop hiking which will cause a bottom to occur in equities.
Managers had this logic in their heads as they hedged through macro catalysts.
Here is a chart of core and headline CPI:
Here are the release dates for CPI in 2022:
2023
And 2024:
We won’t go through every print but we will go through the main ones to illustrate the significance of the principles I have laid out.
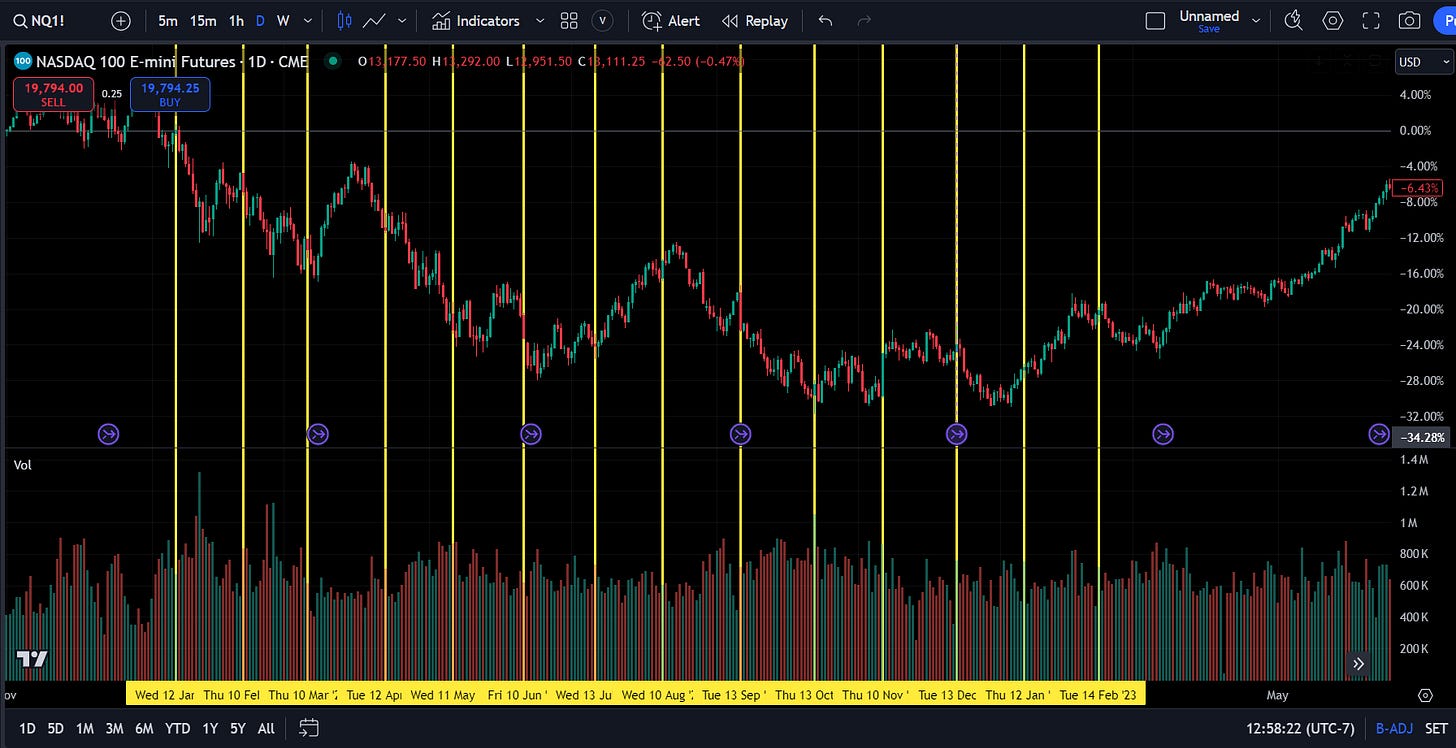
Here are all the CPI prints in 2022 and the beginning of 2023. What you will notice is that multiple bottoms and tops were set during these catalysts. The reason a print might not function as a short-term inflection point is likely due to expectations in rates and also the degree of implied vol premium/discount in equities:
You will notice that inflation prints were the catalysts that set the bottom in equities:
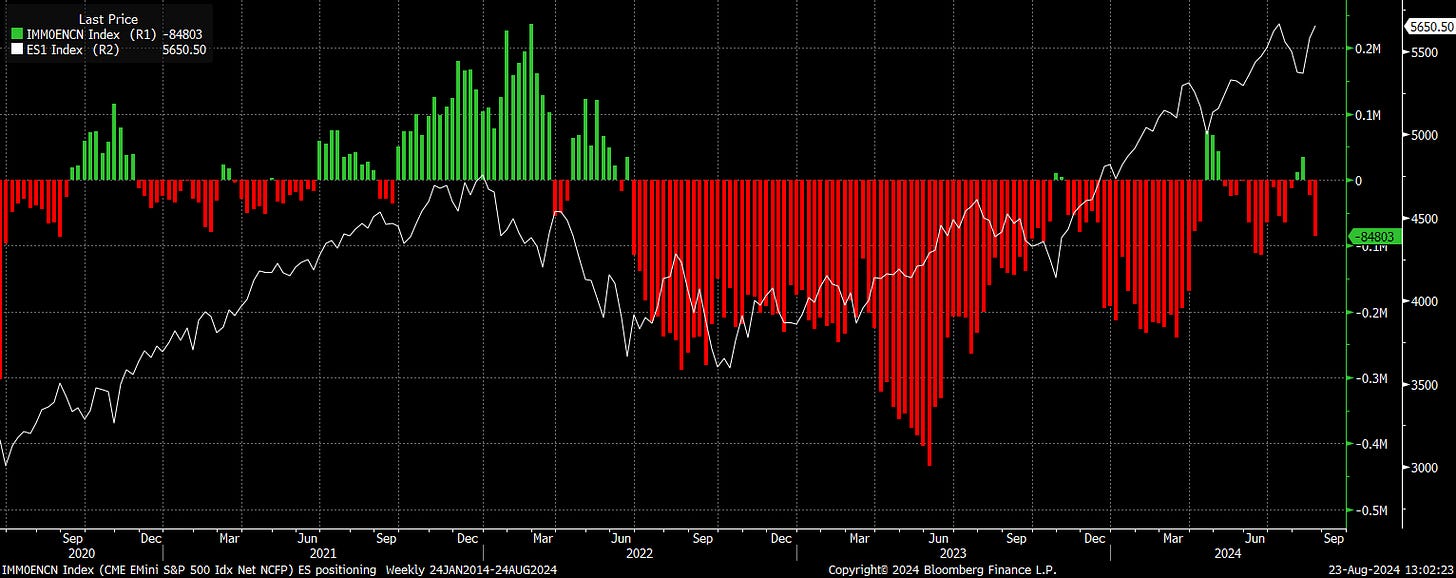
Part of the dynamic behind this was that everyone was positioned net short. If you go through the inflation prints in 2023, we functionally bid aggressively through almost all of them because positioning was net short. (Chart is net COT Positioning)
If people are positioned bearish and their view is wrong then they need to buy back ES contracts thereby pushing the price up. Since the primary driver was inflation during the 2022 bear market, the inflation prints in 2023 functioned as macro unwinding events.
Pulling Things Together:
There are clearly a lot of moving parts here and the market rewards the individual who can correctly put them together at the right time with the right execution.
In the information age, you simply need to be at the right place, at the right time, with the right information to succeed
The key thing to remember is that everything in markets is dynamic but there is always an underlying logic for WHY things are taking place. For example, over the past 6 months, hedging pressures through inflation prints have been decreasing considerably. Think about why? Inflation is no longer a major concern or high risk.
What is a concern though? Growth. This is why we are likely to see managers hedge into a lot of labor market data prints in the coming months.
It is consistently connecting all of the levels to a big-picture macro view and incremental execution that produces exceptional returns. We had some large moves today during the speech at Jackson Hole. I will be writing an updated report synthesizing all of these moving parts for Paid Subscribers. Keep an eye out for that report.
As always, a Pepe for the culture!


Best primer of the month for me!
Great work!