

Macro Regime Tracker: Bond Market Volatility
Macro regime and risk assets qualified clearly

The Macro Regime Tracker offers a daily lens on how shifts in growth, inflation, and liquidity affect short-term risk and reward. Leveraging machine learning, AI, and cross-asset data, it identifies macro changes and their impact on market positioning.
Macro Regime Tracker Index:
The CPI print today continued to confirm the macro risk of inflation that has been consistently laid out. This will continue to be a dominant theme for macro flows.
I laid out these flows in the live stream today:
I also covered the 3 playbooks that I published here on building a macro thesis, SPX, and Bitcoin:

In the live stream, I explained how watching the performance of Bitcoin on an outright basis AND relative to the S&P500 is critical for taking directional views. The TradingView Script that I used is available here:
Capital Flows: X-Market Returns Model: https://www.tradingview.com/chart/7SAf84pj/
Explanation of the model:
Systematic models and tear sheets are updated below.
Main Developments In Macro
Federal Reserve Commentary
COLLINS: "Actively patient" policy approach remains appropriate
COLLINS: CPI numbers raise question whether Fed is in the right spot
COLLINS: Likely core inflation will be around 3% by year-end
COLLINS: Expect some downward pressures on employment and growth
COLLINS: Fed can take time to carefully assess incoming data
COLLINS: Economy continues to be in a good place overall
BARKIN: There have been instances of FOMC voting against the Chair
BARKIN: Hope and trust next Chair will seek best policy
BESSENT: Formal process for Powell successor already started
BESSENT: Fed had big forecasting errors — may be one now
BESSENT: Important to look at trend; inflation not accelerating
BESSENT: Wouldn't put too much emphasis on one inflation number
BESSENT: Trump said many times he's not going to fire Powell
FAULKENDER: Overall index getting back to below Fed target
Corporate Insights
JPMORGAN 2Q FICC trading revenue: $5.69B vs. est. $5.22B
CITIGROUP 2Q net interest income: $15.18B vs. est. $14.05B
WELLS FARGO 2Q net interest income: $11.71B vs. est. $11.83B
JPMORGAN: FY net interest income guidance raised to ~$95.5B
Geopolitical & Trade Focus
TRUMP: More investments to be announced in coming weeks
TRUMP: Will fight China in "friendly fashion"; China falling behind
TRUMP: Countries that don't open up will face substantial tariffs
TRUMP: Indonesia deal includes 50 Boeing jets, $15B energy, $4.5B ag
TRUMP: No carveout for energy in tariffs; AI address set for July 23
US ENERGY CHIEF: Copper production to rise; demand to ‘bump’ oil
IRAN faces stiff sanctions if no deal by end of August — Axios
US ASKED ISRAEL to stop strikes on some Syrian forces — Axios
ITALY'S MELONI: Working to avoid tariff war with USA
TRUMP: Making progress with EU, already have the letter
US Political & Fiscal Signals
TRUMP: Fed should cut rates by 300bps. Very low inflation.
TRUMP: Bring down the Fed rate, now
TRUMP: Every Republican should vote 'Yes' on Genius Act
Macro Tear Sheets: Equities, Stock/Bond Correlation, Fixed Income, FX, Crypto, and Commodities
Macro Regime Dashboard: Excel spreadsheet for economic data, interest rates, and real estate.
Momentum and Mean Reversion Models: Equities, Commodities, Fixed Income, and Currencies
You can find the educational primer and video explanation of these models here: LINK
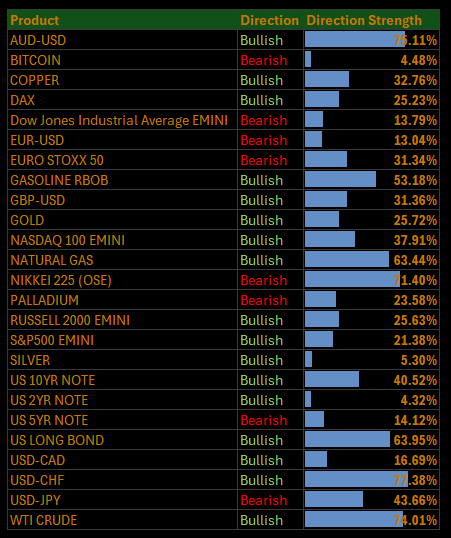
Here is a summary of all models and their directional strengths:
Growth, Inflation, Fixed Income, Credit, and Equities Regime Tracker
The Macro Regime Model offers a real-time view of growth, inflation, and yield curve dynamics, integrating these with credit market shifts, equity risk premiums, and positioning data. It connects upcoming catalysts to statistical drivers of asset prices, creating a unified framework that quantifies skew and clarifies risk-reward across asset classes.
Key Points To Set The Context:
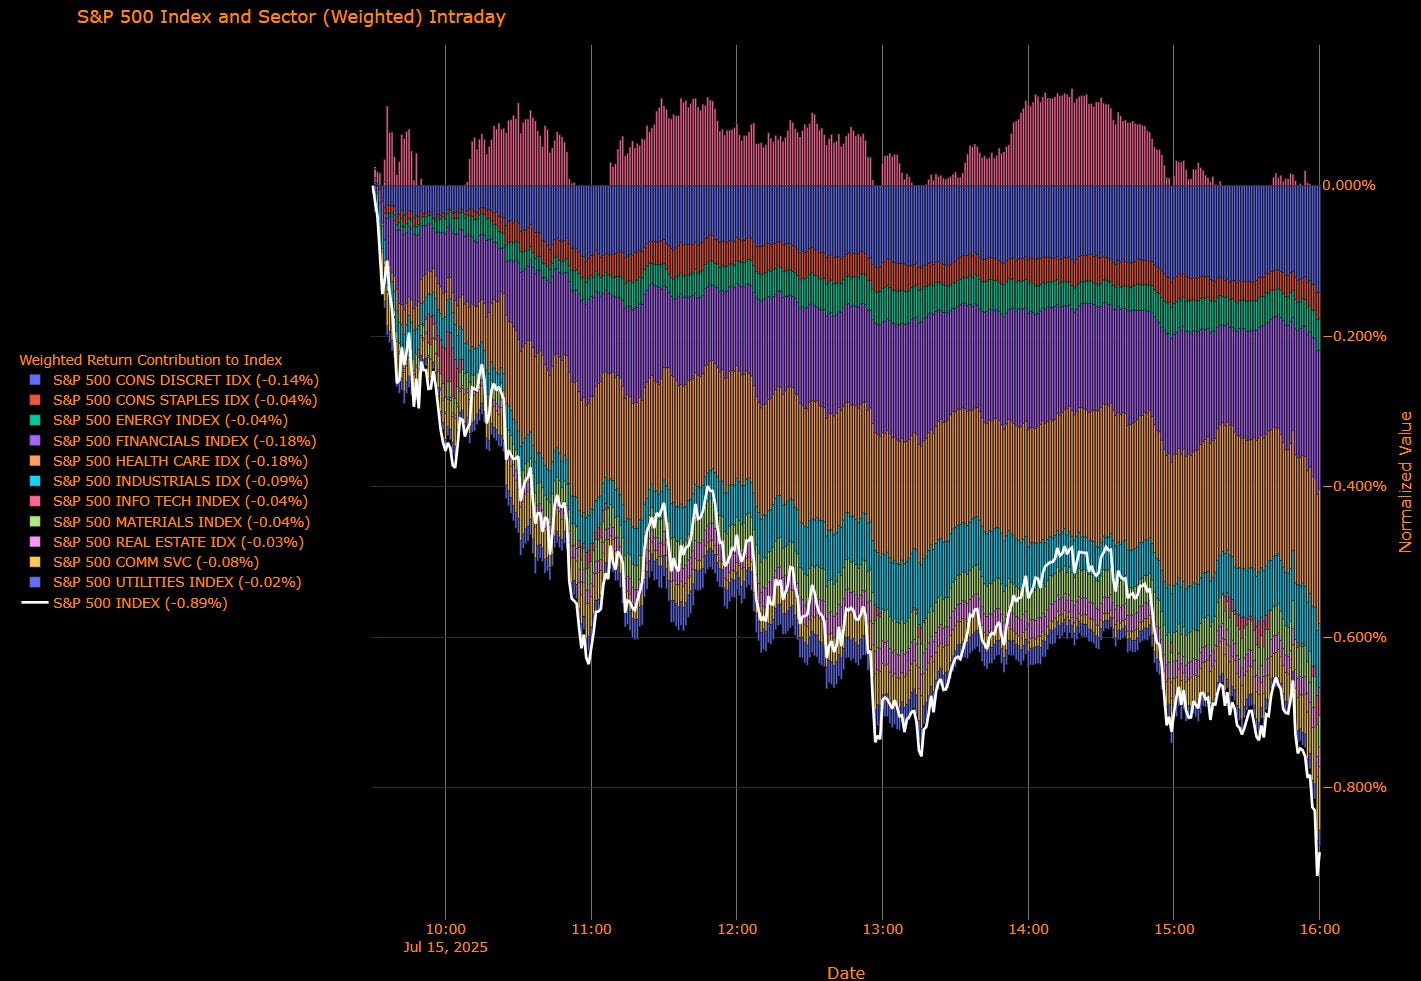
S&P 500 Sinks as Tariff Pass-Through Intensifies, Rotation Breaks Down Across Sectors
The S&P 500 tumbled 0.89% on Tuesday, erasing early gains as the market reacted poorly to a CPI report that, while soft on the surface, revealed mounting tariff-related pressures underneath. The rotation into financials, industrials, and real estate the engine of last week’s gains broke down sharply, with every sector finishing in the red. While tech managed to tread water, leadership narrowed again and bond yields spiked, as bets on near-term Fed easing were pared back.
Sector Contribution Breakdown (Weighted Return to Index)
Financials (–0.18 pp) – The biggest drag on the index as earnings disappointments from Wells Fargo and JPMorgan raised fresh doubts about net interest income trends. Curve steepening failed to support sentiment as forward guidance turned more cautious.
Health Care (–0.18 pp) – Broad weakness led by managed care and biotech, as margin pressures and political scrutiny around drug pricing returned to the forefront.
Consumer Discretionary (–0.14 pp) – Down heavily on concerns that rising prices in tariff-sensitive goods like appliances and apparel will crimp consumer demand into Q3.
Industrials (–0.09 pp) – Airlines, freight, and capital goods reversed course as investors questioned the durability of the recent cyclical rally.
Communication Services (–0.08 pp) – Internet platforms and telecoms came under pressure as momentum faded and valuation concerns re-emerged.
Staples, Energy, Info Tech, Materials (–0.04 pp each) – Uniform drag across key defensives and cyclicals. Energy was particularly weak despite stable crude, reflecting commodity-linked tariff risks and weakening China demand narratives.
Utilities (–0.02 pp), Real Estate (–0.03 pp) – Even rate-sensitive sectors failed to catch a bid as yields rose sharply across the curve.
Sector Performance Breakdown (Unweighted Index Returns)
Materials (–2.26%) – Clear underperformer as tariff-related cost pressure hit home for chemicals, metals, and building products. Margin compression worries dominated the tape.
Health Care (–1.96%) – Dragged lower by biotech and insurers, with fresh political rhetoric around price controls and weakening pricing power.
Energy (–1.38%) – Despite relatively tame moves in crude, the sector sold off in sympathy with industrial metals and general cyclical fatigue.
Financials (–1.34%) – Profit-taking across banks and asset managers after last week’s rally. Earnings reactions were mixed, and forward NII commentary spooked investors.
Real Estate (–1.31%) – Suffered alongside rising long-end yields and rotation unwinds, with office REITs underperforming.
Consumer Discretionary (–1.36%) – Weighed down by retailers and travel names as the tariff narrative increasingly collides with consumer resilience.
Industrials (–0.98%) – Turned sharply lower after leading earlier in the month. Weakness was widespread across logistics, machinery, and aerospace.
Comm Services (–0.88%), Utilities (–0.86%), Staples (–0.66%) – Defensive names offered no shelter as risk-off trade took hold and Treasury yields climbed. Investors showed little appetite for low-volatility allocation.
Information Technology (–0.11%) – Relative outperformer as Nvidia and AMD rebounded on China license optimism, but the broader tech complex was muted.
Macro Overlay: CPI Optics vs. Reality, Fed Path Divergence, and Sector Fragility
CPI: Soft Headline, Sticky Undercurrents
June core CPI rose just 0.2%, undershooting expectations for the second month in a row. But beneath that softness, core goods inflation accelerated especially in categories exposed to President Trump’s latest tariff push. Household appliances, sporting goods, furniture, and apparel all saw some of the fastest monthly increases in years. Markets were initially encouraged, but as traders dug into the composition, the optimism faded. The S&P 500 reversed hard, and Treasury yields surged.Fed Patience Holds, But Trump Turns Up the Heat
The CPI print gave ammunition to both sides of the Fed debate. Doves can point to soft shelter and service inflation, while hawks can cite rising goods prices. But traders trimmed bets on a September cut to just above 50%, with the market now pricing fewer than two cuts this year. Trump wasted no time, again demanding a 300 bp reduction and hinting at Powell’s removal. Meanwhile, Treasury Secretary Scott Bessent floated a leadership change and praised Kevin Warsh’s shift toward dovish policy a clear signal of growing political pressure.Sector Rotation Fails the Stress Test
Last week’s resilience was powered by rotation into value and cyclicals banks, real estate, and materials. But that trade collapsed Tuesday. Materials led the decline, suggesting input cost fears are escalating. Financials and industrials were hit by earnings concerns and positioning unwinds. Even defensives sold off as the long end of the yield curve broke higher. Only tech — ironically the most rate-sensitive held up, thanks to chip-specific headlines.
The Market Is Repricing the Wrong Kind of Inflation
This was not a "bad" inflation print in level terms but it was the wrong kind of inflation for risk assets. Narrow tariff pass-through in goods suggests margin pressures for corporates, not robust nominal growth. That spells trouble for earnings and undermines confidence in the rotation away from tech. With the Fed sidelined until core PCE, and bond yields marching higher, the soft-landing narrative may need a recalibration. If upcoming PPI and PCE prints confirm the trend, the path to a September cut could slip further and so too could equity valuations.

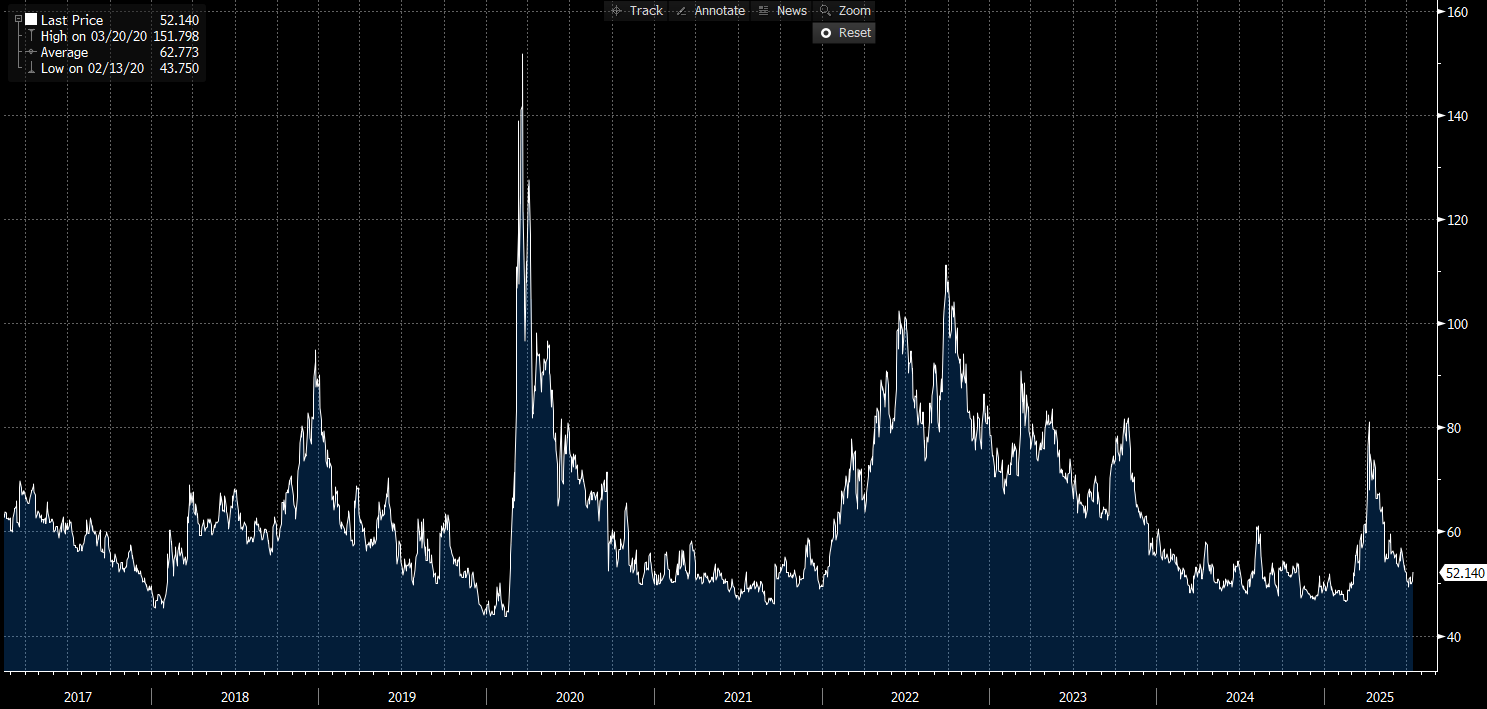
US IG Credit Wrap: Spreads Drift to 52.14 bp as Market Bets on Calm, Despite Repricing Risks Beneath the Surface
Current Spread: 52.14 bp | 5-Year Average: 62.77 bp
Investment-grade credit spreads ticked up modestly to 52.14 basis points on Tuesday, holding below their five-year average and still flirting with pre-COVID tights. The move came as both rate volatility and equity vol remain muted, even as signs grow that macro risks from tariffs to inflation pass-through are regaining traction. Credit investors appear unfazed, but the disconnect between headline calm and creeping dispersion suggests a market quietly recalibrating under the hood.
Credit Context
< 60 bp: Duration-friendly, carry-positive zone for insurers, pensions, and liability-driven buyers.
60–70 bp: Macro noise threshold, where volatility or inflation threats prompt positioning cuts.
> 90 bp: Systemic stress unlikely unless global macro or geopolitical shocks return.
Macro Overlay: Quiet Spreads, But Signals Getting Louder
Volatility Is Back to Sleep, But Spreads Aren’t Tightening Further
Despite a CPI release that came in soft at the headline level, underlying dynamics particularly on tariff-impacted goods have sparked a subtle rethink across markets. Treasury yields moved higher and equities slipped, but IG spreads barely moved. The lack of follow-through reflects positioning comfort, not conviction. With the VIX and MOVE indices back near their cycle lows, credit is enjoying a liquidity tailwind, but the appetite for adding risk at these levels is waning.Tariff Pass-Through Is Creeping into Fundamentals
June’s inflation report showed clear signs of price pressure emerging in categories directly hit by new levies, such as appliances, toys, and apparel. While the overall CPI was benign, the details matter for credit. Margins in consumer cyclicals are already tight, and Q3 earnings may start to expose the cracks. Spreads at 52 bp are not pricing this scenario. The assumption remains: tariffs will fade into noise. That could be a costly oversight if they start biting EPS guidance in earnest.Supply Machine Awakens Post-CPI
Primary markets remain quiet, but desks expect a surge in issuance as earnings blackouts lift. With credit spreads still tight and funding costs relatively stable, issuers are lining up to tap the market before summer illiquidity deepens. But if supply coincides with further curve steepening or another inflation surprise (PPI or PCE), dealer balance sheets could fill fast. That could push spreads wider not from stress, but from indigestion.Divergence in Quality Is Widening Again
While the index remains steady, dispersion across IG names is re-emerging. Lower-tier BBBs and credits with import-heavy cost structures have started to underperform. Bid-ask spreads have widened in sectors like retail, food, and logistics, where tariff risk is highest. This kind of divergence is often a canary for broader repricing even if the headline spread number stays anchored.
Tight, Calm… and Maybe Too Confident
At 52.14 bp, IG credit is no longer about value it’s about comfort. Investors are implicitly betting on a Fed that holds steady, inflation that fades, earnings that absorb cost pressure, and tariffs that stay political theatre. All of that may prove true. But if any one of those assumptions falters, there’s limited cushion. Credit isn't panicking, but it’s not hedging either.
Mag7 Model:
See the intro published for how to use the Mag7 models here: Link
Short-End Rates Wrap: Implied Easing Nudges to –108.4 bp as Traders Hold Fire Before PPI and Powell Watch
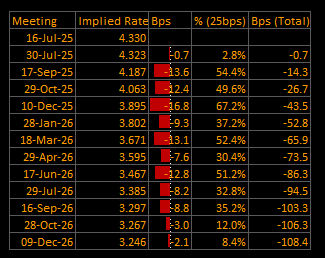
Cumulative Implied Easing: –108.4 bp | Terminal Rate Seen at 3.25% (Dec 2026)
The front-end OIS curve shifted modestly flatter Tuesday, with total implied easing now at –108.4 basis points by December 2026. While the path remains broadly consistent with a September liftoff for cuts, conviction tapered slightly after CPI data failed to decisively tip the scale. The market still sees a terminal rate in the low 3.20s but there’s growing sensitivity to the shape, not just the destination. PPI data and upcoming Fed commentary are the next pressure points for repricing.
OIS-Implied Rate Path
Front-End Meetings:
16-Jul-25: 4.330% → Fully priced out; preemptive move off the table
30-Jul-25: 4.323% (–0.7 bp) → ~3% chance of a cut → Powell risk still lingers, but no change expected
17-Sep-25: 4.187% (–13.6 bp) → ~55% cut probability → Still seen as the start of the easing cycle
29-Oct-25: 4.063% (–12.4 bp) → Two cuts now largely priced in
10-Dec-25: 3.895% (–16.8 bp) → Roughly 3 cuts by year-end implied
Macro Overlay: Markets Cool on September but Stay Committed to Cuts
September Cut Still Baseline, But Not a Lock
The probability of a September cut eased slightly as CPI came in soft but sticky in key goods categories. The market still assigns a better-than-even chance of a move, but confidence is eroding at the margin. Traders are now demanding confirmation from PPI and core PCE before taking another step toward fully pricing it in. Powell’s tone at the July FOMC will also be pivotal in defining whether September is truly live or just lingering.
→ The burden of proof has shifted back to the data…. not the Fed.
Tariff Pass-Through is Now in the Inflation Base Case
Traders have absorbed the latest tariff headlines, and inflation breakevens barely budged. But OIS curve steepness into Q4 and early 2026 reflects caution. While the Fed may tolerate short-term noise from import-sensitive goods, any further pickup in core goods — especially if echoed in the PCE could defer or dilute the early easing cycle.
→ Tariffs are not an upside surprise anymore they’re becoming consensus.
Fed Messaging Splits the Market Across 2025–26
With Bessent’s remarks stoking succession speculation and Warsh emerging as a contender openly pushing for cuts, the market is quietly navigating political risk alongside macro. The 2025 curve still shows a shallow descent, but 2026 cuts remain penciled in more confidently. That bifurcation tells us traders trust the long game but are unsure of the Fed’s near-term resolve.
→ Policy sequencing is less clear than the destination.
Carry Still Works, But Risk Premiums Are Getting Thin
With rate vol compressing and September conviction slipping, the short-end remains a carry-positive but crowded trade. The move to 3.25% terminal looks increasingly “priced for perfection” assuming smooth inflation normalization, steady labor, and no systemic shocks. It’s all working, but it’s not hedged for surprise.
The Curve Isn’t Moving… But the Certainty Is
Front-end pricing is steady, but the conviction behind it is thinning. At –108.4 bp, the curve reflects a patient but committed Fed, starting in September and easing methodically through 2026. But with CPI behind and PPI ahead, that story is on shaky footing. The data won’t need to scream to move this market it just needs to whisper something unexpected. The path looks smooth, but the grip on that wheel is tightening.
Tactical Portfolio
Morning Trade(s) and Market thread
Keep reading with a 7-day free trial
Subscribe to Capital Flows to keep reading this post and get 7 days of free access to the full post archives.