

Macro Regime Tracker: Heading Into CPI
Macro regime and risk assets qualified clear

The Macro Regime Tracker offers a daily lens on how shifts in growth, inflation, and liquidity affect short-term risk and reward. Leveraging machine learning, AI, and cross-asset data, it identifies macro changes and their impact on market positioning.
Macro Regime Tracker Index:
As we approach CPI tomorrow, I want to share several thoughts:
First, I laid out the entire macro context for WHERE we are with interest rates and how the signals connect to equities here:

Second, we are operating BETWEEN the tensions of the NFP print and this inflation risk. CPI is likely to re-anchor bonds, and ZT is likely to remain BELOW the high from last week. The NFP print caused more cuts to be priced but didn’t show significant issues in the labor market. The question for tomorrow is about HOW inflation is interacting with growth.
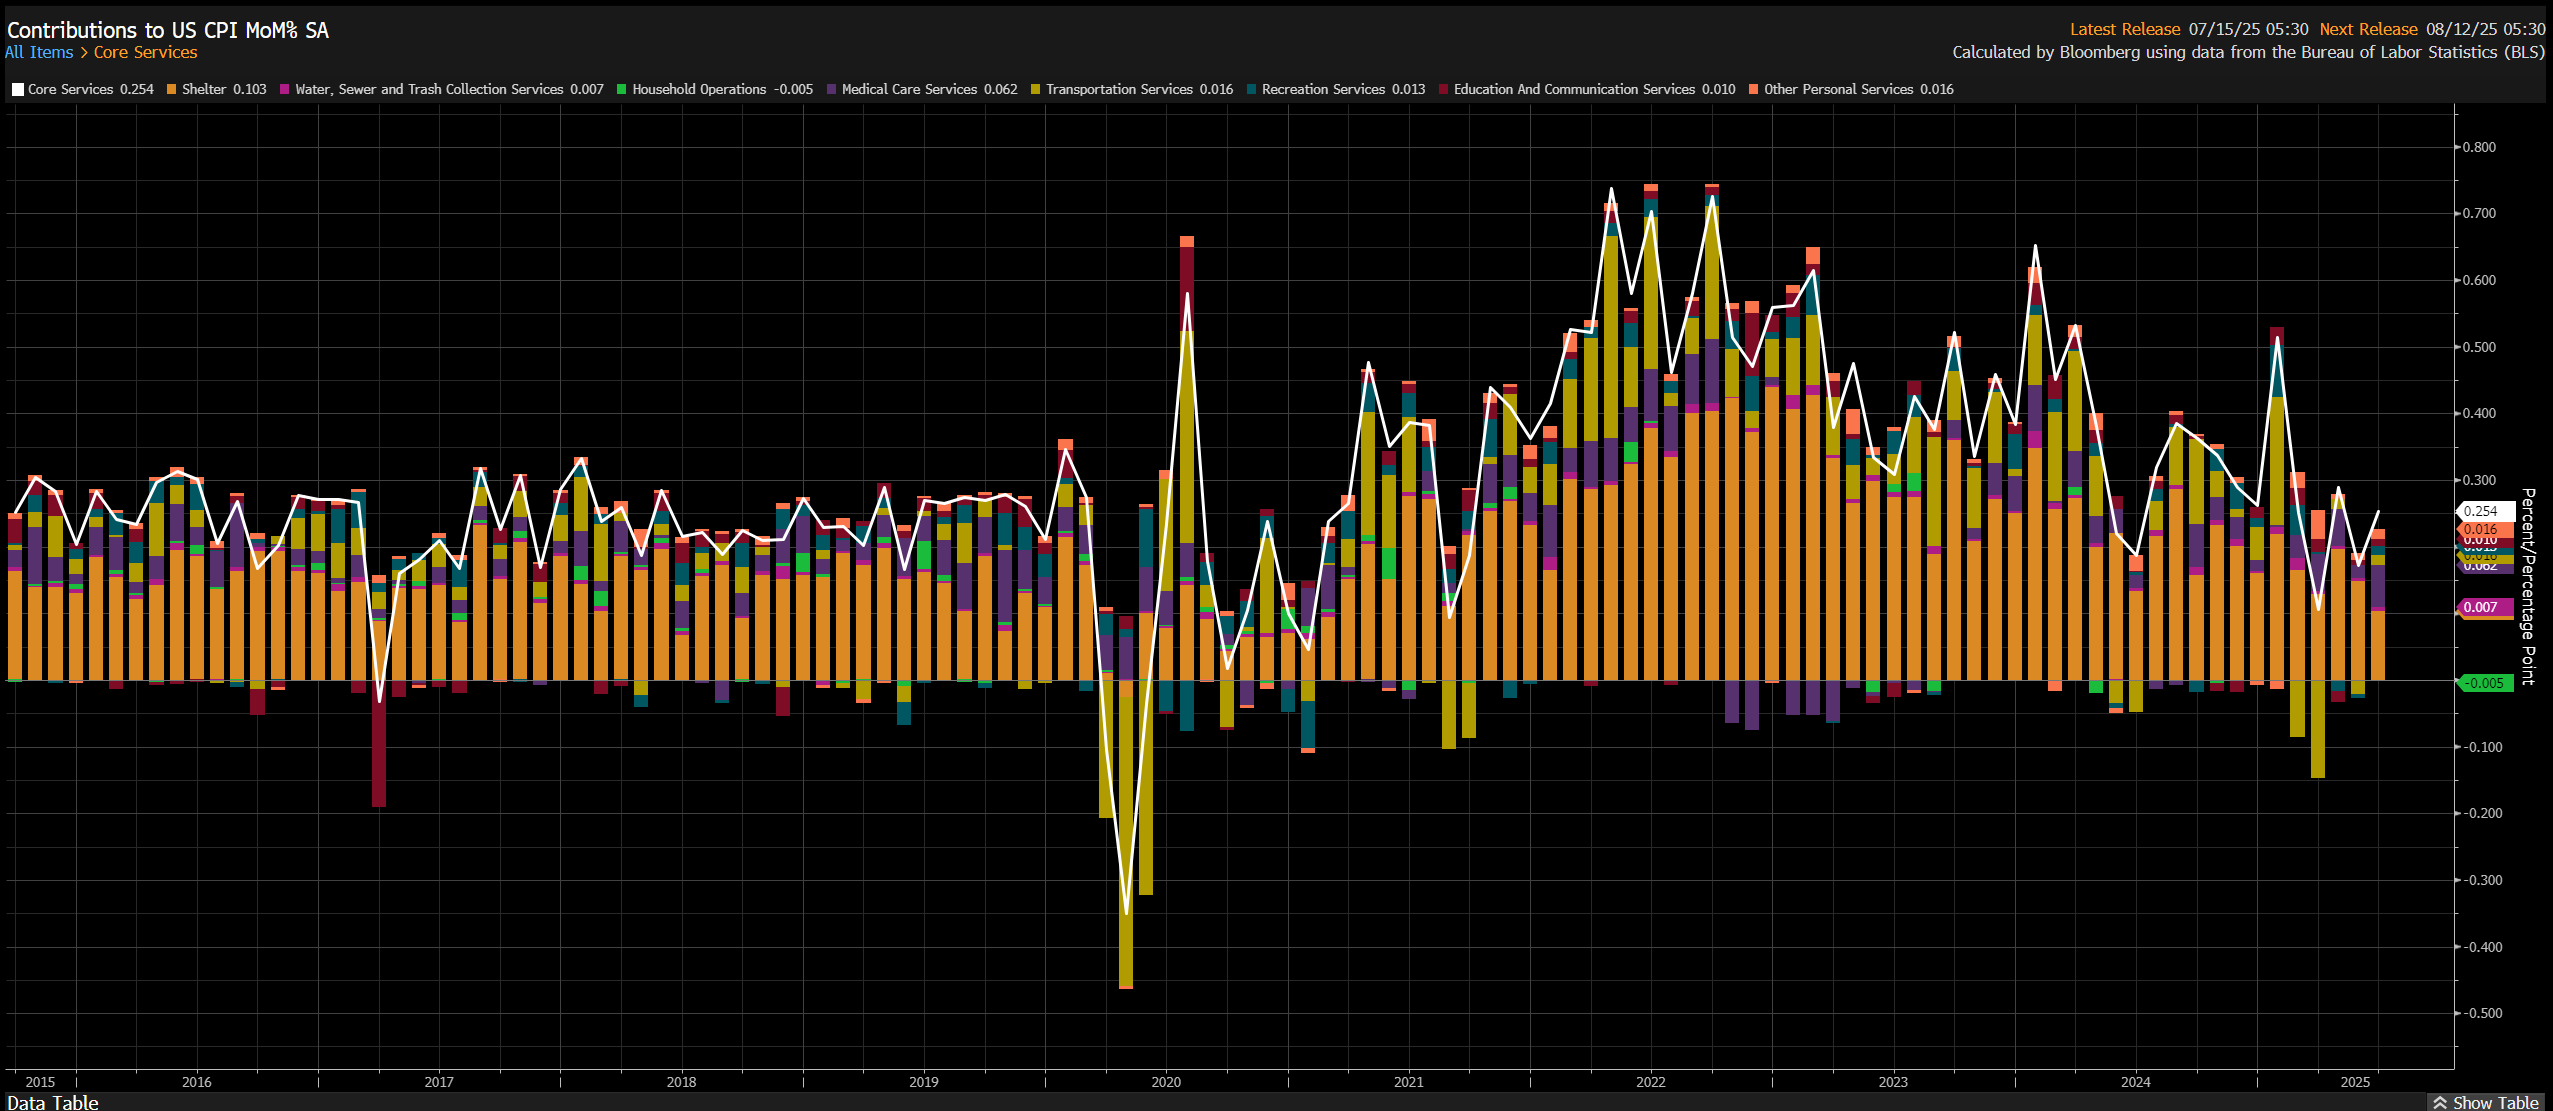
Third, everything is about core CPI. We know goods is likely to tick up a bit from the tariffs but the real focus is on core services because if those are rising, that is the real issue.

Fourth, I do not believe inflation is going to be “transitory” because it’s only driven by tariffs. If this were true, only core goods would be accelerating. Right now, we are still seeing resilient MoM prints in core services. This is the same TYPE of trend we are seeing in growth as both growth and inflation have a high correlation together.
Fifth, will a CPI print above or below expectations push risk assets up OR down? Here is how I think about this: if inflation comes in above expectations, we are likely to reprice the Sept cut to a lower probability. We are still in a negative stock bond correlation without enough inflation risk to cause a 2022 type of regime.
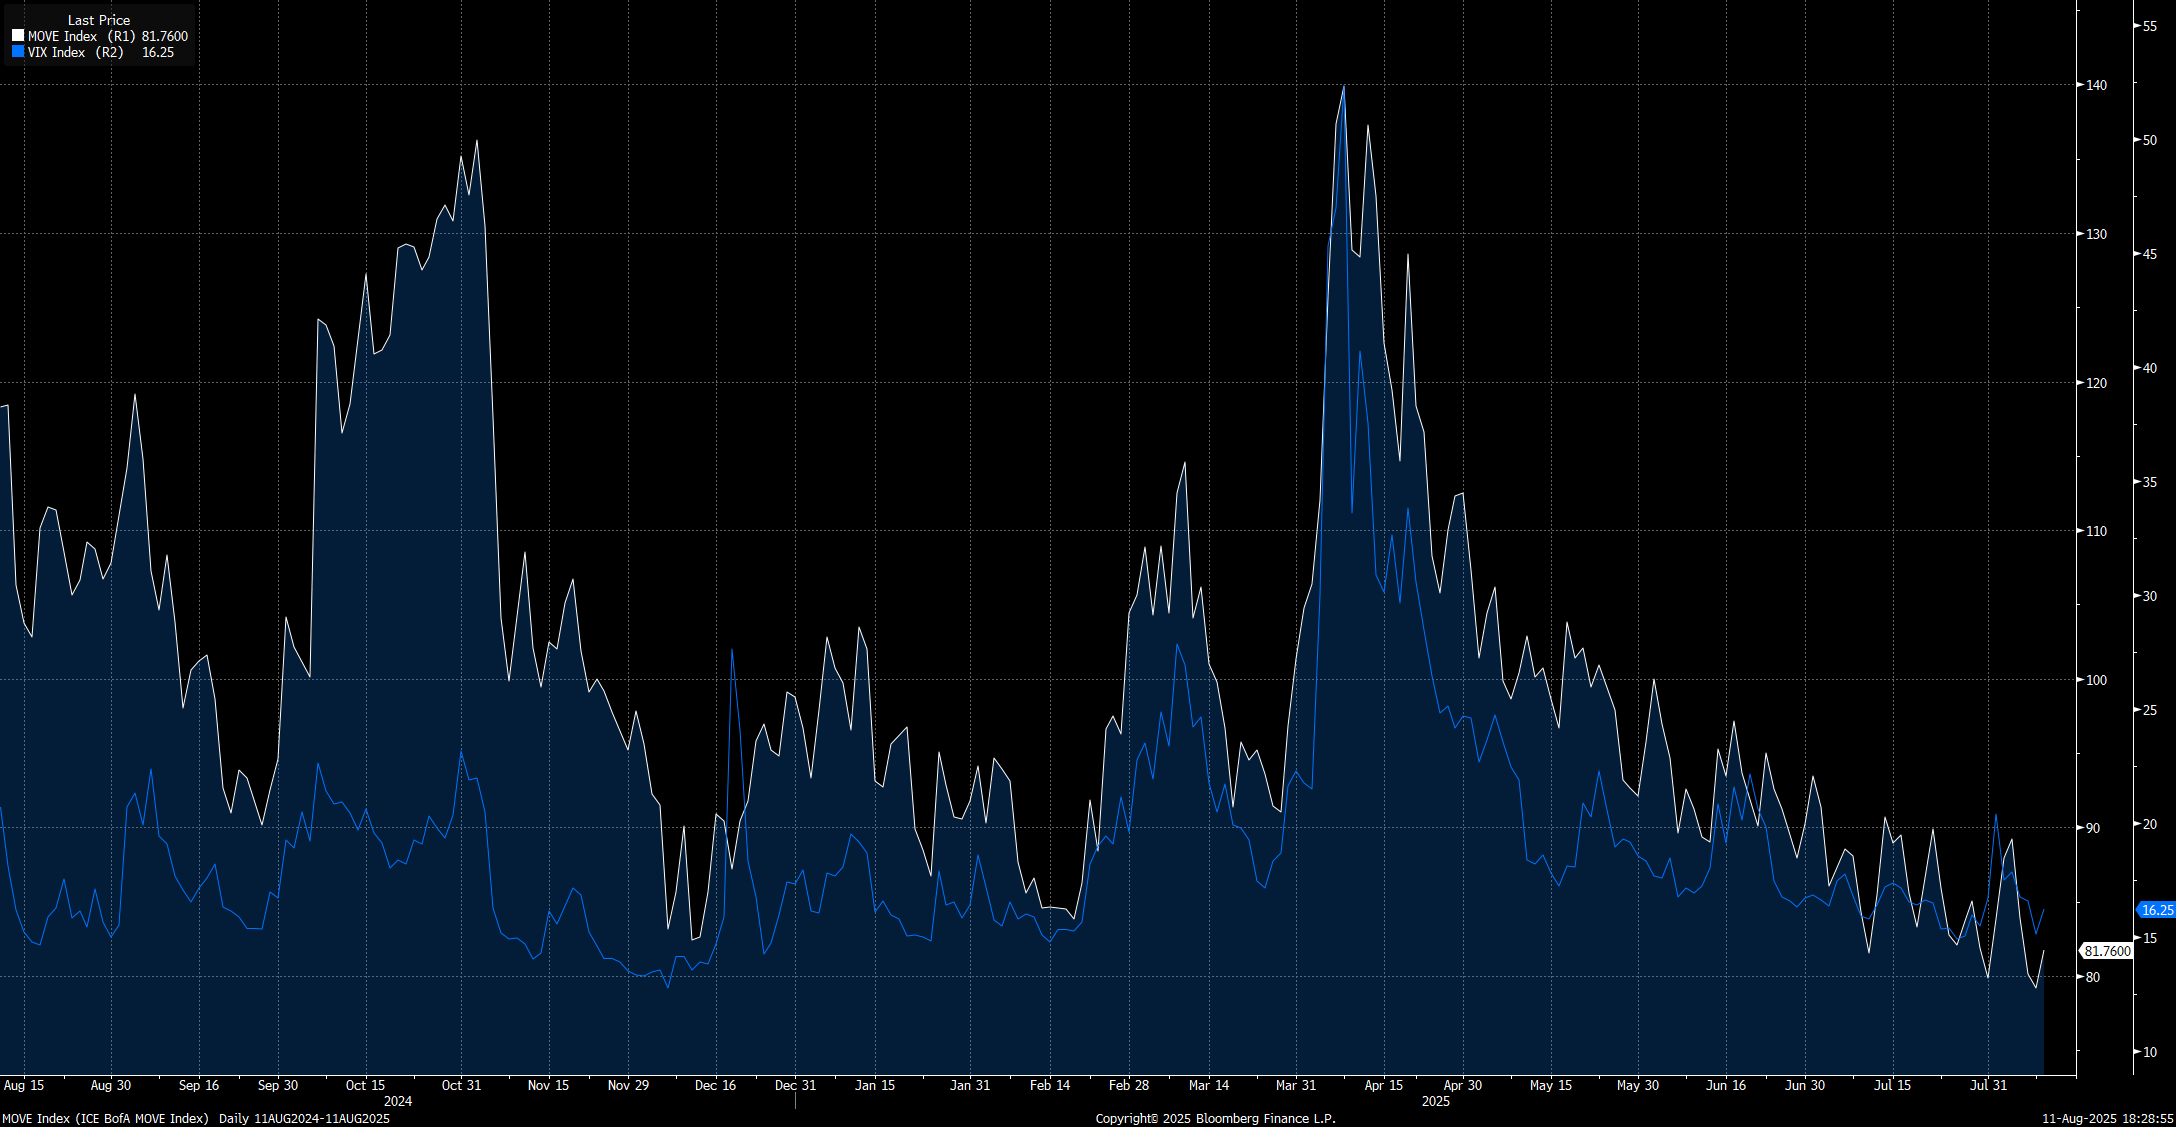
The move index and VIX remain in a compressed range. This trend, along with the compressing range in CPI print variance, is not setting up for a massive blowout in CPI that causes ES to sell off 2%. Any marginal selling pressure is likely to mean revert by Friday, in my view.
Again, see the interest rate report for HOW I explained the signal to watch for in a potential macro inflection point.
Finally, you can find the two videos I recorded today here:
Memecoins as a Liquidity Mirror: Tracing the Flow from Global Capital to Cultural Tokens

Memecoins as a Liquidity Mirror: Tracing the Flow from Global Capital to Cultural Tokens
And here:
As always, all the systematic models have been updated below.
Thanks
Main Developments In Macro
US Macro & Policy
TRUMP HAS SIGNED ORDER EXTENDING THE US-CHINA TARIFF TRUCE: CNBC
TRUMP SAYS 'GOLD WILL NOT BE TARIFFED'
TRUMP: I SAID I WANT 20% IF I APPROVE CHIP EXPORTS
TRUMP: NEGOTIATED DOWN TO 15% ON CHIP DEAL
TRUMP CONFIRMS NVIDIA'S 15% PAYMENT ON H20 CHIP SALES TO CHINA
TRUMP ON CHINA: WE'LL SEE WHAT HAPPENS
TRUMP COMMENTS ON CHINA TRADE TRUCE DEADLINE
TRUMP: SOYBEANS WAY TO REDUCE CHINA’S TRADE DEFICIT WITH USA
TRUMP: HOPE CHINA WILL QUICKLY QUADRUPLE SOYBEAN ORDERS
TRUMP: CHINA IS WORRIED ABOUT ITS SHORTAGE OF SOYBEANS
TRUMP TURNS TO BESSENT TO LEAD SEARCH FOR NEXT FED CHAIR: WSJ
TRUMP ADDS BULLARD, SUMERLIN TO FED CHAIR CANDIDATE LIST: WSJ
BESSENT TO SERVE AS ACTING IRS COMMISSIONER TEMPORARILY: NYT
TRUMP TO REPLACE I.R.S. COMMISSIONER: NYT
WHITE HOUSE TO CLARIFY MISINFORMATION ON GOLD TARIFFS: OFFICIAL
GOLD ORDER TO BE POSTED IN NEAR FUTURE: WHITE HOUSE OFFICIAL
Federal Reserve & Monetary Policy
FED'S MUSALEM: LABOR MARKET IS IN BALANCE
MUSALEM: THERE'S A RISK WE MAY MISS ON BOTH SIDES OF MANDATE
MUSALEM: WE'RE MISSING ON OUR INFLATION TARGET, NOT EMPLOYMENT
US Trade, Industry & Corporate News
AMD CONFIRMS IT RECEIVED CHINA AI CHIP EXPORT LICENSES
MICRON SHARES JUMP 6.5% AFTER BOOSTING SALES, EARNINGS GUIDE
MICRON SEES 4Q ADJ. REV. $11.1B TO $11.3B, SAW $10.4B TO $11B
INTEL CEO: ENGAGING WITH ADMIN TO ADDRESS MATTERS RAISED
Macro Tear Sheets: Equities, Stock/Bond Correlation, Fixed Income, FX, Crypto, and Commodities
Macro Regime Dashboard: Excel spreadsheet for economic data, interest rates, and real estate.
Momentum and Mean Reversion Models: Equities, Commodities, Fixed Income, and Currencies
You can find the educational primer and video explanation of these models here: LINK
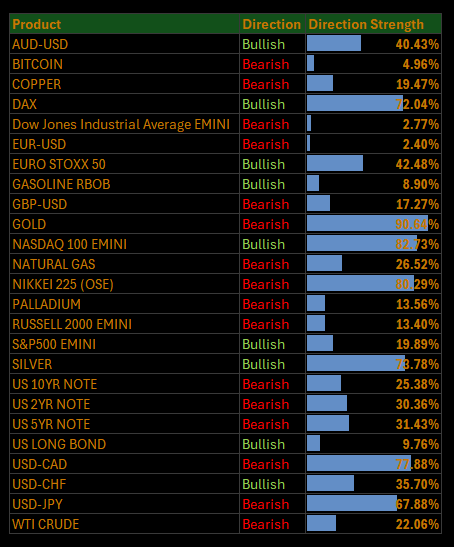
Here is a summary of all models and their directional strengths:
Growth, Inflation, Fixed Income, Credit, and Equities Regime Tracker
The Macro Regime Model offers a real-time view of growth, inflation, and yield curve dynamics, integrating these with credit market shifts, equity risk premiums, and positioning data. It connects upcoming catalysts to statistical drivers of asset prices, creating a unified framework that quantifies skew and clarifies risk-reward across asset classes.
Key Points To Set The Context:
US Market Wrap: Cautious Tone as CPI Looms and Tariff Truce Extended
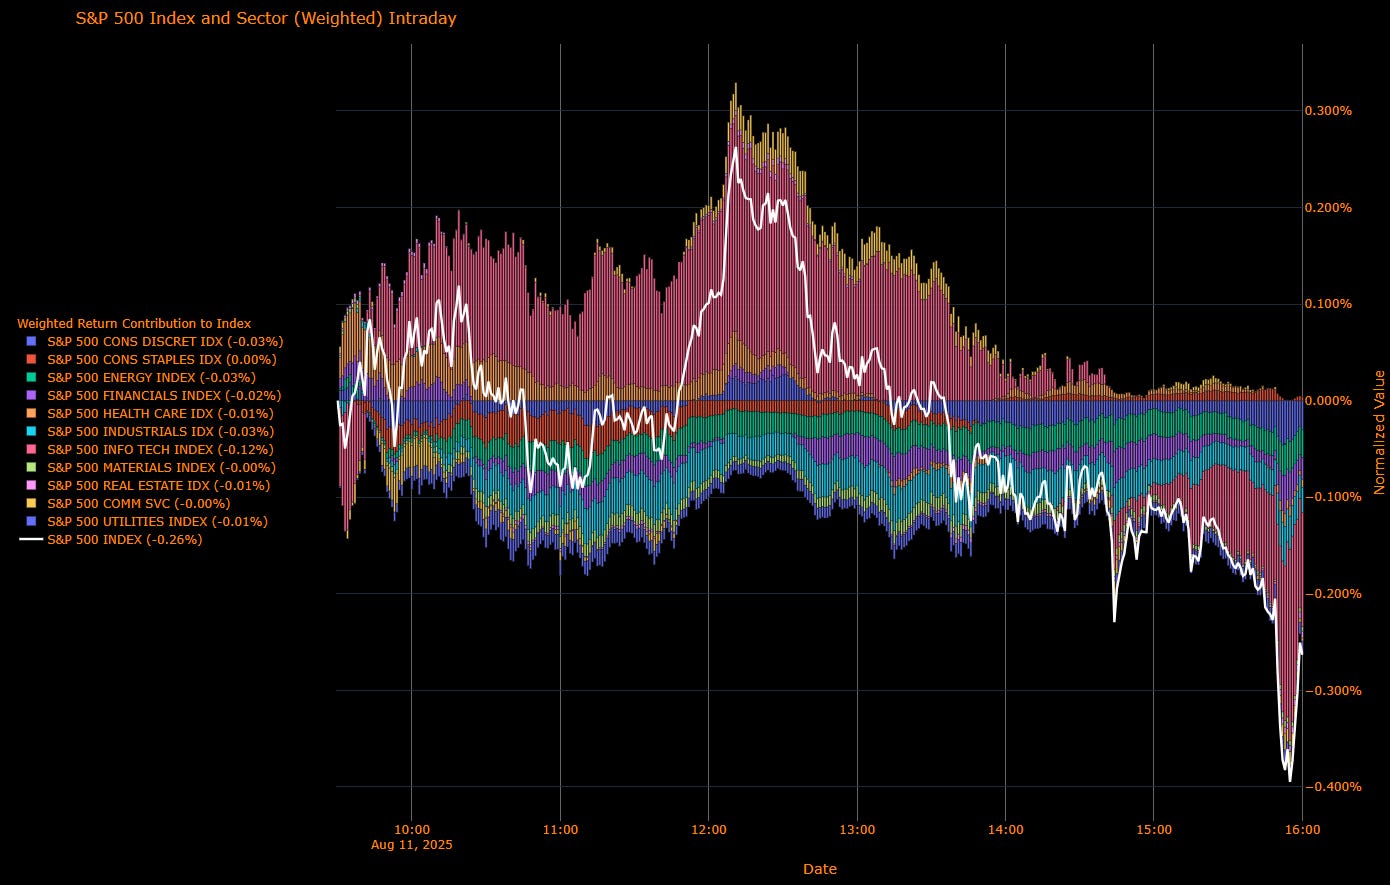
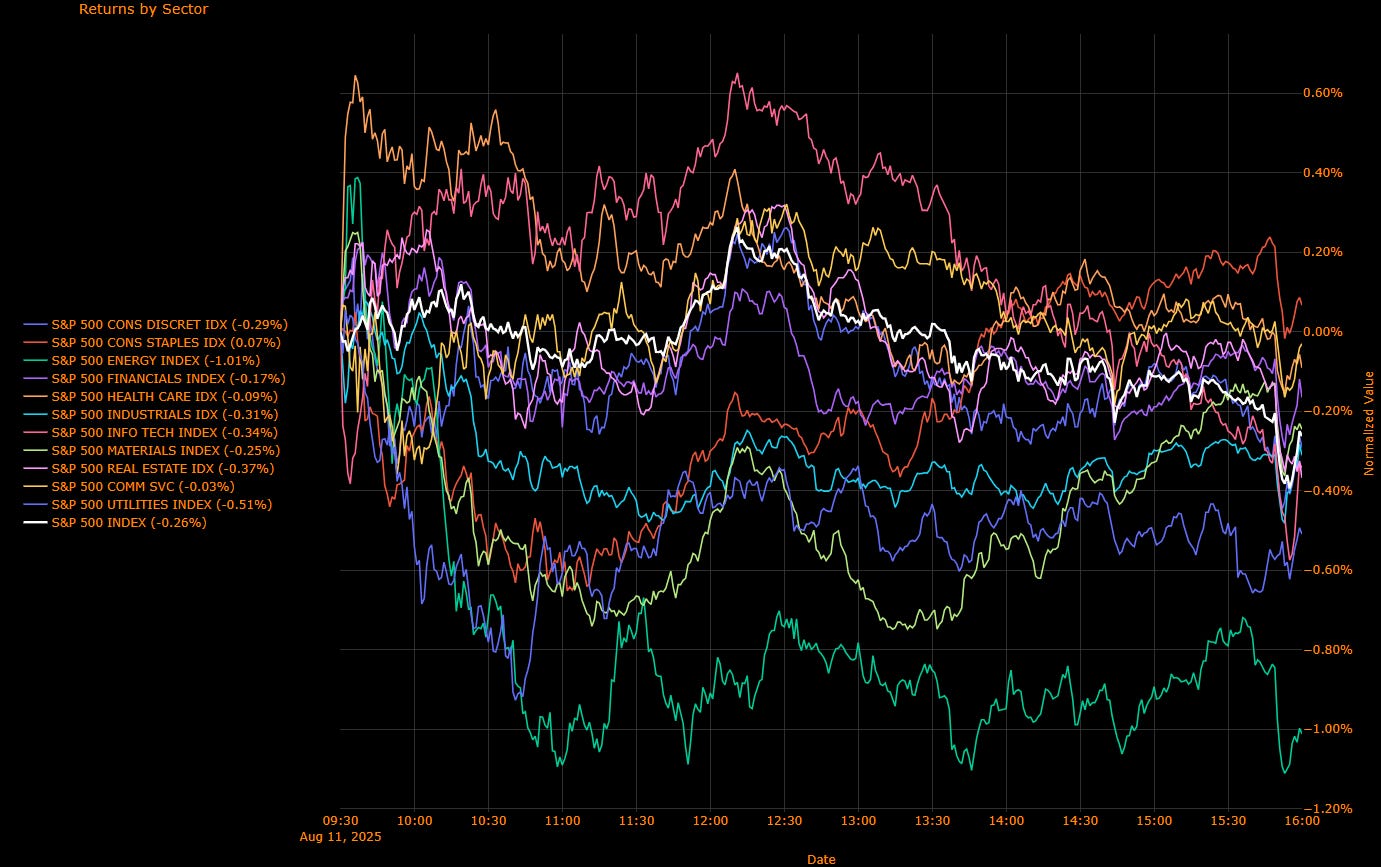
The S&P 500 slipped 0.26% on Monday, halting its march toward record highs as investors turned defensive ahead of Tuesday’s critical CPI release. The modest pullback followed last week’s strong run, with traders digesting President Trump’s 90-day extension of the US–China tariff truce and weighing its impact against sticky inflation risks.
Sector Contribution Breakdown
(Weighted Return Contribution to S&P 500)
Top Positive Contributor
Consumer Staples (0.00 pp) – Defensive demand kept the sector flat on a weighted basis, masking underlying stock-specific gains.
Flat to Negative Contributors
Info Tech (–0.12 pp) – Megacap tech dragged the index after last week’s strong outperformance, with AI-linked names taking profits.
Energy (–0.03 pp) – Crude’s modest uptick failed to offset broad weakness in oil and gas equities.
Consumer Discretionary (–0.03 pp) – Mixed retail performance weighed, with high-beta names hit hardest.
Financials (–0.02 pp) – Banks softened as long-end yields stalled.
Health Care (–0.01 pp) – Marginal declines across biotech and large-cap pharma.
Real Estate (–0.01 pp) – Rate-sensitive REITs faced light selling.
Utilities (–0.01 pp) – Higher Treasury yields kept the pressure on.
Industrials (–0.03 pp) – Trade-sensitive manufacturing stocks lagged.
Materials (–0.00 pp) – Little change, with commodity names balanced by demand concerns.
Comm Services (–0.00 pp) – Flat despite modest gains in media.
Sector Performance Breakdown
(Unweighted Daily Returns)
Leaders
Consumer Staples (+0.07%) – Mild defensive bid ahead of CPI.
Health Care (–0.09%) – Outperformed on a relative basis despite being slightly negative.
Laggards
Energy (–1.01%) – Worst performer as oil service names sold off.
Utilities (–0.51%) – Yield sensitivity weighed.
Real Estate (–0.37%) – Weakness in commercial property names.
Info Tech (–0.34%) – Broad tech pullback after last week’s AI-driven rally.
Industrials (–0.31%) – Ongoing tariff and supply chain overhang.
Macro Overlay: CPI Countdown, Fed Watch, and Dollar Debate
Markets were subdued as the focus shifted squarely to Tuesday’s CPI report, forecast to show a 0.3% MoM core increase the largest since January. Traders are split: 18% expect a risk-on reaction, 43% mixed, and 39% risk-off, per a 22V Research survey. Options pricing suggests the S&P 500 could swing +2% on a cooler print or drop ~3% on a hot reading.
President Trump extended the pause on tariffs for Chinese goods by 90 days, easing one geopolitical overhang. The move came alongside White House confirmation that gold imports will not face tariffs, calming commodity markets after initial confusion.
Fed speculation remains lively, with Vice Chairs Michelle Bowman and Philip Jefferson among candidates to replace Jerome Powell when his term expires. Market-implied odds for a September cut remain near 80%, with two cuts priced by year-end.
Meanwhile, a research paper questioned the long-term dominance of the US dollar, noting that Trump’s unpredictable tariff policy and rising fiscal deficits are prompting diversification by global investors. Treasury yields were steady, with the 10-year at 4.28%, but strategists warn that persistent dollar skepticism could push long-term rates higher over time.
Final Word: Low-Conviction Tape Before Key Macro Catalyst
With earnings season winding down and the CPI print looming, Monday’s trade was marked by position-trimming and sector rotation into defensives. The tariff truce extension may provide short-term relief, but the market’s next move hinges squarely on inflation data. A soft print could reignite momentum, while an upside surprise risks triggering the largest one-day reversal since early summer.
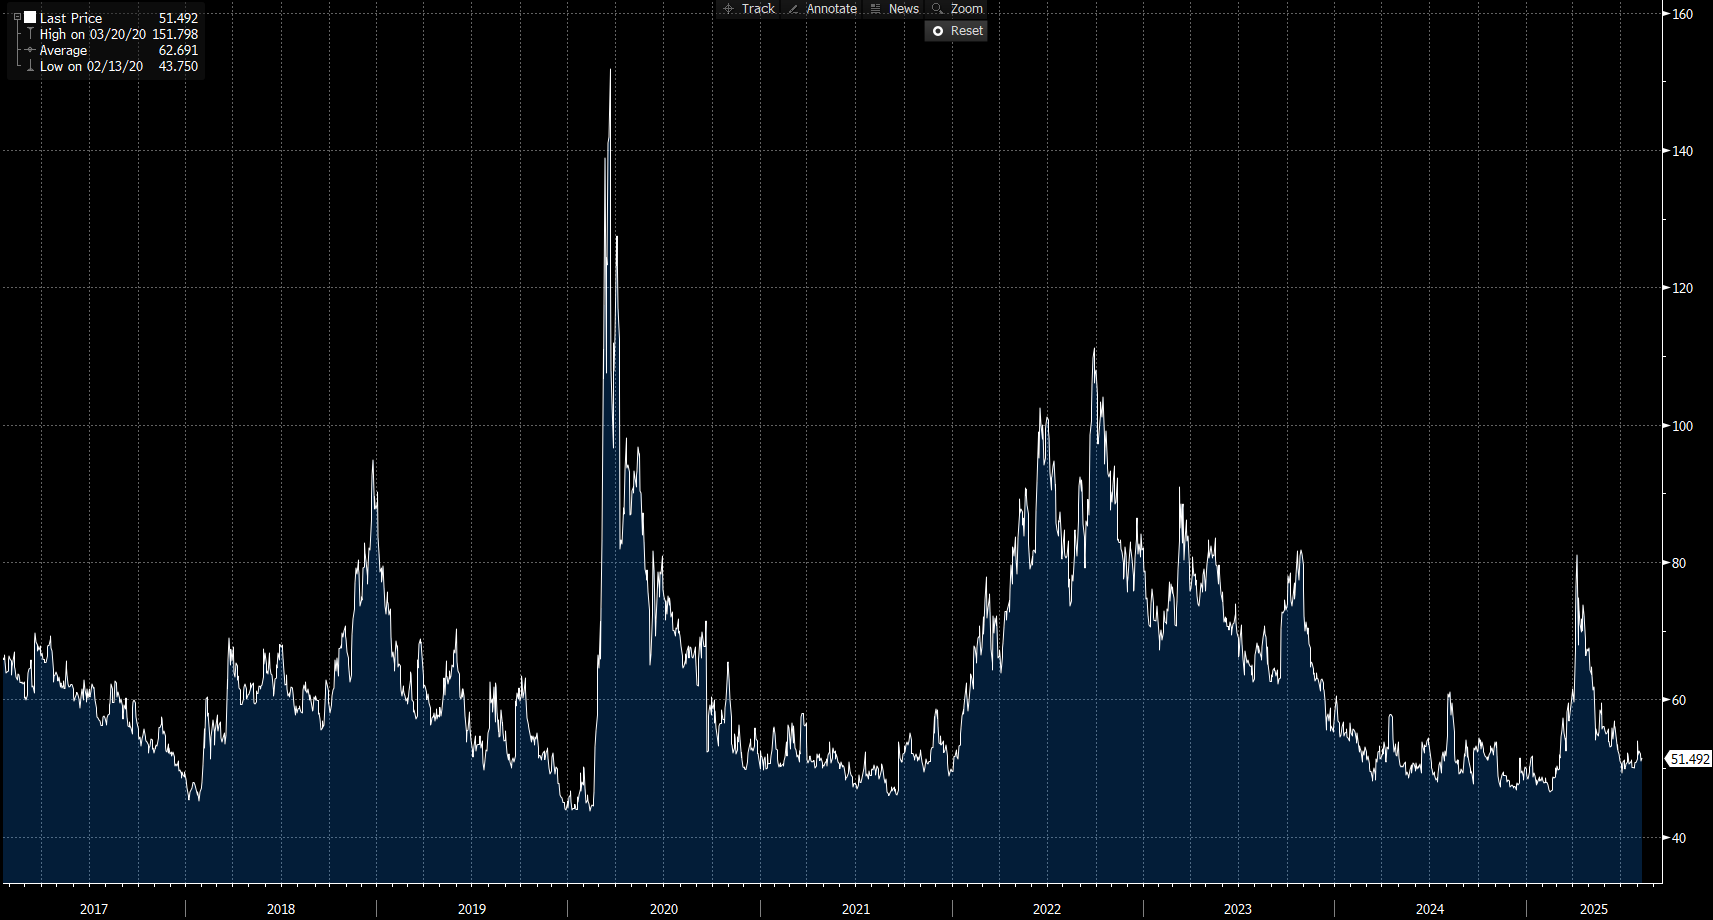
US IG Credit Wrap: Calm Before CPI — Spreads Drift at ~51 bp, Still in “Carry-Comfort” Zone
Current IG OAS: 51.49 bp • 5-yr avg: 62.69 bp • Cycle low: 43.75 bp • COVID high: 151.80 bp
10y UST: 4.28% (little changed) • Dollar: +0.3% • Equity vol: subdued
Investment-grade spreads are anchored just above 51 bp, hugging the bottom of the post-COVID range and signaling a market content to harvest carry into tomorrow’s CPI. The backdrop is busy tariff truce extended 90 days, Fed chair speculation ongoing but none of it has yet forced a risk re-mark.
Credit Context
< 60 bp: Duration-friendly, carry-positive zone for insurers, pensions, and liability-driven buyers.
60–70 bp: Macro noise threshold, where volatility or inflation threats prompt positioning cuts.
> 90 bp: Systemic stress unlikely unless global macro or geopolitical shocks return.
Macro overlay: why the tape is quiet
CPI countdown: Consensus core CPI +0.3% m/m (largest since Jan). IG typically tracks equities/UST beta with a lag; first move likely in rates, then spreads.
Policy noise, limited bite (for now): 90-day US–China tariff pause removes an immediate tail risk; WH clarified no gold tariffs. Fed leadership chatter persists; markets still price ~80% odds of a September cut and >2 cuts by year-end another reason spreads stay pinned.
Dollar debate vs. near-term flows: Longer-run “multipolar FX” arguments are building, but near-term the stronger dollar + steady USTs keep IG demand intact (global buyers hedging USD).
So we wait…
IG remains priced for “good-enough” macro and supportive policy. Tomorrow’s CPI is the first real test in weeks; absent a hot surprise, the tape likely re-embraces carry and keeps spreads pinned near 50–55 bp.
Mag7 Model:
See the intro published for how to use the Mag7 models here: Link
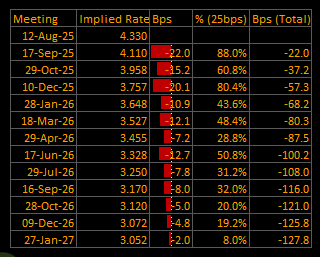
Short-End Rates Wrap: September Cut Nearly Locked, Path Holds at –128 bp
Cumulative Implied Easing (to Jan 2027): –128.0 bp
Terminal Rate (Jan 2027): 3.050%
September OIS Cut Probability: 88.0% | Implied Rate: 4.110%
The September rate cut remains highly likely, with markets pricing an 88.0% probability and 22.0 bp of easing for the meeting. The curve beyond September retains a steady easing profile, taking the terminal rate to 3.050% by January 2027, with total implied cuts holding at –128.0 bp.
This stability signals that traders are content to hold existing easing expectations ahead of tomorrow’s CPI report, with only minor adjustments in the back end of the path since yesterday.
OIS-Implied Policy Path
Macro Overlay: CPI Looms, Politics and Tariff Pause in Focus
Fed in Transition: The September meeting remains set for a cut, but attention is already turning to 2026 leadership changes. The candidate field for Powell’s successor remains fluid, with market bias toward a pro-cut composition keeping easing expectations intact.
Tariff Relief (for now): President Trump’s 90-day extension of the US–China tariff truce has removed an immediate tail risk, and the White House has clarified that gold imports will not be subject to tariffs. While the near-term inflation impact is muted, traders remain alert to potential goods-price pressures later in the year.
CPI Risk: Tomorrow’s print (consensus core CPI +0.3% m/m) is expected to be the largest since January. A hotter reading could push back cuts in late 2025 and 2026, while an in-line or cooler number would likely cement the current glide path to 3.05%.
From Firm to Conditional
The rate path remains steady, but its execution now hinges on:
Inflation data: Whether CPI and subsequent prints show tariff passthrough into goods prices.
Fed leadership tone: How potential 2026 appointees balance growth and inflation risks.
Labor market trends: If cooling remains gradual or risks tipping into contraction.
For now, September is highly likely. But CPI could be the pivot point that either locks in the glide path or forces traders to reprice the back end of the curve.
Tactical Portfolio
Morning Trade(s) and Market thread
Keep reading with a 7-day free trial
Subscribe to Capital Flows to keep reading this post and get 7 days of free access to the full post archives.