

Macro Regime Tracker: Updated Models
Macro regime and risk assets qualified clearly

The Macro Regime Tracker offers a daily lens on how shifts in growth, inflation, and liquidity affect short-term risk and reward. Leveraging machine learning, AI, and cross-asset data, it identifies macro changes and their impact on market positioning.
Macro Regime Tracker Index:
I will be publishing an interest rate report tomorrow explaining how I am thinking through the macro volatility we are likely to see into the end of the year. The framework and educational primer for rates were laid out in this report:
Interest Rates and Macro Volatility: Understanding the Forces Moving Markets

Interest Rates and Macro Volatility: Understanding the Forces Moving Markets
The video breakdown of all the trades/views is here:
Trade Update: Video Breakdown Of Trades And Macro Views

Trade Update: Video Breakdown Of Trades And Macro Views
And below are the updated systematic models and strategies.
Thanks
Main Developments In Macro
US Monetary Policy & Fed Leadership
TRUMP TURNS TO BESSENT TO LEAD SEARCH FOR NEXT FED CHAIR: WSJ
TRUMP ADDS BULLARD, SUMERLIN TO FED CHAIR CANDIDATE LIST: WSJ
TRUMP ADDS NEW NAMES TO FED CHAIR LIST: WSJ
US Housing & GSEs
UNCLEAR IF MORTGAGE GIANTS IPO AS ONE OR SEPARATE ENTITIES: WSJ
BELIEVED IPO COULD VALUE FANNIE, FREDDIE AROUND $500B: WSJ
OFFICIALS BELIEVE FANNIE,FREDDIE OFFERING COULD RAISE ~$30B: WSJ
US PREPARES FANNIE MAE, FREDDIE MAC IPO LATER THIS YEAR: WSJ
GOVERNMENT PREPARING TO IPO FANNIE MAE, FREDDIE MAC: WSJ
Federal Reserve Commentary
FED'S MUSALEM: LABOR MARKET IS IN BALANCE
MUSALEM: THERE'S A RISK WE MAY MISS ON BOTH SIDES OF MANDATE
MUSALEM: WE'RE MISSING ON OUR INFLATION TARGET, NOT EMPLOYMENT
Geopolitical & Trade
US, RUSSIA SAID TO PLAN UKRAINE DEAL CEMENTING RUSSIAN GAINS
OIL FALLS AS US, RUSSIA SAID TO PLAN UKRAINE DEAL
BESSENT: CHINA TARIFFS COULD BE ON THE TABLE AT SOME POINT
BESSENT: MANUFACTURERS 'EATING' TARIFFS
TRUMP ON INDIA TARIFF: NO TALK UNTIL GET THINGS RESOLVED
Macro Tear Sheets: Equities, Stock/Bond Correlation, Fixed Income, FX, Crypto, and Commodities
Macro Regime Dashboard: Excel spreadsheet for economic data, interest rates, and real estate.
Momentum and Mean Reversion Models: Equities, Commodities, Fixed Income, and Currencies
You can find the educational primer and video explanation of these models here: LINK
Here is a summary of all models and their directional strengths:
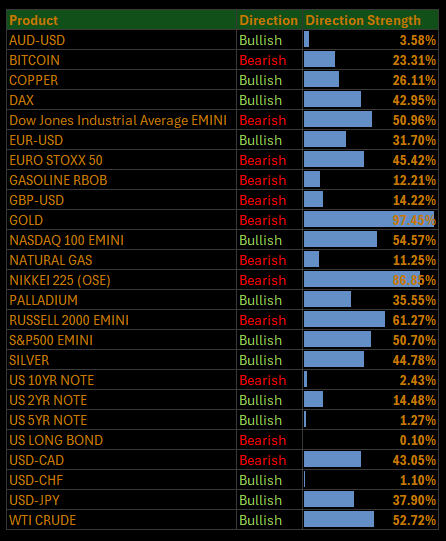
Growth, Inflation, Fixed Income, Credit, and Equities Regime Tracker
The Macro Regime Model offers a real-time view of growth, inflation, and yield curve dynamics, integrating these with credit market shifts, equity risk premiums, and positioning data. It connects upcoming catalysts to statistical drivers of asset prices, creating a unified framework that quantifies skew and clarifies risk-reward across asset classes.
Key Points To Set The Context:
US Market Wrap: Bulls Push Higher as Fed Drama and Tariff Risks Simmer
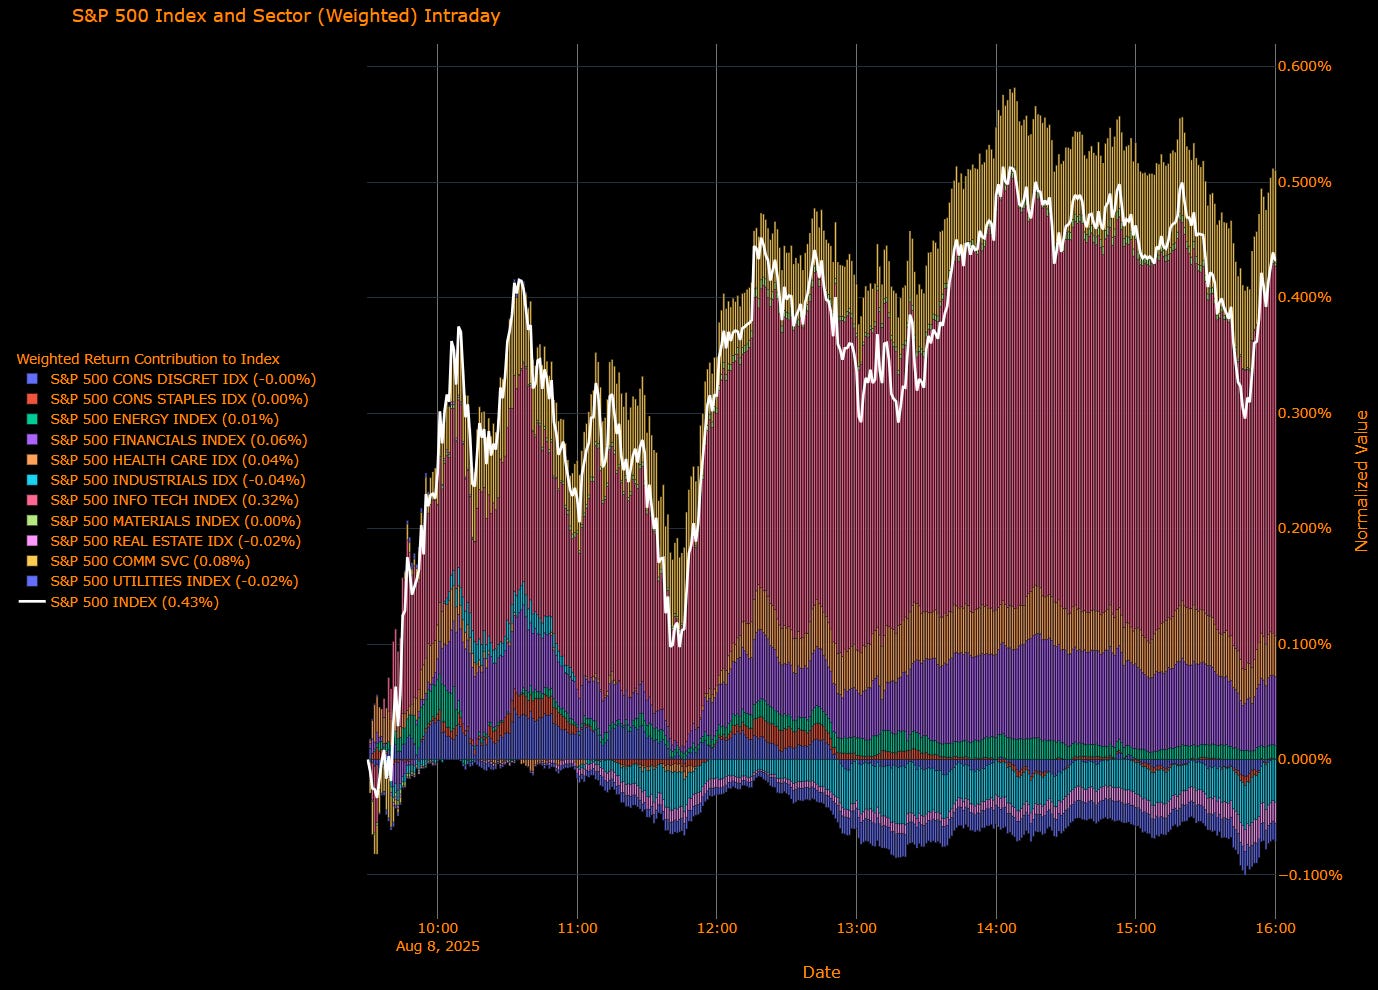
The S&P 500 rose 0.43% on Friday, extending its advance toward record highs and capping its best week since June. Sentiment was underpinned by resilient earnings, megacap leadership, and optimism around a potential US–Russia deal on Ukraine, even as political theater over Fed leadership and tariff tensions with India kept macro risks in play.
Sector Contribution Breakdown
(Weighted Return Contribution to S&P 500)
Top Positive Contributors
Info Tech (+0.32 pp) – Mega-cap tech outperformed again, with AI-linked names leading.
Comm Services (+0.08 pp) – Large-cap platforms and media gained traction on improved ad-spend signals.
Financials (+0.06 pp) – Banks and diversified financials rebounded alongside higher long-end yields.
Health Care (+0.04 pp) – Biopharma strength offset tariff overhang.
Flat to Negative Contributors
Energy (+0.01 pp) – Crude held gains but refining margins tempered upside.
Consumer Staples (0.00 pp) – Stable defensive bid, but muted follow-through.
Materials (0.00 pp) – Commodity-linked names balanced by demand concerns.
Utilities (–0.02 pp) – Yield-sensitive sector lagged as rates edged higher.
Real Estate (–0.02 pp) – REITs slipped on higher yields.
Industrials (–0.04 pp) – Trade-sensitive names weighed by tariff rhetoric.
Consumer Discretionary (–0.00 pp) – Flat, with retail mixed on cost concerns.
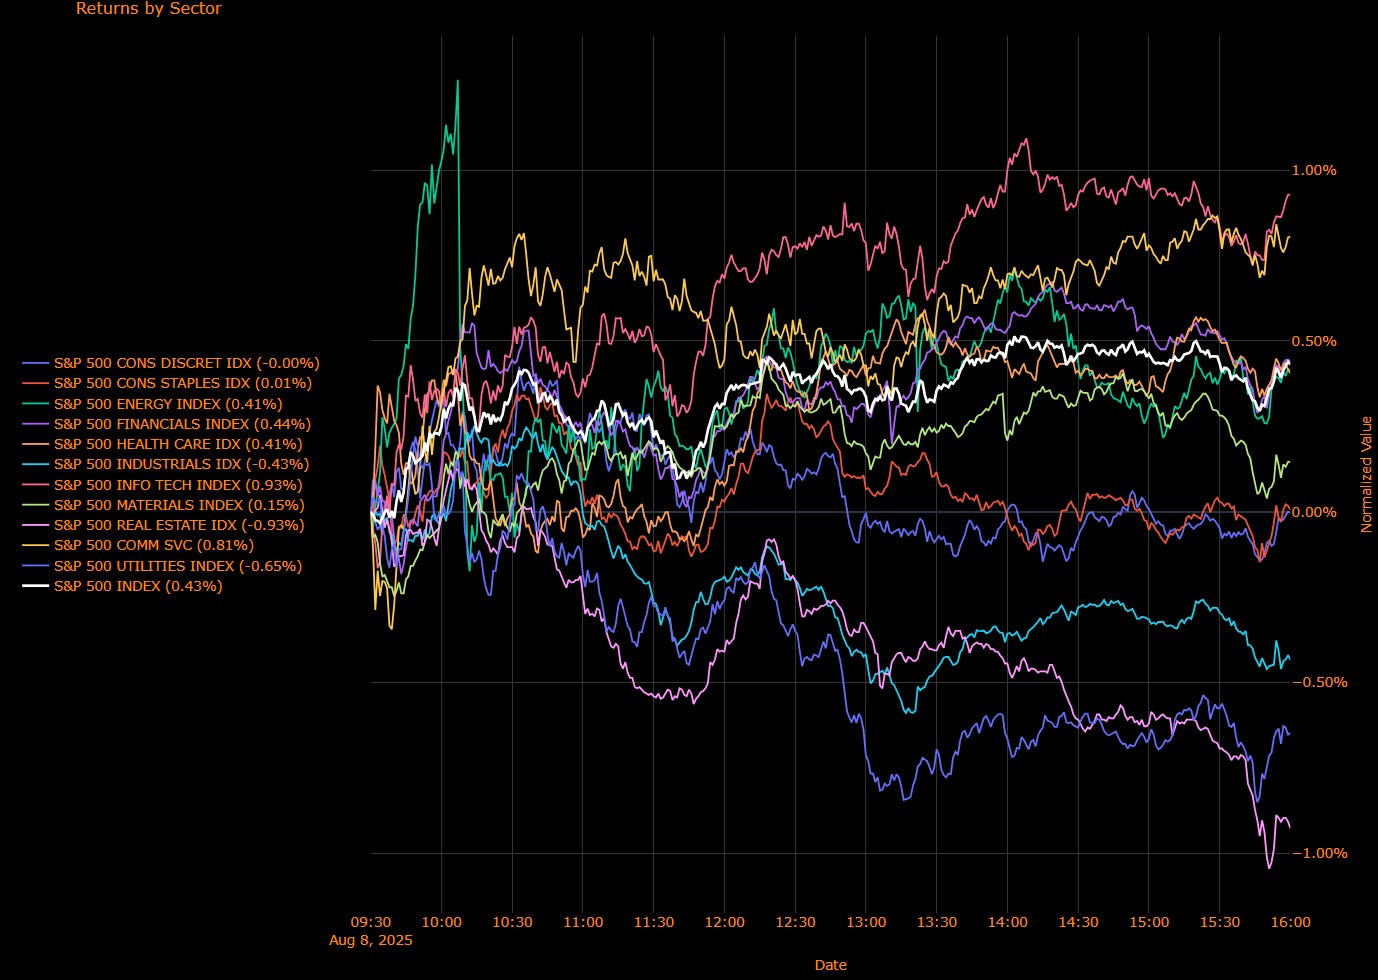
Sector Performance Breakdown
(Unweighted Daily Returns)
Leaders
Info Tech (+0.93%) – Momentum intact as AI demand narrative drives flows.
Comm Services (+0.81%) – Digital platforms and streaming recovered from early-week softness.
Financials (+0.44%) – Rate-sensitive plays lifted as curve steepened modestly.
Health Care (+0.41%) – Large-cap pharma and biotech gained on earnings beats.
Energy (+0.41%) – Oil service names followed crude higher.
Laggards
Consumer Staples (+0.01%) – Barely positive, defensive tone fading.
Materials (+0.15%) – Mild gains but no leadership role.
Consumer Discretionary (–0.00%) – Essentially flat.
Industrials (–0.43%) – Pressured by tariff risk and supply chain chatter.
Utilities (–0.65%) – Dragged by higher yields.
Real Estate (–0.93%) – Worst performer, hurt by rate-sensitive selling.
Macro Overlay: Fed Chair Theater and Tariff Tensions
Markets digested President Trump’s temporary nomination of Stephen Miran to the Fed Board, a move widely seen as a stopgap before naming a new Fed Chair in 2026. Miran is aligned with Trump’s pro-rate-cut stance, and his confirmation could add another dovish voice to the FOMC by year-end. This comes as swaps still price a 95% probability of a September cut, though political pressure on the Fed is now an active market risk.
Trade remains in the headlines after a tense breakdown in US–India relations, with Trump imposing 50% tariffs on Indian exports, partially linked to Russian oil purchases. The standoff risks reorienting India toward China, complicating US Indo-Pacific strategy.
Earnings continue to surprise to the upside, with 80% of S&P 500 companies beating estimates this quarter, reinforcing the bullish tone. However, flows show a split personality: $28B left US equities in the past week while $107B moved into money market funds.
Rally Has Momentum, But Macro Clouds Persist
Friday’s advance was broad enough to keep the week’s bullish tone intact, led by megacap tech and communications. However, the underperformance in rate-sensitive sectors and the brewing Fed and tariff headlines suggest the rally is still navigating crosscurrents. With CPI data due next week and political pressure on the Fed intensifying, the tape’s resilience will soon face a fresh macro test.
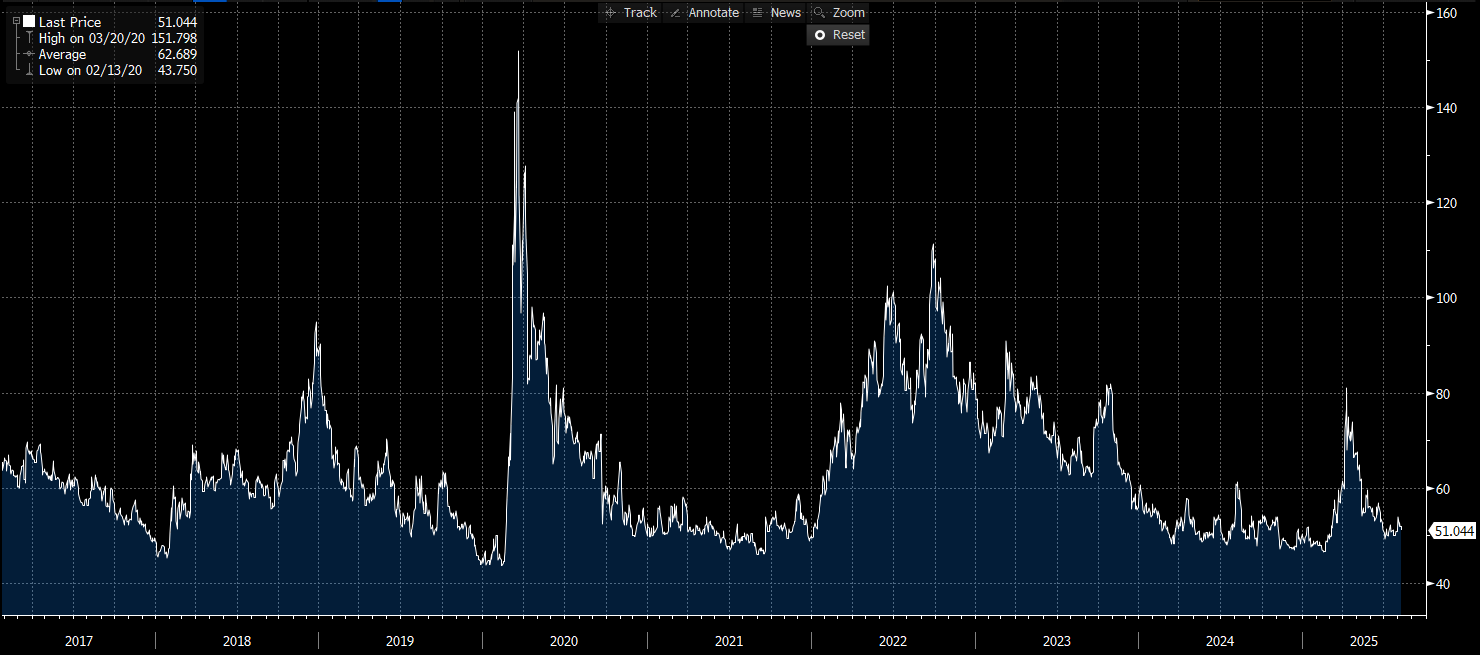
US IG Credit Wrap: Complacency Persists as Spreads Hold Near Cycle Lows
Current IG Spread: 51.04 bp
5-Year Avg: 62.69 bp • COVID High: 151.80 bp • Cycle Low: 43.75 bp
Investment grade credit is ending the week in familiar territory — hugging the bottom of the post-COVID range with spreads at 51.04 bp, well inside the 5-year average. Despite mounting political, policy, and trade uncertainty, the market remains firmly in “carry comfort” mode, showing little urgency to reprice risk.
Credit Context
< 60 bp: Duration-friendly, carry-positive zone for insurers, pensions, and liability-driven buyers.
60–70 bp: Macro noise threshold, where volatility or inflation threats prompt positioning cuts.
> 90 bp: Systemic stress unlikely unless global macro or geopolitical shocks return.
Macro Overlay: Quiet Tape, Loaded Backdrop
Fed Chair Theater Intensifies:
Stephen Miran’s temporary appointment to the Fed Board adds a likely dovish voice later this year, but the bigger market focus is on Trump’s looming choice of the next Fed Chair. Christopher Waller remains a leading contender, and the process is becoming an open political spectacle a development that could test confidence in the Fed’s independence.
Tariff Pressures Escalate:
The US–India relationship deteriorated further after Trump’s decision to impose tariffs of up to 50% on certain Indian exports, linked in part to Russian oil purchases. While equities remain buoyant, credit markets appear to be ignoring the inflationary and geopolitical spillover risks from this trade spat.
Mixed Data Pulse:
Continuing jobless claims are at their highest since late 2021, suggesting labor market softening, while CPI next week will test whether tariff passthrough is beginning to nudge goods prices higher. A September cut remains priced with ~95% probability, but the tone of Fed guidance is the wildcard.
Why Spreads Haven’t Moved
Equity volatility is subdued, Treasuries are rangebound, and real-money demand for carry remains steady. The lack of spread movement reflects inertia more than conviction a reluctance to adjust until forced by a clear macro catalyst.
The Risk Skew
A move back toward the 60–70 bp range could happen without a recession just recognition that Fed politicization, tariff risks, and softer labor data justify more than sub-52 bp pricing. The downside from here is limited, but the upside (in spread terms) could come quickly if CPI surprises or global trade tensions escalate.
Mag7 Model:
See the intro published for how to use the Mag7 models here: Link
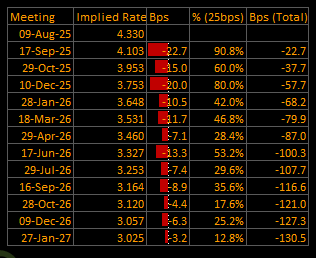
Short-End Rates Wrap: September Cut Locked, Easing Path Edges Higher
Cumulative Implied Easing (to Jan 2027): –130.5 bp
Terminal Rate (Jan 2027): 3.025%
September OIS Cut Probability: 90.8% | Implied Rate: 4.103%
The September rate cut remains all but certain, with markets pricing a 90.8% probability and 22.7 bp of easing for the meeting. Beyond September, the curve has shifted modestly, with a slightly more aggressive easing profile taking the terminal rate to 3.025% and total implied cuts through January 2027 to –130.5 bp.
The incremental steepening in the easing path suggests traders are cautiously layering in more rate cuts amid a backdrop of intensifying Fed politicization and tariff-driven macro risk.
OIS-Implied Policy Path
Macro Overlay: Politics, Tariffs, and a Softening Labor Pulse
Fed in Transition:
Stephen Miran’s temporary appointment to the Fed Board puts another dovish voice in the wings for late 2025, while the race to replace Powell in 2026 remains wide open. Waller’s standing as a front-runner keeps the market leaning toward a pro-cut Fed, but the political spectacle risks eroding policy independence.
Tariff Shockwaves:
The US–India trade rift escalates with 50% tariffs on select goods, adding another layer of potential goods-price inflation just ahead of next week’s CPI report. Broader tariffs are now fully in force, lifting the average US tariff rate to 15.2%, the highest since WWII.
Labor and Inflation Crosscurrents:
Continuing claims remain elevated, pointing to gradual labor market cooling. At the same time, services price pressures persist — a combination that fuels uncertainty about how quickly the Fed can ease without reigniting inflation.
From Scripted to Conditional
The rate path retains a clear easing bias, but its execution now hinges on:
Tariff passthrough — whether goods inflation pops in the months ahead.
Fed leadership tone — how new and potential appointees frame the balance between growth support and inflation control.
Labor market resilience — whether cooling stops short of recessionary territory.
For now, September is locked in. But the glide path to a 3% terminal rate could steepen quickly if CPI surprises higher
Tactical Portfolio
Keep reading with a 7-day free trial
Subscribe to Capital Flows to keep reading this post and get 7 days of free access to the full post archives.