

Macro Report: The Contagion Effect: Volatility’s Hidden Path Through the Economy
Why Balance Sheet Fragility Turns Market Swings Into Economic Pain

Macro Report: The Contagion Effect: Volatility’s Hidden Path Through the Economy
MAIN IDEA:
Volatility shocks from growth, inflation, or liquidity do not act directly on the economy. They are filtered, absorbed, or amplified through balance sheets and capital structures. These are the transmission mechanisms that determine whether volatility is dampened into resilience or magnified into fragility. The economy is a constantly evolving system of firms, households, and investors, each adjusting strategies in real time to the shifting stresses that flow through their financial positions. Every adjustment reshapes the environment, feeding back into the system and altering its structural capacity to bear future shocks. In periods of calm, leverage and mismatches quietly accumulate, increasing sensitivity to disruption. In periods of stress, weaknesses are exposed, and robustness is either rebuilt or eroded further. The path of volatility, therefore, is not linear. It is defined by how capital structures evolve to carry the weight of repeated shocks, setting the stage for both resilience and instability.
How do these ideas directly connect to the macro regime we are seeing today?
Today the imbalance is forming as the Federal Reserve cuts into a backdrop of resilient growth and elevated inflation risk. Balance sheets are not being forced into repair but instead are leaning into the relief of falling short end real rates. Capital is systematically moving out the risk curve, chasing nominal activity that still runs above the cost of financing. Elevated inflation expectations combine with cycle-low credit spreads and suppressed cross-asset volatility to create an environment where it appears rational to lock in credit and extend leverage. This dynamic strengthens risk-taking in the short term, but it also embeds fragility into capital structures, as financing conditions remain looser than the underlying inflation and growth profile would warrant.
How can we know for sure this is EXACTLY what is taking place right now?
1y and 2y real rates have fell considerably during the contraction of Q2 in the GDPnowcast. Since growth has rebounded, real rates on the short end have only moved lower as growth moved up and remains elevated. In simple terms, the Fed is being very accommodative as growth remains resilient.
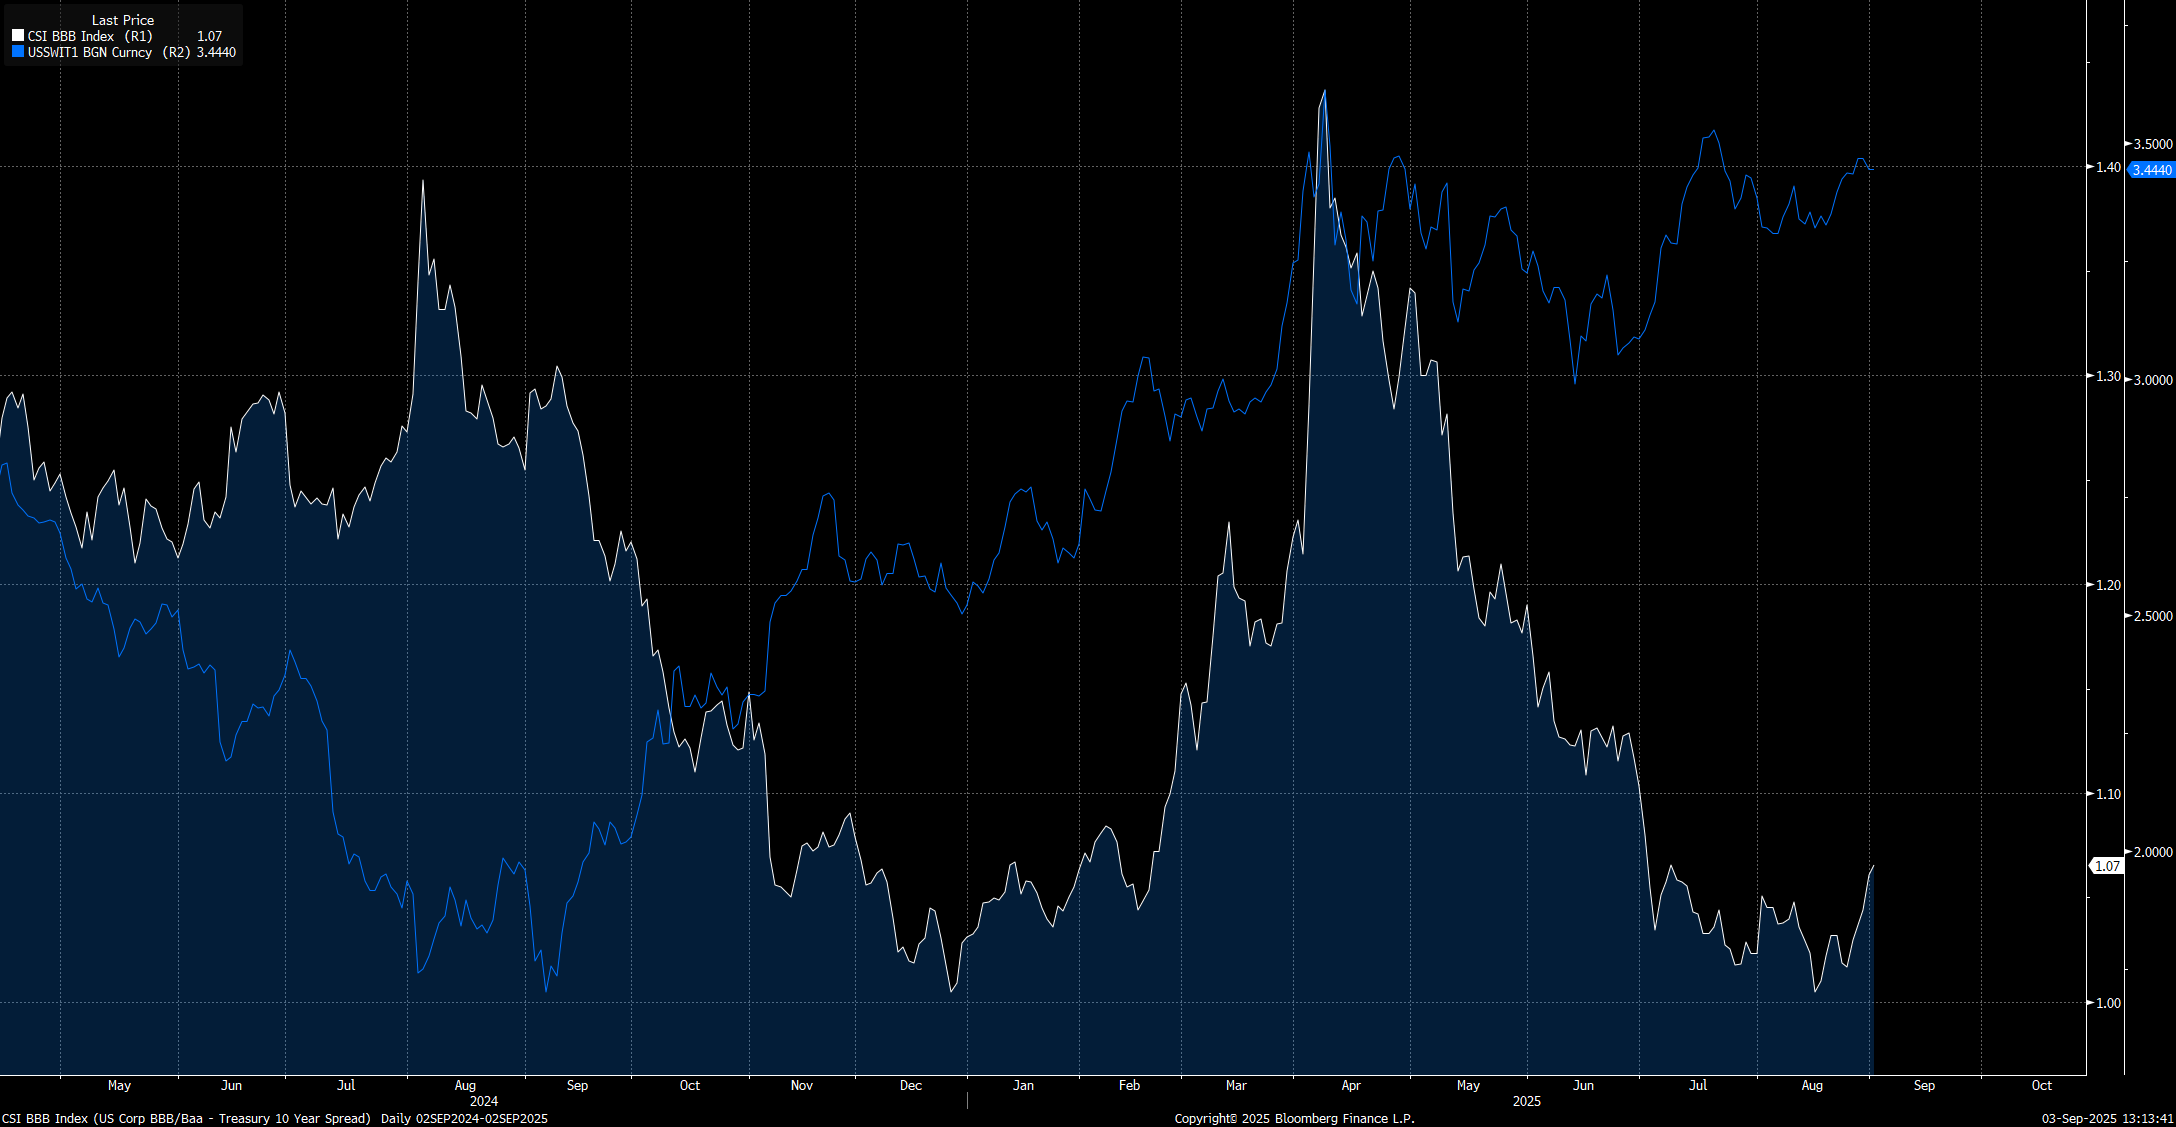
This is exactly WHY we have seen a significant gap occur in 1 year inflation swaps in credit spreads. Credit spreads are low, reflecting accommodative financial conditions, and 1-year inflation swaps remain elevated, reflecting higher inflation risk. This is WHY I keep saying inflation risk is greater than recession risk.
This is directly tied to the 10s30s curve bear steepening at the same time the Russell has been rallying.
A technical breakdown of the Russell and the Yield Curve (the yield curve model and interest rate trading primer can be found in here: LINK):
This dynamic is showing up clearly in the bear steepening and steepener-twisting of the 10s30s curve at the same time the Russell 2000 has been rallying. As short end real rates fall with Fed cuts, capital is being pushed out the risk curve, and long-end yields are adjusting higher to reflect the inflation and financing risks embedded in that move. The steepening of the long end is a direct expression of how balance sheets and capital structures are leaning into lower front-end costs, extending credit and leverage while risk premiums remain compressed. Small caps, which are highly sensitive to financing conditions AND cyclical growth conditions, have responded with outsized gains, but this rally is taking place against the backdrop of a curve that is flashing the pressure of elevated inflation expectations and the systemic demand for credit. What looks like resilience in equities is, in part the byproduct of capital structures absorbing volatility in a way that shifts fragility further into the future.
All of this is building an impulse that is fueling the credit cycle to the upside, reinforcing the bid for risk assets and keeping us bullish on equities for now. Yet the very mechanics that are driving this strength are also laying the groundwork for imbalance, as capital structures expand leverage under conditions where financing costs are artificially low relative to nominal activity. This trajectory is not sustainable without volatility eventually breaking through, either in the form of renewed inflation pressures or a contraction of liquidity as real returns embedded in the currency, and by extension in USD denominated assets, decrease. This is why having a correct understanding of the signals and drivers is becoming more critical as the imbalance grows wider. It is not just about following price action, but about recognizing how the transmission of volatility through balance sheets and capital structures determines whether today’s bullish impulse can persist or whether it will flip into systemic fragility.
This is what I am going to cover below.
Educational Synthesis Update:
Before we jump into the macro regime, I wanted to let you know that I updated the educational primer section so that it has all of the PDF playbooks I have written, all the book recommendations, and the Tradingview scripts for Bitcoin/the yield curve in one place.
![[FREE] Educational Primers On Every Aspect Of Macro & Markets](https://substackcdn.com/image/fetch/$s_!tfas!,w_140,h_140,c_fill,f_webp,q_auto:good,fl_progressive:steep,g_auto/https%3A%2F%2Fsubstack-post-media.s3.amazonaws.com%2Fpublic%2Fimages%2F69c49472-3d63-47f0-9b8c-2a682fa625f1_1024x1024.jpeg)
The most recent inflation playbook and connected video is going to be critical to understand for the ideas we dig into below.

The Boom and Bust:
I already laid out how macro liquidity is GLOBAL in its nature, and one of the largest risks that market participants underestimate is crossboarder liquidity. As everyone focuses on the Fed, cross-border liquidity is growing in importance because it is underestimated.

Keep reading with a 7-day free trial
Subscribe to Capital Flows to keep reading this post and get 7 days of free access to the full post archives.