

Research HUB: Infinite Complexity, Chaos and the S&P500
Adaptation is the only way to thrive in complexity

The way in which you contextualize your actions dramatically changes your ability to have foresight.
What does this mean? Every day, when I turn on my computer to look at market prices, I don't simply think of the patterns that I need to interpret. It's so much bigger than that. The prices are a reflection of intertemporal actions by market participants. Most people focus on the patterns, which are obviously important, but what is more important are the individuals on the other side of those prices
When I think about the world, I think about it with this type of complexity:

The world is infinitely complex and chaotic. It is impossible to harness this complexity and chaos. The only way to survive is through relentless adaptation. This is easy to say but difficult to achieve.
What is the first step? You must have the ability to focus and move in the right direction. This sounds obvious, but it is actually quite difficult since there are so many distractions and false signals. As a system grows in complexity, the signal-to-noise ratio drops dramatically.
Part of my goal is to help you contextualize things and focus on the correct variables amidst the chaos of markets and life. We've all been in a place where we are incredibly confused about life, and that one friend sets us straight by reminding us of the big picture. This is why the people and environment you are in are so critical to your success.
There have been times in my life when I was so confused that if a mentor or friend didn't help me remember the big picture, I would probably still be wandering. Don't discount these instrumental moments of time.
Quantifying without being reductionistic:
We know the world is complex with excessive noise, which means any domain we approach, our first goal should be getting a clear signal of what is occurring. Without a clear signal, it is impossible to know HOW we should adapt.
How do we identify and interpret these signals? It is literally through trial and error. However, when going through the trial and error process, you always want to have clear quantification of your signals which allows you to have clear quantification of your views.
Any time I think about this trial and error process, I think about the mad scientist in his laboratory who is constantly testing the absurdity in his own mind.

I will say this: some of the smartest traders I know look like the crazy guy in the picture above. Never discount the crazy, weird guy in the corner tinkering.
So, what does this quantification of complexity pragmatically look like? Let's dig into the S&P 500 and begin to identify the signals.
S&P 500 Model:
The first thing you need to remember is that the S&P 500 is the most competitive and difficult market in the entire world. The smartest people in the world come in every day, performing at their best to take as much money as possible from you. The S&P 500 is much more complex than a momentum or moving average model.
Let’s take these things one at a time:
Top Down: Growth, Inflation, and Liquidity
Bottom Up: Fundamentals
Quantitative Signals
Top Down: Growth, Inflation, and Liquidity:
Let’s start with the top-down framework:
At all times, you want to know the growth, inflation, and liquidity (GIP) regime you are in. The expected returns for any asset vary through various GIP regimes. What you need to do is correctly quantify all the macro data points for GIP and correctly determine which ones account for any asset’s movement.
Let me provide a couple of examples: The book, The Long Good Buy has a very rough approximation of this dynamic using the ISM and CPI:

A much more comprehensive and higher-quality example is some of the research from Prometheus Research:
You will notice different equity sectors have different expected returns depending on the GIP regime. Watching relative sector returns in connection with economic data is critical when connecting price action to the macro backdrop.

Big picture though, you need to know how GIP functions across all major data points and then connect it to the S&P 500. Here are some other great charts by Prometheus breaking down the attribution analysis (link).


The main idea is that every sector's earnings and valuation is a signal that you need to connect to the macro backdrop. The earnings component is going to be connected to growth and inflation. The valuation component is connected to liquidity. Every asset exists on a risk spectrum, so analyzing both the earnings and valuation in connection with every other asset is key.
Economic Data:
Big picture though, you need to do two primary things with this macro data:
Monitor all macro data points across multiple durations. This means watching YoY, 3-month trend, and MoM.
Monitor if the data points come out above or below expectations AND how the market prices it in.
Here is an example of the economic surprise index with SPX rolling returns:

Here is the inflation surprise index with CPI:
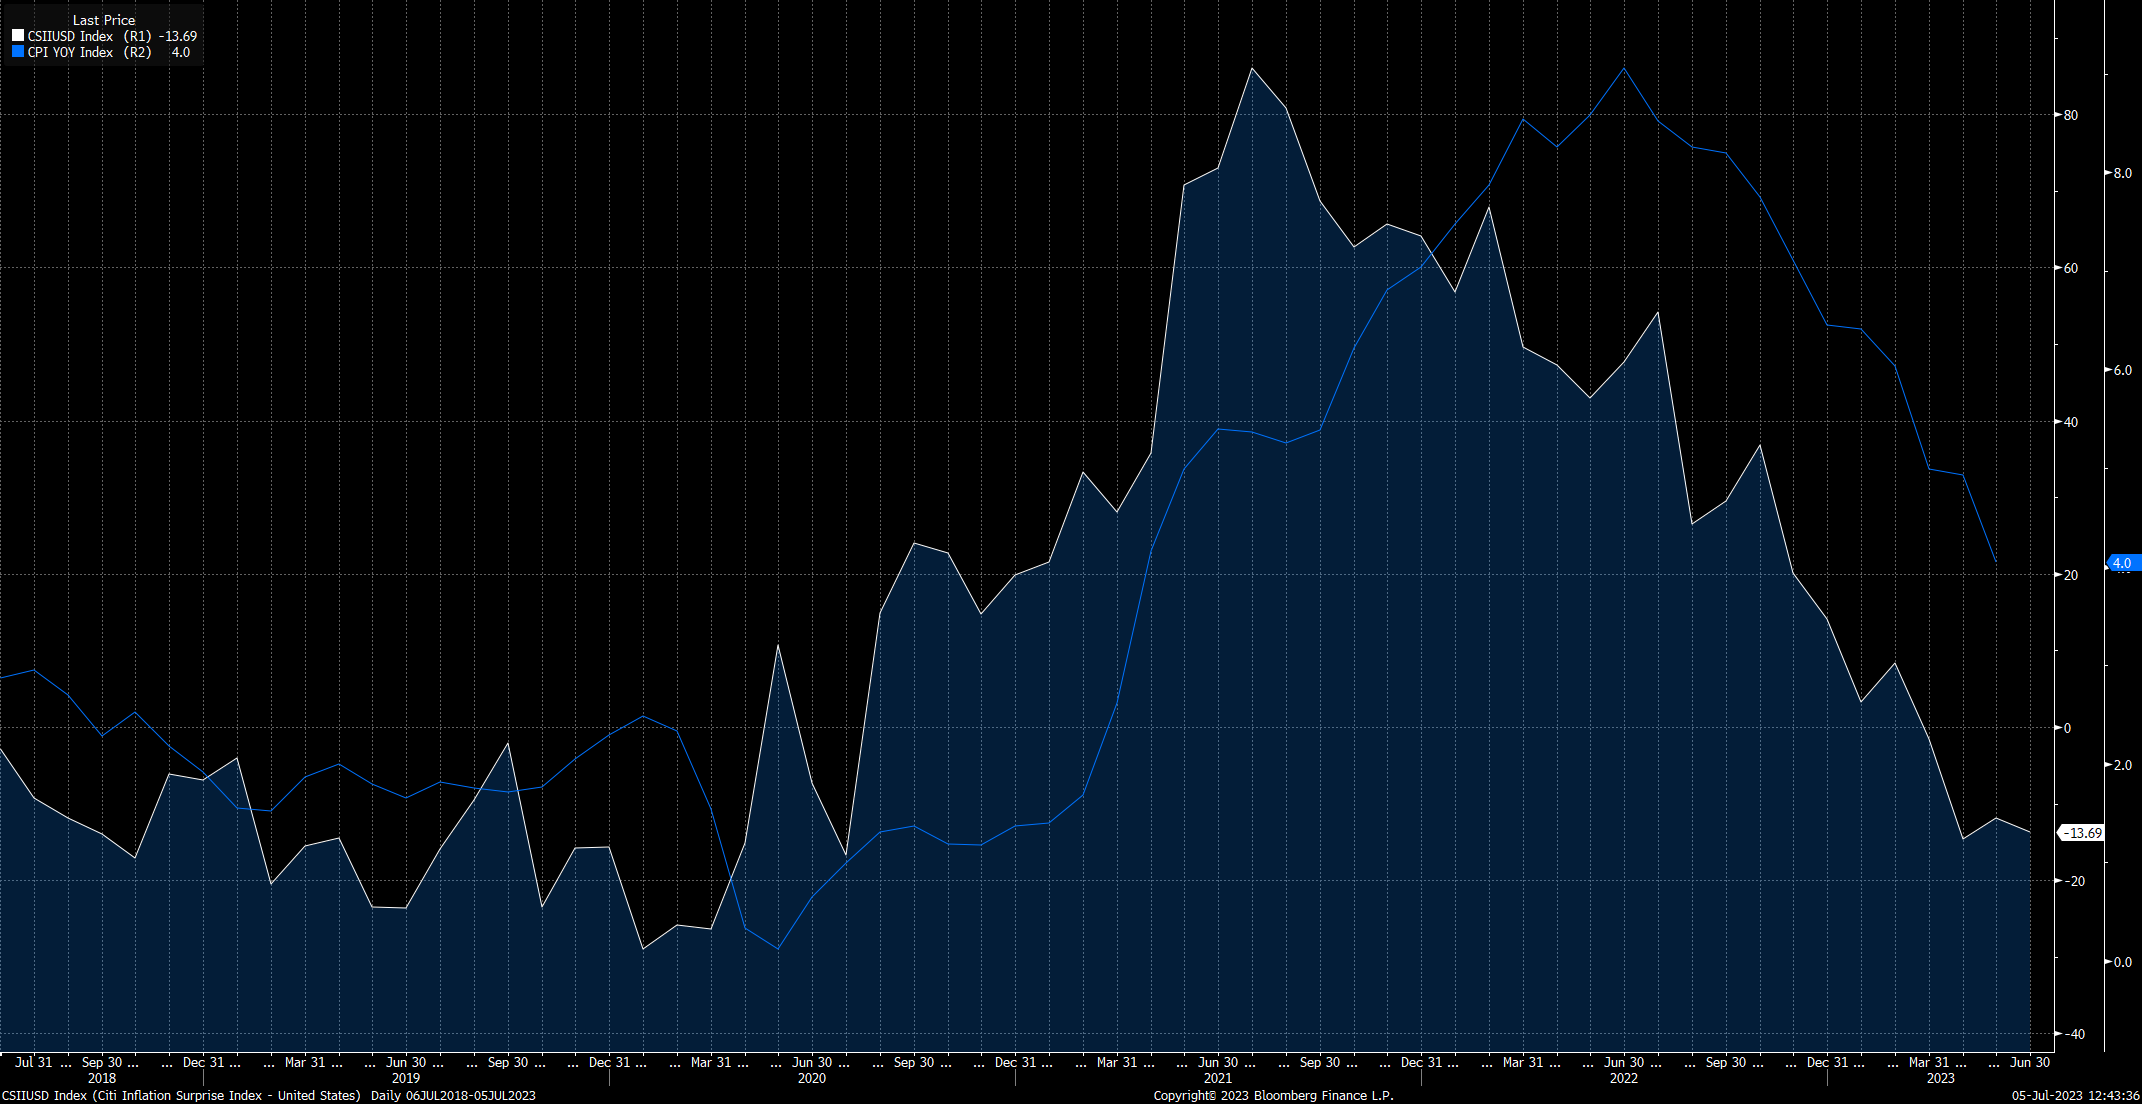
If you have a really good understanding of the economic mechanics of the system, then you will have a much better understanding of WHY economic data comes out above or below expectations and the implications for assets. All of the data releases can be found for free on the CME tool: https://www.cmegroup.com/tools-information/quikstrike/treasury-watch.html
One final thought: you need to monitor how price action responds to the data as it comes out below or above expectations. For example, we recently had an ISM print where the prices portion came in below expectations. After the initial spike, bonds sold off. This is a clear signal that even when an inflation-type print (ISM prices) comes in below expectations, bonds can't rally. That tells me we are likely moving lower.

People always ask me in Twitter Spaces or DMs about how to quantify positioning. It's in the price! When I talk about positioning, it is in how I am interpreting the price, the correlations, and the movements of the market as information moves along the spectrum from uncertainty to certainty. When I think about positioning, it has to be reflected in instruments that have dollars behind them, such as the underlying contracts or options. "Sentiment gauges" or COT data are nice, but they don't necessarily represent direct dollars betting on specific assets.
Bottom Up: Fundamentals
The entire idea of having BOTH top-down and bottom-up signals is to correctly explain price action. In practice, you should always know WHY returns are occurring even if you are having difficulty predicting them.
Let's start with a very basic idea: Here is SPX (white), SPX EPS yield and earnings expectations yield (blue and orange), and finally, the 10-year yield (purple):

This helps contextualize SPX in its relation to the 10-year. The correlation between stocks and bonds changes depending on the GIP regime we are in.
This is where you can begin to connect the top-down information with the bottom-up information. Here is SPX (blue), the economic surprise index (orange), and earnings surprises (white). It's pretty intuitive that earnings move more or less with economic data:
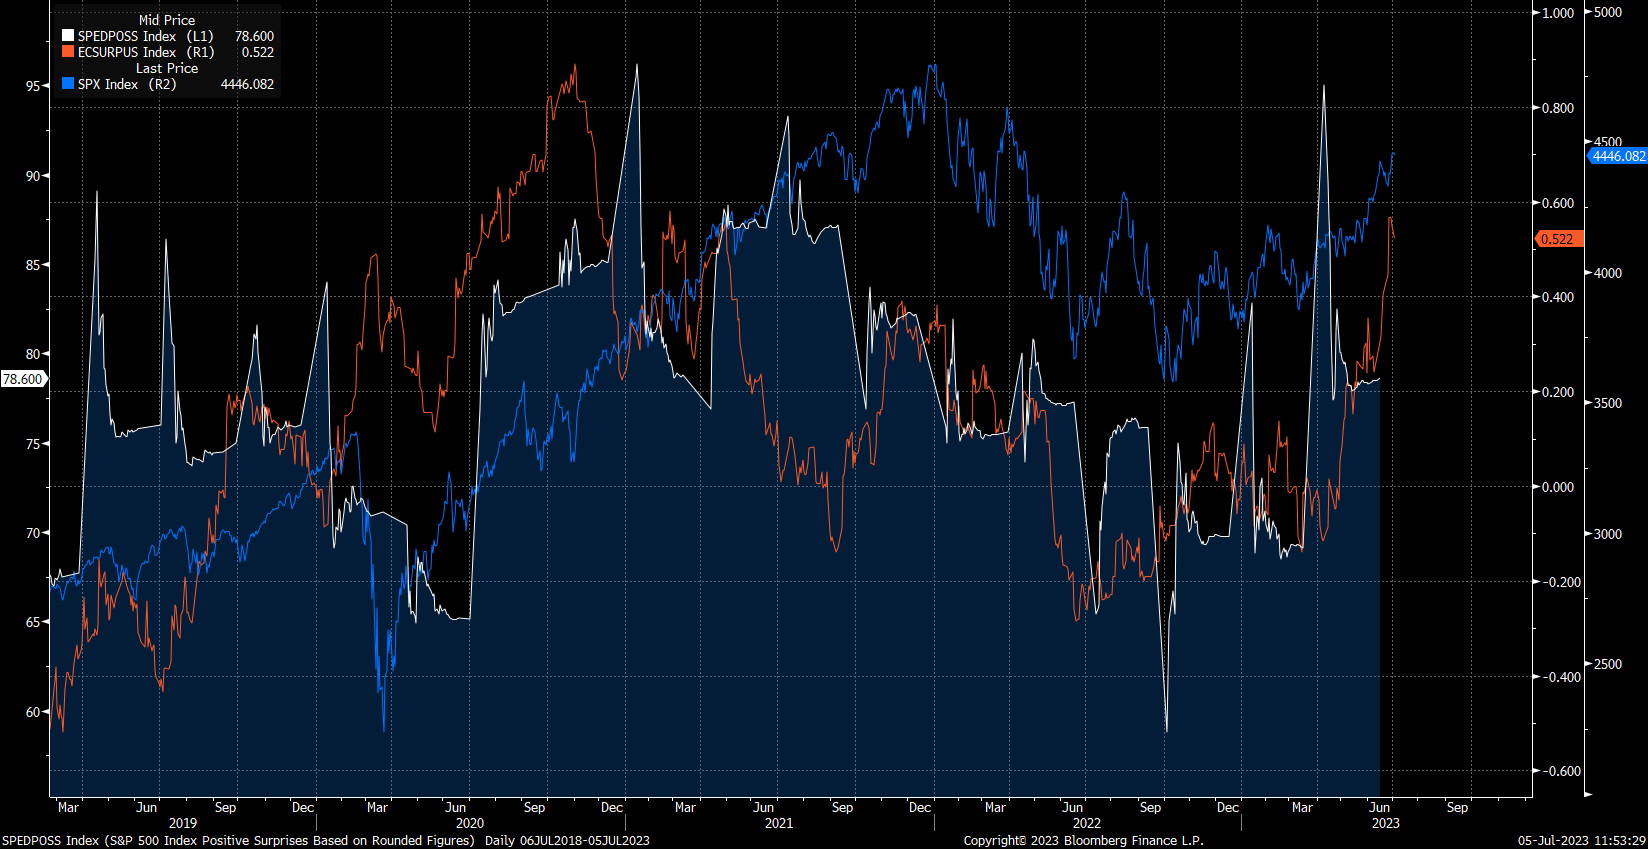
Similar to watching economic data get priced into the market, you want to watch earnings get priced into the market.
You want to watch this across all sectors, compare it with each sector's relative performance and then compare all of that with the macro backdrop. The other thing that is really helpful is contextualizing earnings calls and speeches by CEOs. When there are announcements on earnings calls describing the company's performance, this helps to fill in the picture with more color.

A simple example is comparing the materials/tech ratio to CPI. While you don't want to build an entire strategy based on this ratio, it's a signal. Relative relationships send just as much of a signal as absolute directional moves.

The other thing you need to monitor is factor performance. There is a lot of great work done on factor investing which is incredibly valuable. You can read the 'Allocators Edge', 'Strategic Risk Management', or the MorningStar website has some good resources on equity factors.
Here is an example of some basic factor indices: value vs growth (orange), high dividend vs low dividend (yellow), and quality vs junk (blue):

There are many other factors that are important to watch, especially for positioning. For example, watching stocks with high short interest can tell you if a move is driven by a fundamental bid or a short squeeze.

Big picture, specific factors exhibit specific return profiles depending on the macro regime. You simply need to connect the factors with the macro regime. A lot of this comes down to understanding fixed income as well, which I wrote an entire article on.
The Research HUB: The Bond Market

Hello everyone, Many subscribers have been asking for a primer on how the bond market works. In this article, I'm going to provide a breakdown with a TON of resources. My goal is to keep things clear and simple, avoiding any complex math. After reading this article, you'll see that understanding the bond market is essential for understanding macroeconomi…
Now, how do we connect these underlying signals with the index and price? Well, to begin with, you need to recognize that not all of these earnings and factors are distributed evenly. Remember, we are dealing with an index.
Here is a breakdown of the weightings of each sector in the S&P 500. You can see that tech is the primary weighting:

Additionally, we know that the index has incredibly high weightings to very specific companies:
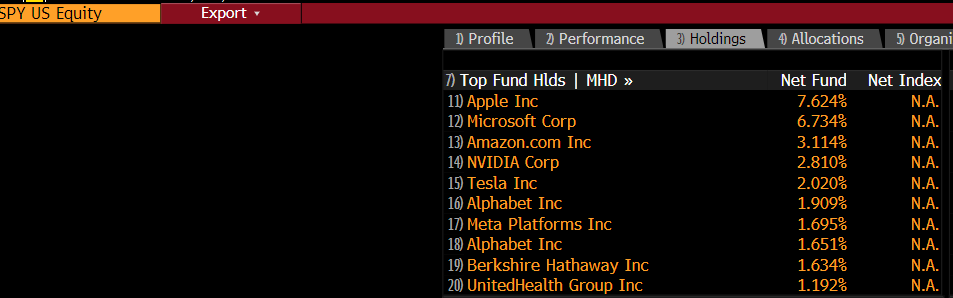
The index construction always needs to be taken into account.
Pulling things together:
After you have a reasonable process for monitoring the top-down and bottom-up dynamics of the S&P 500, you can then create signals that are turned into regimes. Ultimately, you want to create signals, backtest those signals, turn the backtested signals into regimes, and then backtest the regime.
After you have these regimes set up and have synthesized your analysis into specific trade ideas, you can then transition to the quantitative signals.
Quantitative Signals:
As we transition to specific quantitative signals that are directly connected to price and capital flows, you need to remember that all of your quantitative models need to connect with your fundamental models. A lot of times I hear people say, “The fundamentals say X but the price is not following fundamentals.” The presuppositions behind this statement are wrong on multiple levels, but any time something isn’t working according to your thesis, it's the thesis that needs to be revised. Remember, we are here to adapt to the environment, not dictate it.
Let’s go through a number of items:
Breadth: The concept of breadth simply shows us the pure distribution of price action. There are two ways that I monitor this.
First is the percentage of stocks above moving averages. You can see all the timeframes below:

You use these based on the timeframe you trade. If you are trading a longer-term time horizon, then maybe you use the longer-term breadth indicator as a signal and then the shorter-term one as an execution signal.
You can find all of these on Tradingview:

And you can begin to connect this with bigger picture macro data points:

The second way I monitor breadth is by the percentage of members making highs or lows on different timeframes:

You can also find these in Tradingview:

Breadth isn't some magic indicator. Everyone watches it. Breadth doesn't necessarily lead the index because the index isn't weighted equally. For example, breadth can be low because the majority of stocks are falling, but the index can rise if the largest weighting stocks are rallying. Some people will say this is “wrong” or “shouldn't happen.” If that is the case, just go trade the equal weight index. Everyone in the market trades the S&P 500 because they know the weightings.
Indexation Effect:
Expanding on this idea of breadth, you need to monitor the indexation effect of the index. This simply means paying closer attention to the largest weightings since they have more causal force on the index.
There are several simple ways to do this. First, monitor the price of the FANGs and their implied vol:

Watch the SPY/RSP ratio in connection with breadth. When SPY underperforms RSP AND breadth is falling, we can have a lot more downside in SPX:

Since tech is the largest sector weighting in the index, watch the XLK/SPY ratio as well:

If you want a great tool for this indexation effect, I would suggest Tier1 Alpha.
Their MBAD indicator can be incredibly helpful if you are trying to trade these effects. I would also suggest subscribing to their newsletter. The team over there is putting out some amazing content!

Now to the fun stuff!
Options, Volatility, Correlation, Dispersion:
Let me lay out a couple of resources on this and then I will provide some broad thoughts:
First, you should read these papers:
https://cdn.cboe.com/resources/indices/documents/Cboe_USO_ImpliedCorrelation_0421_v2.0.2.pdf
https://cdn.cboe.com/resources/indices/documents/Implied_Correlation-WhitePaper.pdf
You can find all of the correlation indices on Tradingview:

Second, I did a series of educational articles with A TON of resources on volatility. link
Third, if you are super new to options, I would suggest this book as an intro: link
Fourth, this is a good intro to basic vol concepts: Link
Fifth, in terms of education, I would suggest people continue following Yes, I give a FIG... thoughts on markets from Michael Green/Profplum99 and Teir1Alpha. They are always providing great education on passive flows, indexation, gamma flows, and the overall options market.

For the S&P500, you need to map the volatility across every time duration and strike to know what is happening.
For example, Subtracting the 3rd VIX contract from the VIX spot:
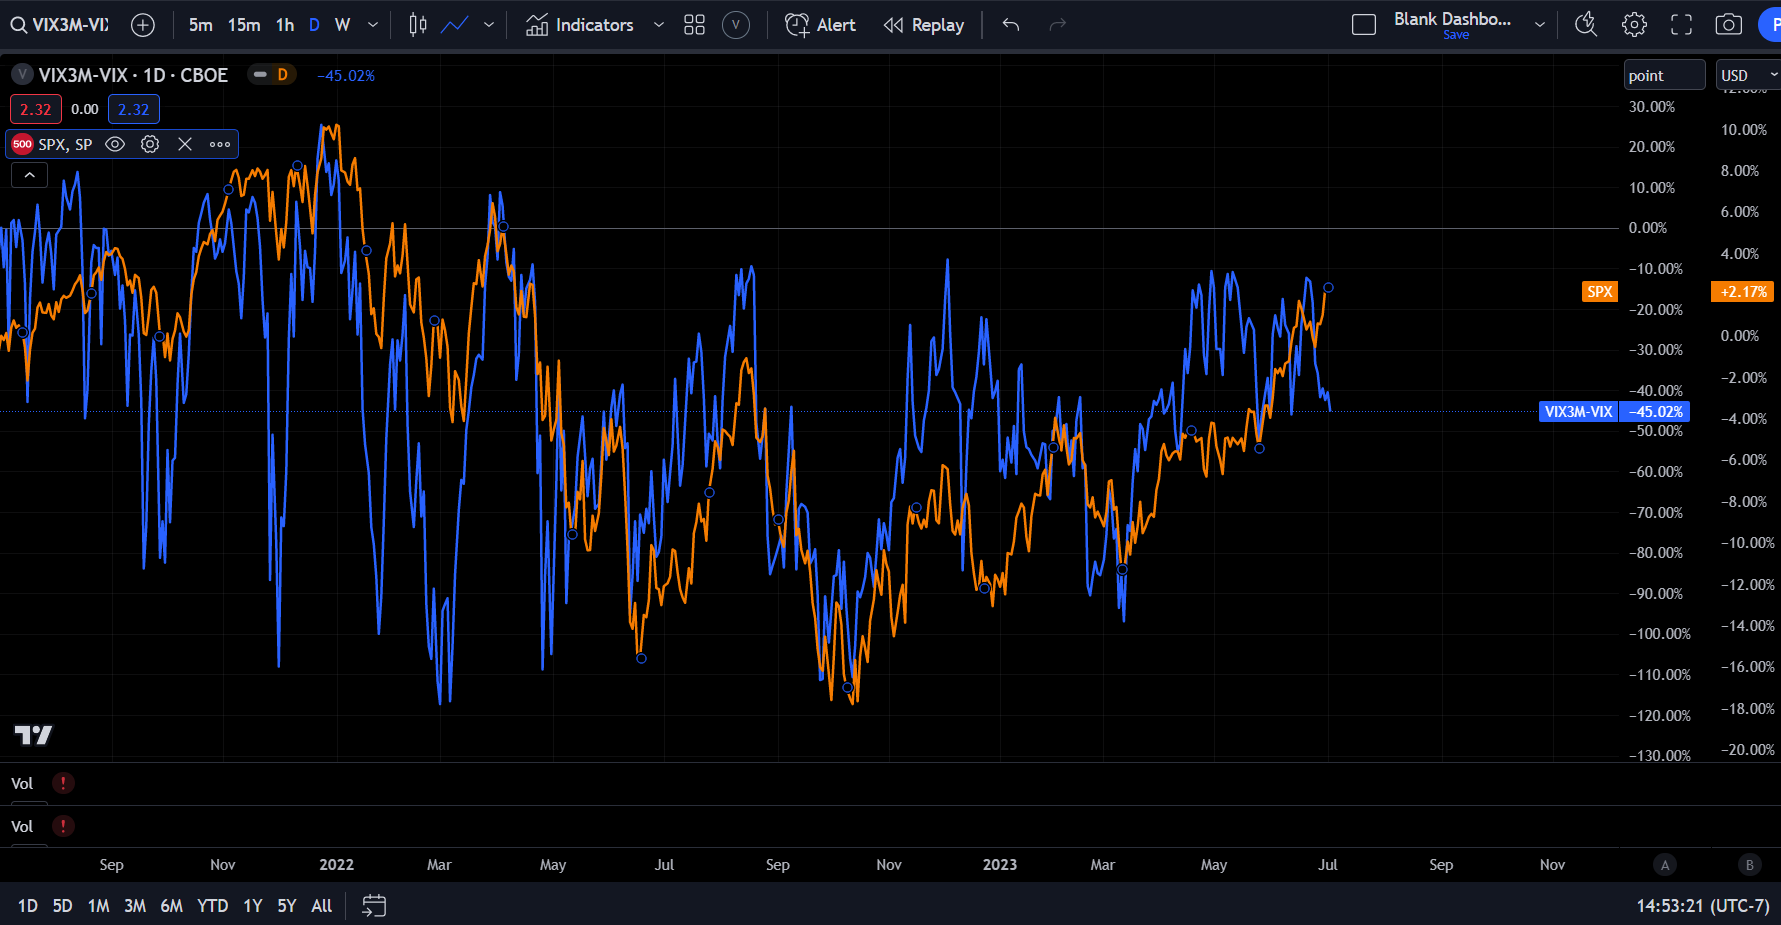
At all times I am monitoring and have models running on each of these inputs:

Some technical definitions:
Implied Volatility: Implied Volatility (IV) is a metric that captures the market's expectations of a future stock price's changes. It is a critical component of options pricing models, reflecting the market's view of the likelihood of changes in a security's price. Higher implied volatility indicates that larger price swings are expected in the future.
Implied vs Realized Volatility: Implied volatility is the market's forecast of expected volatility, derived from options prices. Realized volatility, on the other hand, measures the past fluctuations of a security's price over a given period. It's a retrospective measure, calculated based on actual price changes, while implied volatility is a forward-looking, predictive measure.
Skew: In finance, skew refers to skewness in the implied volatility of options prices across different strike prices. The skew can provide insight into market sentiment about potential downside risk. If out-of-the-money puts (options to sell at a future date) are more expensive than out-of-the-money calls (options to buy at a future date), it indicates a 'negative skew', reflecting a higher perceived risk of large downside price moves.
Term Structure: Term structure, in the context of volatility, describes the curve formed by plotting the implied volatility of options across various expiration dates. It gives insight into the market's expectations of future volatility over different time horizons. Typically, term structures can be upward sloping (normal), downward sloping (inverted), or hump-shaped.
Implied Correlation: Implied correlation is a measure of the expected average correlation of an index's components. It is inferred from the prices of index options and the prices of options on the index's individual components. High implied correlation suggests that the components are expected to move together more strongly in the future.
Implied vs Realized Correlation: Implied correlation is a forward-looking measure, derived from options prices, that anticipates the average correlation of an index's components. Realized correlation, however, is a historical measure of how closely the components of an index have moved together in the past. It is calculated based on historical price changes of the index's components.
Convex Value Terminal:
One of the best tools in the world for options flows is the Convex Value Terminal. Their Twitter: link
Here are open interest levels in SPX. If you compare these levels to other levels such as daily, weekly and monthly closes OR levels where information got priced in, it can provide some edge.

A lot of the time, I will aggregate open interest levels and compare them with the vol signals I'm seeing, and it helps me define my risk-reward with more clarity:

Here's the thing with each of these data points: you simply need to quantify them, turn them into signals, backtest those signals, turn those backtested signals into regimes, and then backtest those regimes for whatever decisions you want to make.
The thing about the options market that I like is that it makes explicit what is implicit: the necessity for market timing. If you don't implement market timing in your strategy, you will blow up.
Chaos, time, and complexity all go hand in hand:

Momentum and Mean Reversion:
After quantifying the various volatility inputs noted above, we need to move to raw price action. This is what brings us to momentum and mean reversion.
Momentum: there are some great intro papers on this:
AQR: https://www.aqr.com/Insights/Datasets/Value-and-Momentum-Everywhere-Factors-Monthly
'Strategic Risk Management' has great sections on optimal lookbacks for calculating momentum.
The basic idea of momentum is that positive or negative returns in a specific direction with a specific deviation have predictability for future returns. For example, buying assets at 52-week highs and shorting assets at 52-week lows.
Here is the problem though, no one truly knows what a trend is. There is no definition of one. Everyone will have their special lookbacks they use but in reality, there is no special definition of a trend.
Mean reversion is, in a sense, the opposite of momentum. Mean reversion (also sometimes called “reversal”) assumes that the price converges back to its mean. The main idea behind these concepts is that price is either trending in a direction or mean reverting.
How does this connect with the S&P 500? Well, SPX exhibits a high degree of mean reversion. This is why SPX chops so much and there are so many opportunities to buy dips or short rips. What you want to do is quantify BOTH for any asset and then make decisions based on your goals.
If you are really new to this, I would suggest going through the TradingView indicator section. I would also suggest reading some SSRN papers on it, which are always incredibly helpful.

If you want a little bit of a head start, here is what you should do: Use the VIX model you build to identify VIX imbalances and VIX regimes. Then overlay it with a smoothed/normalized slope model to identify inflection points.
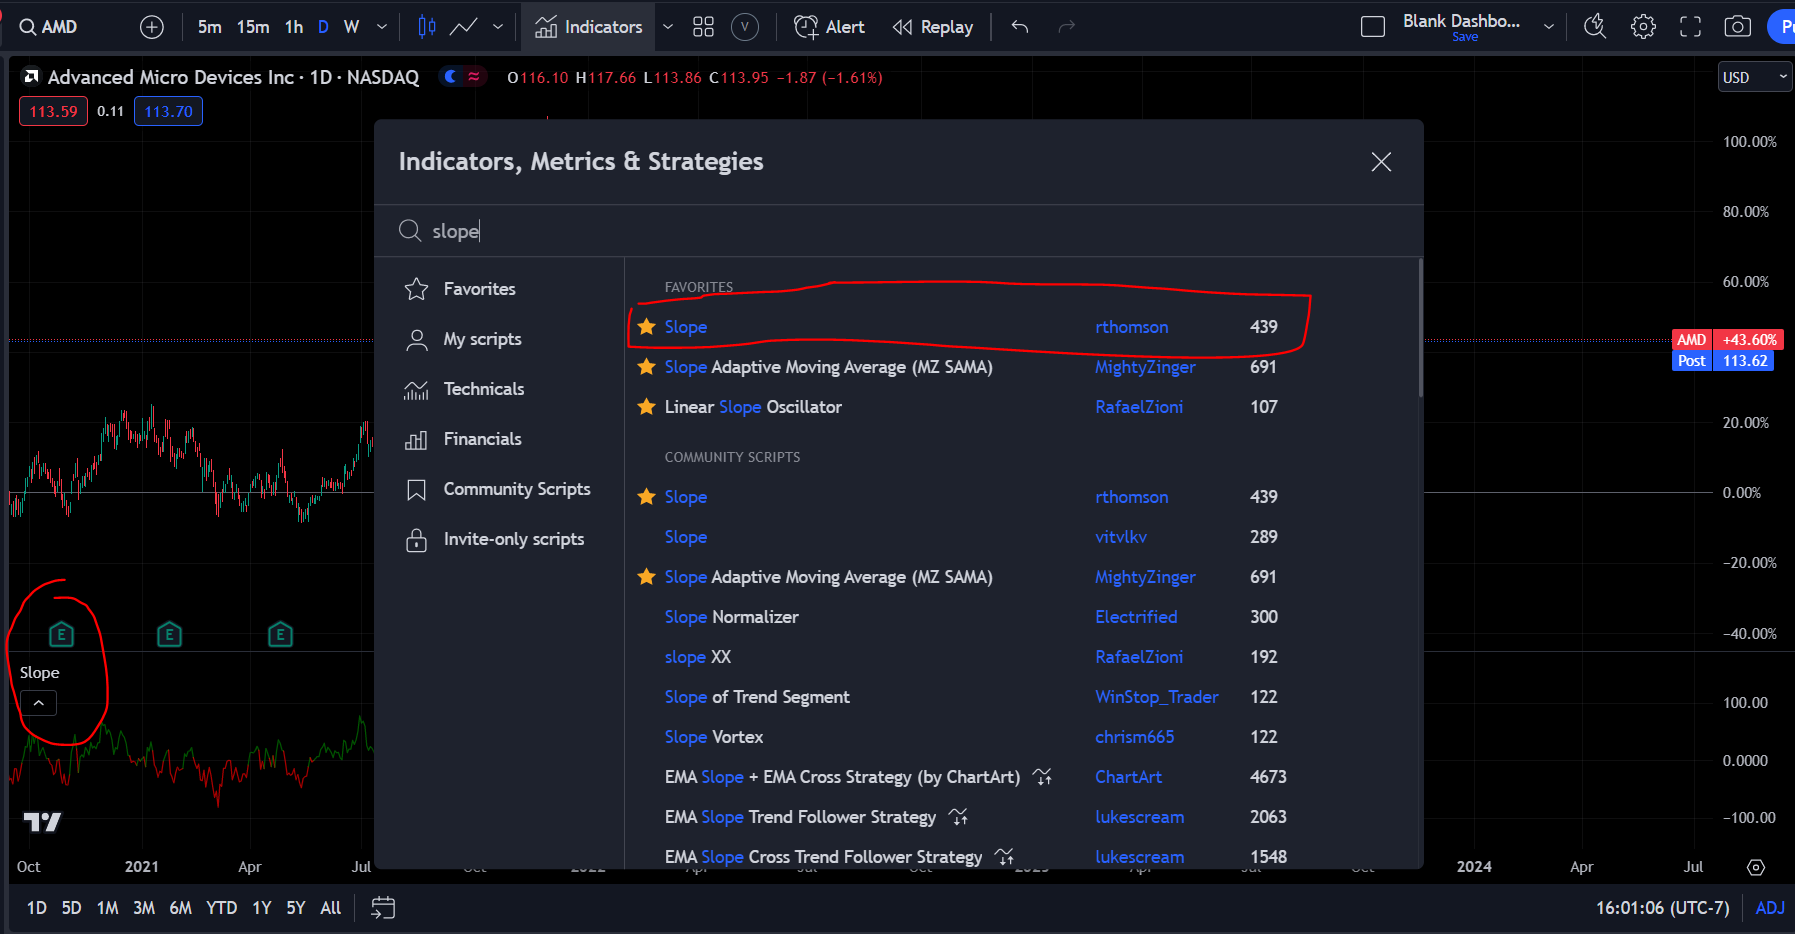
You can use this to find short-term inflection points in SPX. Then, if you use it in confluence with a momentum model, you can further refine your execution. There is a lot more refinement that actually needs to be done, but if you work hard reading the resources I provided above, you will probably be able to figure it out. (To be clear, this is barely scratching the surface!)
Intraday, Globex and Order Imbalance:
Now we come to the intraday characteristics of SPX.
First, go back and read the paper I did on the microstructure of the market: Link
Second, read this paper: https://papers.ssrn.com/sol3/papers.cfm?abstract_id=3760365
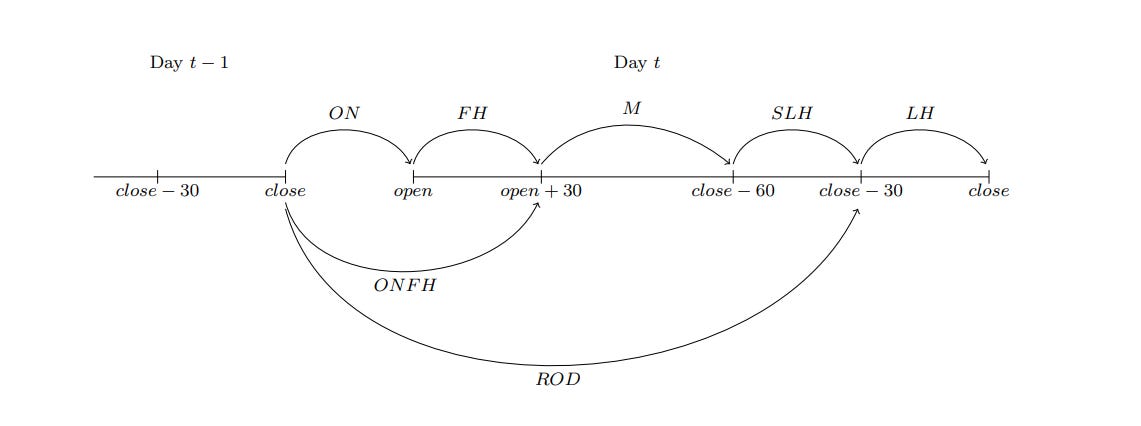
What you want to do is divide the trading session into multiple periods of time and analyze the price action and volume through each period of time:
What you will begin to recognize is how liquidity is facilitated on an intraday basis. A great book on this is 'Trades, Quotes, and Prices' (link). Most people who trade intraday don’t actually understand WHY they are extracting returns because all they know is patterns. Intraday liquidity provision can drastically change depending on the momentum or mean reversion regime you are in.
Identifying these characteristics through different market regimes is how you can have continuity from the macro all the way down to the intraday price action.
Pulling The Pieces Together:
I know we covered a lot but I am not even scratching the surface. There are tons of qualifications, idiosyncrasies, and depths I was not able to cover. Just know you can spend years reading, learning, and building models around each of the topics I noted above.
Basically, everything I noted above is free or very cheap.
You can subscribe to the Standard and Poor's Dashboards that provide automated PDFs of the factors and volatility metrics: https://www.spglobal.com/spdji/en/research-insights/performance-reports/
The CME tool is still incredibly helpful! https://www.cmegroup.com/tools-information/quikstrike/treasury-watch.html
Convex Value does have a monthly fee but it is well worth it in my opinion: https://twitter.com/ConvexValue
Big idea: All of the ideas I provided above should connect. Your top-down and bottom-up views should provide you with the context for taking directional trades. The quantitative models should directly connect with the fundamental view and provide optimal points for execution. Risk management is intended to minimize the impact of errors in BOTH your own ignorance and the uncertainty of the future.
Conclusion: This is just the beginning
If you have an in-depth knowledge of all the components I noted above and have models up and running on all of them, congratulations, you can now sign up for the race. We haven’t even gotten to the starting line yet.
The real value is in being able to synthesize all of these moving parts in real-time with trade execution and risk management. This is my entire goal in writing articles. I am synthesizing all of these moving parts in real time for subscribers. I will be writing another article synthesizing these variables with trades on ES for Subscribers.
We first build the foundation and then extract exceptional returns from the market. It takes time, patience, and discipline, but the reward is unparalleled. Keep building! It only gets more complex from here!

Thanks for reading!
Sooner or later I will be profitable. Thanks to you.
This is a lot of variables to consider when analyzing the markets. But it's great for me because I need a back end, mechanical understanding of what drives markets and what provides clear a signal. Otherwise, I don't have the necessary conviction to take long term trades (my weakness). So because of this lack of understanding, I usually day traded.
While I've obviously been proven wrong (just look at the past 7 years for spy) I never liked the idea of holding onto something and then 3 years later the price is back to where I started or worse. So If I can understand the under the hood behind markets and why they grow, I can have confidence to hold my swing trades and investments for bigger gains unlike day trading. So far this has been great so thank you. I have come too far to quit now.