The Research HUB: How does economic data get priced into the market?
What economists miss in markets!
Hey everyone,
I Tweeted this recently and there were some people asking for an explanation of the concept:
Big picture ideas I will cover in this article:
Economic Data Time Lags
The market is Forward-Looking and Adjusts Expectations
Expectations vs Actual Matrix
Market Pricing Response
Intro:
Let’s first start on a conceptual note that exists beyond the realm of financial markets.
When you approach a complex system where the amount of noise is high, you need signals that have DIFFERENT sources. For example, if you are only using price action as a signal, there will be limitations to the amount of signals you can extract from it without having overlapping signals.
This is intuitive to all of us. Just think about it like this, if you go out on a date with someone, you aren’t just taking cues from how they are dressed but also their facial expressions, their mental disposition, and how they might respond to situations. All of these things are connected but different sources of signals.
Imagine if I believed everything was completely fine between myself and my significant other as long as they weren’t wearing red? Well I mean, maybe my significant other always wears red when they are mad but just because they aren’t wearing red doesn’t mean they are happy.
On top of this, sometimes you need to see how people act in different situations during different periods of their lives. If an individual goes through a difficult situation, their response may or may not be representative of who they are but it is a signal you take into account.
Life never sends clear signals because life is full of people. Markets are made up of people.
Again, this idea of “signals” in a complex system is intuitive to each of us because we all interact with other people. Alright, let’s transition to markets!
Economic Data Time Lags:
When we are talking about economic data there are several things you need to keep in mind:
Economic data is lagged which is totally fine. Just because data is lagged doesn’t mean it’s useless or not used for making future decisions. I hear a lot of people say that “the data is lagged and shouldn’t be used.” This misses the entire point of how the market and sophisticated participants view economic data (we will get into this).
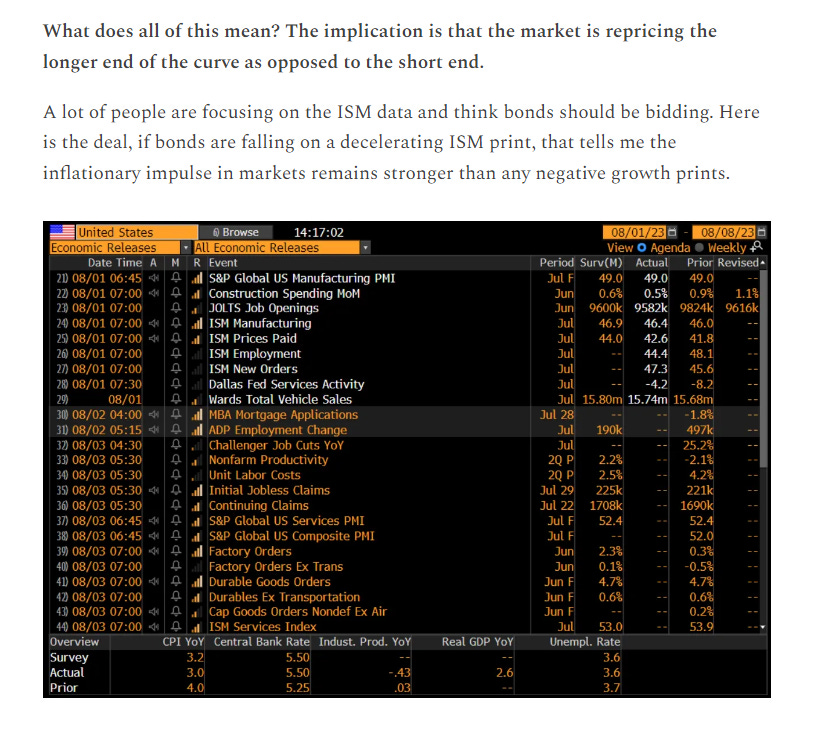
Market participants are always interpolating economic data with other data points. What does this mean? Basically, market participants are always running regressions/netting out every data point to get an idea of the relationships. For example, the ISM services price index came in above expectations today.
Does the ISM services price index have a close relationship with core/services CPI? Yes, there is a reasonable relationship with it. Do they always move in lockstep? No, there will be continuity and discontinuity depending on the specific situation but it’s not crazy to think that there is a conceptual and tangible relationship between the two.
And think about it like this, every fixed income trader is grasping at every data point they can to inform their view of inflation. On top of that, we just had core PCE tick up marginally last week. I already mentioned how this week will be important for positioning preparing for CPI (link) so it’s not unreasonable for bonds to sell off on a hot ISM services price print.
Final principle, the past is priced in but revisions can have an impact IF they change expectations of the path forward. Revisions in economic data are always important to keep an eye on but as we have seen with NFP revisions, multiple revisions don’t mean the bond market needs to gap up and reprice recession risks.
This is what brings us to how lagging data connects with a forward-looking market.
The market is Forward-Looking and Adjusts Expectations:
The market constantly has embedded assumptions about future growth and inflation that are based on lagged economic data. However, it is usually, to some degree, extrapolating economic data. (There is really a lot more complexity that goes into visibility but most large hedge funds have a very clear top-down and bottom-up picture of what is happening.)
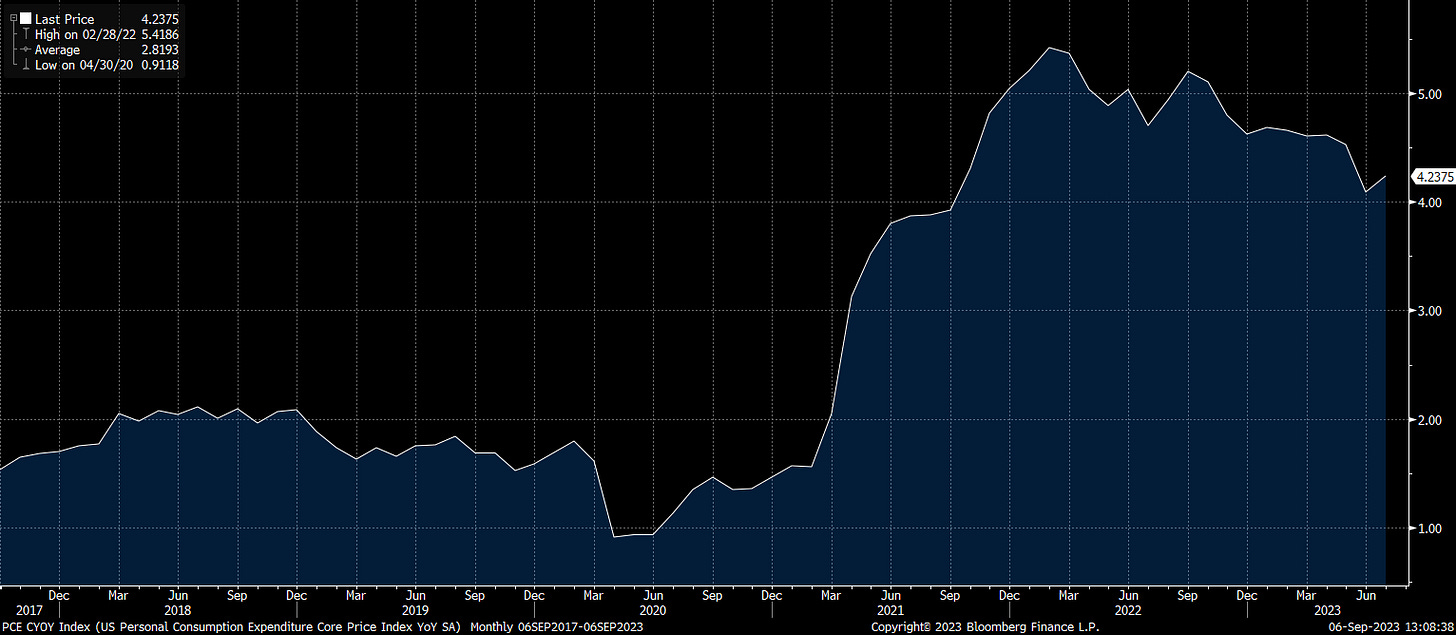
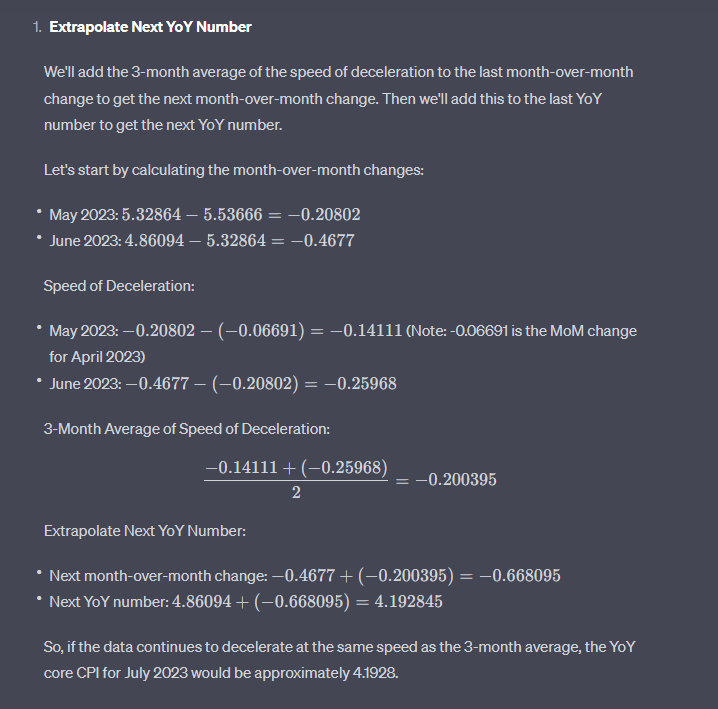
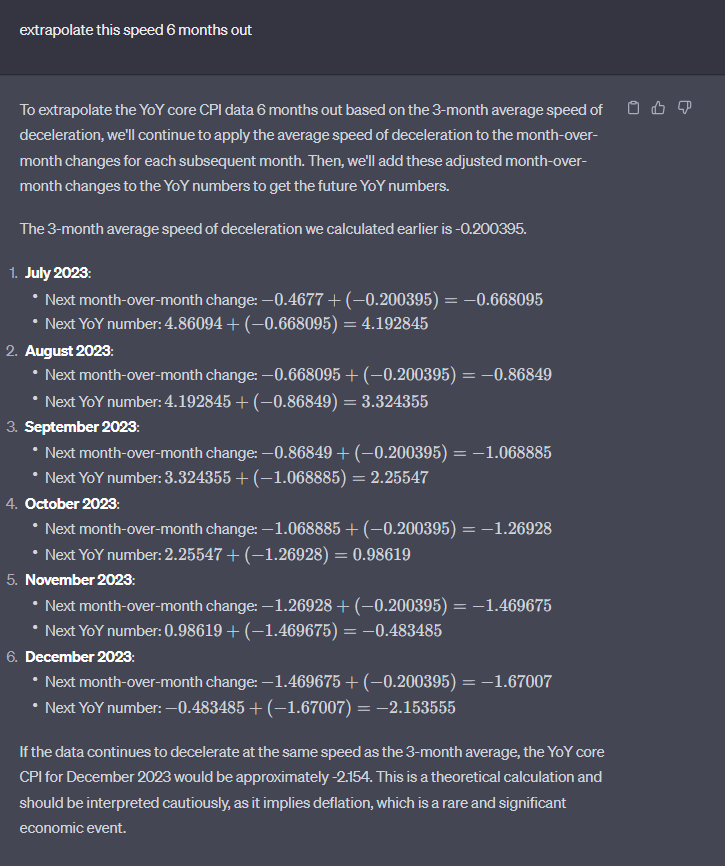
Let me provide an example: take the YoY core CPI data (link) and paste it into ChatGPT
To be clear, this is a very basic model with reductionistic and naive assumptions but market participants are always delineating economic data into market regimes and extrapolating future data based on the current speed and preconditions surrounding the most recent data print.
Most economic models display a distribution of outcomes and then as data is released, they extrapolate the data again.
So when people say there are specific data prints that “lag” other data prints, I mean yeah to a certain extent but everyone knows that. When people say “Unemployment is a lagging data print,” we all know this and adjust accordingly. On top of this, we can have a reasonable understanding of the labor market through other data prints because labor is obviously connected to consumption and other components of GDP.
So big picture, the markets are in a constant state of forward expectations that are constantly revised as data comes out. If you want to look into the types of models for economic data, you can look into various econometric models. There are a number of models I am doing research on in connection with machine learning that I think show a lot of promise.
Expectations vs Actual Matrix:
Alright, so you have your economic model mapping data and running regressions of it against other data points. From here, you want to model out an expectations vs actual matrix. When a data print comes out, there are several scenarios that can occur:
Data print coming in line with expectations
Data print coming in above expectations
Data print coming in below expectations
From here, you want to map the various market pricing and its response to it.
Market Pricing Response:
First, you need to determine how the market is pricing economic data. For example, for inflation, you can look at the forward inflation swap curve and FED fund futures curve. You then compare the market pricing to what is likely to occur in the economic data given the preconditions around growth and inflation that exist.
After you have determined the risk-reward skew, compare the market reaction to the expectation vs actual matrix. (You also want to do little things like identifying the market response and if the price actually closes higher/lower or if it just mean reverts. You can also map the degree of moves with standard deviation).
As a result, we have the following scenarios:
Data Print Coming In Line With Expectations
Bullish Price Action Response
Bearish Price Action Response
Neutral Price Action Response
Data Print Coming In Above Expectations
Bullish Price Action Response
Bearish Price Action Response
Neutral Price Action Response
Data Print Coming In Below Expectations
Bullish Price Action Response
Bearish Price Action Response
Neutral Price Action Response
As I have said many times on this Substack, the market is pricing unknowns and the way in which you extract returns from the market is by accepting a risk premia for warehousing an asset’s uncertainty.
The market is in a constant state of pricing information that moves across the spectrum of uncertainty to certainty. So you always want to identify what is unknown. At the end of the day, none of us have a clue if there will actually be a recession in 6 months or not. Since no one knows for sure, the market can change its risk premias to attract capital to warehouse risk.
Bring it all together:
So with all of this said, you always want to have a really clear read into how the market is pricing economic data. For example, look at my comment from a month ago on ISM data (link):
Simply observing how markets are pricing data can be incredibly telling for the downside. The yellow line is where I made the observation about the ISM and you can see the price action of interest rates since then:
I will end with two things:
None of us are going to get it right all of the time because we fundamentally don’t know the future. Markets are about interpreting the risk-reward correctly and then managing the risk of holding assets. Trading is NOT easy because managing risk is NOT easy.
The monthly macro reports and weekly updates for Subscribers cover how I am interpreting these dynamics (examples: link and link). At any time you can ask questions in the comments about specific data prints or how my models are interpreting the market environment. I truly appreciate your patronage and support!
Keep up the good work!
Thanks for reading!


"You then compare the market pricing to what is likely to occur in the economic data given the preconditions around growth and inflation that exist. After you have determined the risk-reward skew, compare the market reaction to the expectation vs actual matrix."
Could you please show a pratical application of this form of acumen on any fx pair
Maybe a newsletter on your past trades and why they played out nicely. We'd love to see more of this type of content 💪