

Trade Write-Up: BITCOIN Flows Analysis and Trade Implications
Mapping all the changes in macro risk and the credit cycle for Bitcoin

Trade Write-Up: BITCOIN Flows Analysis and Trade Implications
In this write-up, I am going to lay out the macro context for Bitcoin, HOW we got here, and WHERE we are likely to go. When you understand this context, the trade implications become much clearer.
As a reminder, I explained the global liquidity context for HOW cross-border flows are critical to understand right now. This will directly tie in with Bitcoin because it is a release valve for macro liquidity on an international basis.

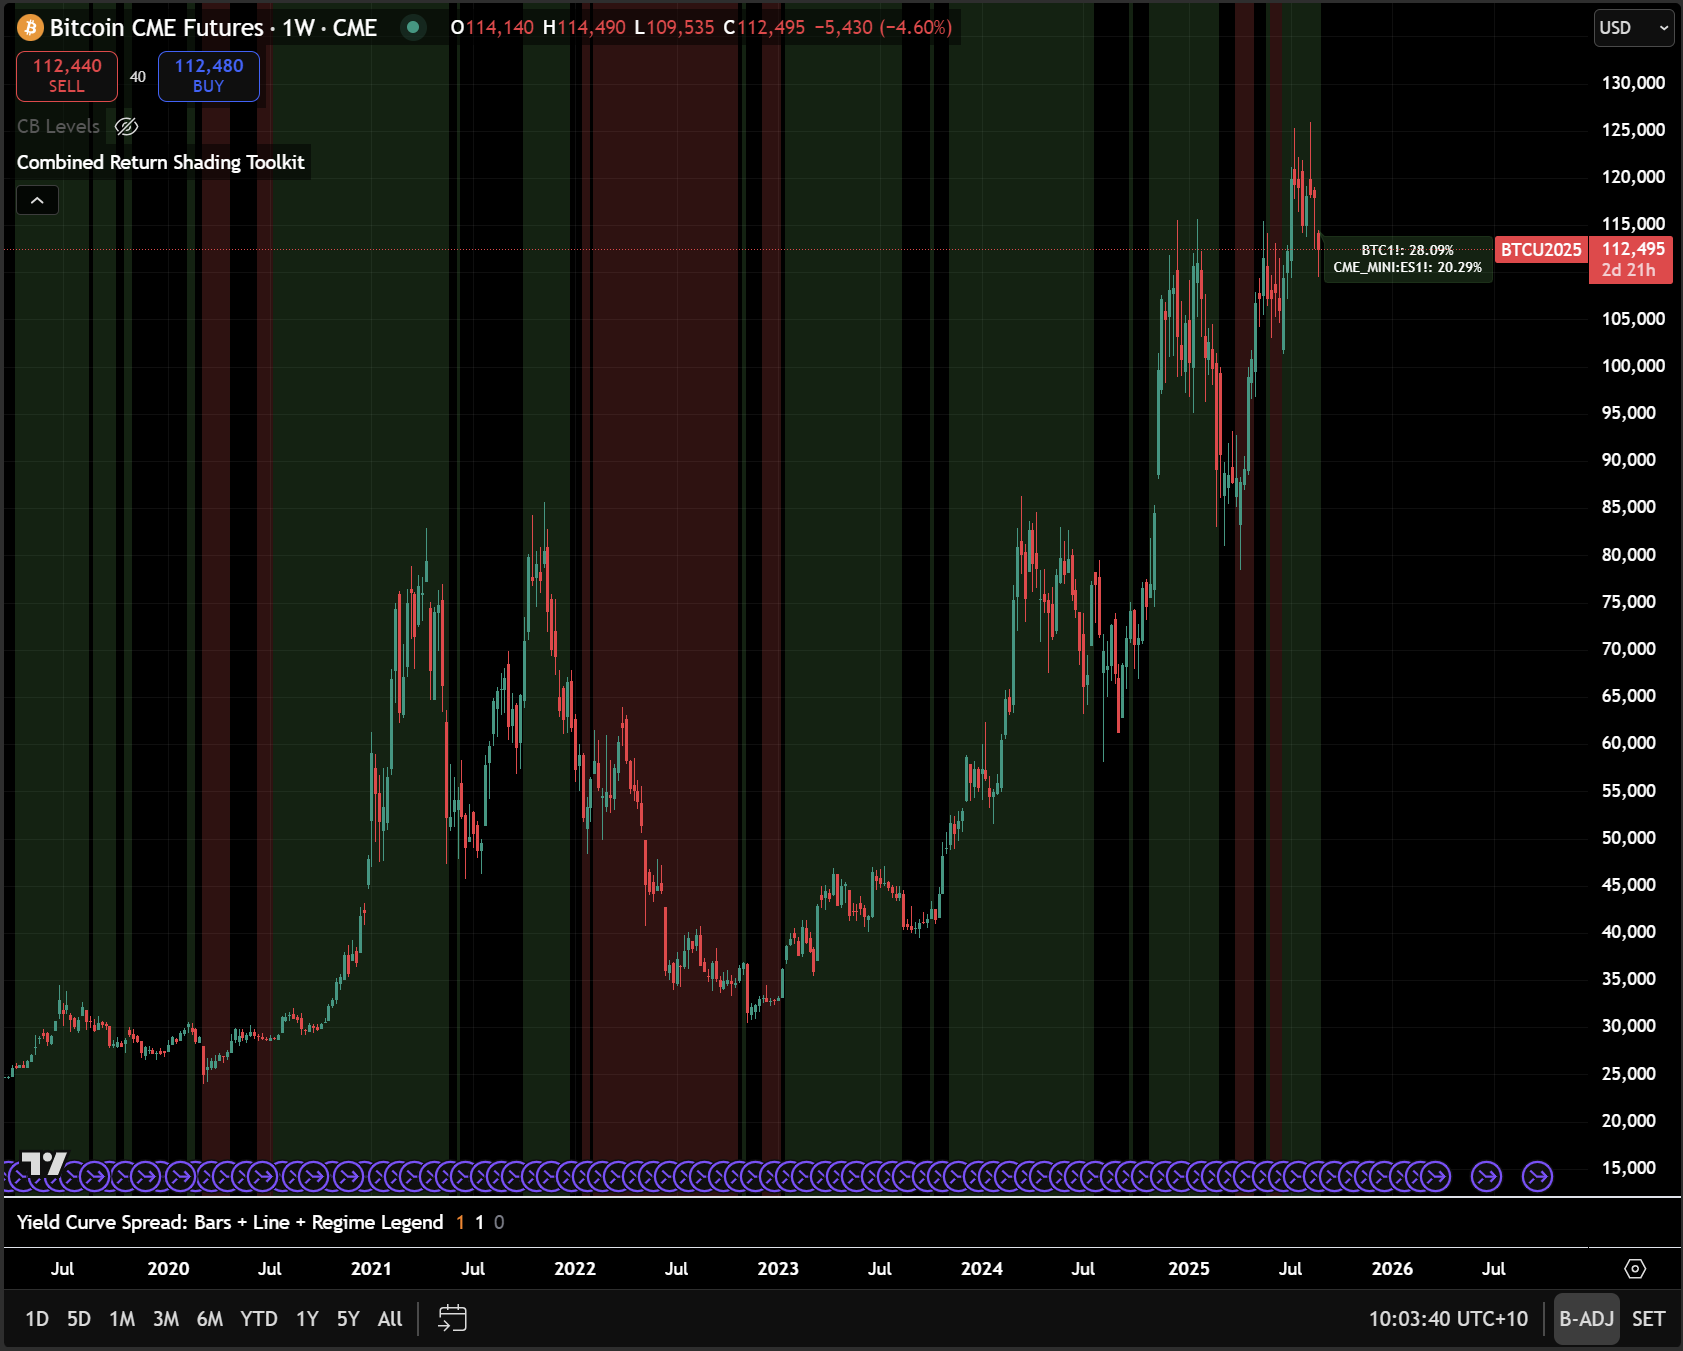
I would also review the Bitcoin primer and the connected Tradingview script linked in this report:

The Macro Context:
One of the main ideas I laid out for paid subscribers after Jackson Hole was that the Fed is allowing cuts to be priced into elevated inflation risk and resilient growth. Just remember, Powell can come out at any time and say something explicitly hawkish that would reprice the forward curve. The fact that he isn’t is becoming a clear indication that the Fed is ok with HOW MANY cuts are priced for 2025 and 2026. The steepening in the curve shows the Fed’s inaction being priced as well.
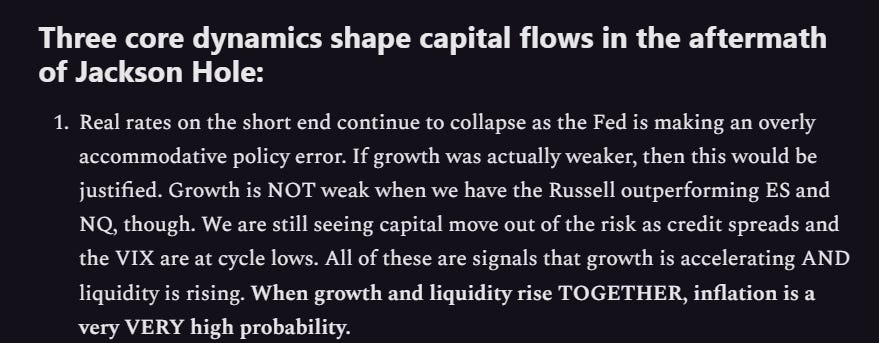

The chart below is the rate of change in 2 year real rates inverted. In simple terms, when we are in a green regime, real rates are putting UPWARD pressure on the price of Bitcoin. There are some lead lags in this, dependent on FX liquidity and how the yield curve is functioning.
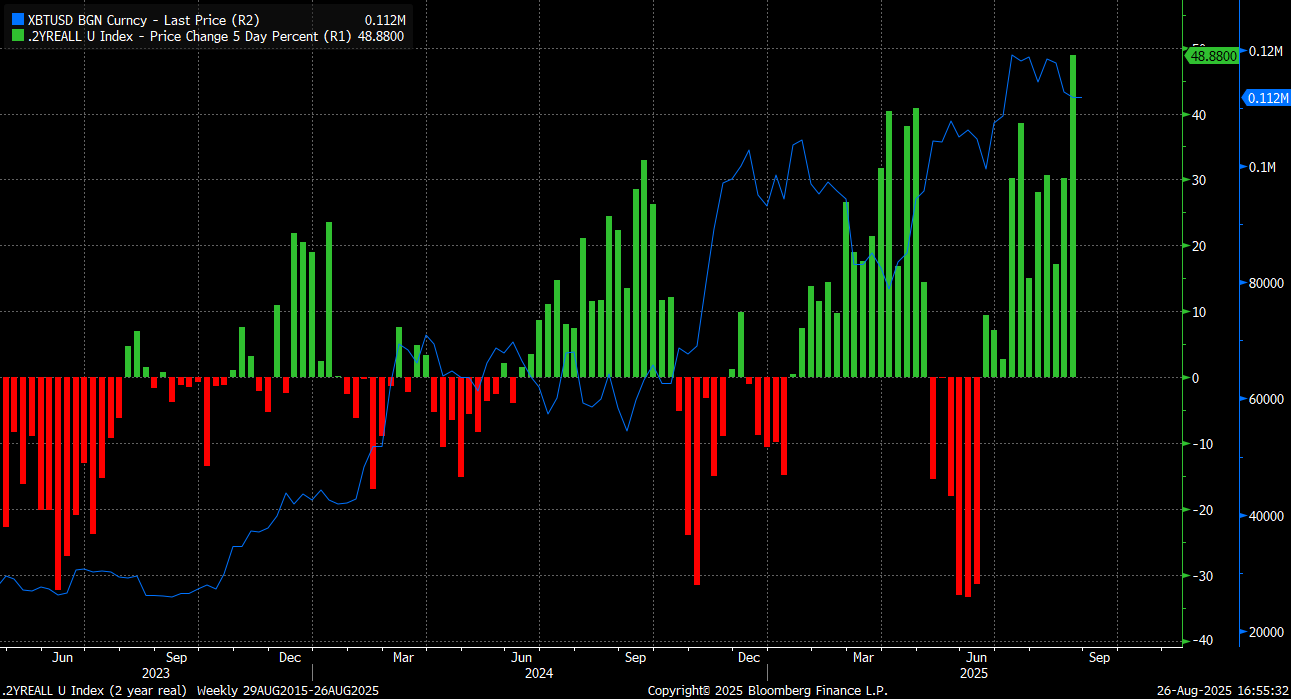
However, since 2023, real rates have been moving DOWN, which has been one of the primary drivers in Bitcoin. We remain in a regime where Bitcoin is skewed to the upside. The primary thing we need to manage is the risk of positioning unwinds and deviations from risk asset flows.
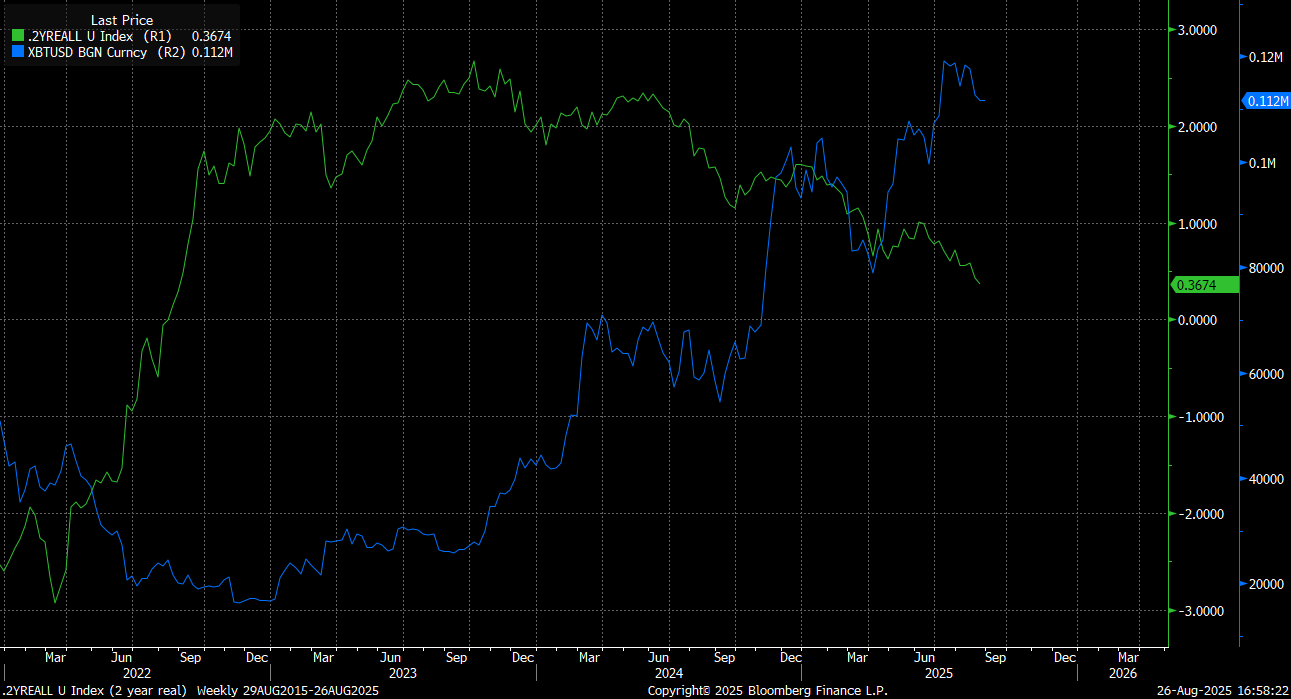
Bitcoin began to underperform ES AND show negative returns on an outright basis ever since the rejection from the 124k level. This is why I went neutral in the short term. You will notice that we are no longer in a green regime. Again, you can find the Tradingview script for this here: LINK
Bitcoin Maxi’s refuse to acknowledge that Bitcoin can and does have periods of underperformance against equities when liquidity is contracting. Everyone knows that we are outperforming on the longer-term weekly time horizon: The goal is to map the signals across ALL time horizons so we can moderate our views incrementally. If we began to move into a 2022-type bear market again, there is NO WAY I would be leveraged long and take a drawdown. Even if someone is a long-term hodler, establishing an optimal cost basis is critical.
This brings us to the shorter time horizon and trading implications.
Trade Tensions and Risk Reward:
Keep reading with a 7-day free trial
Subscribe to Capital Flows to keep reading this post and get 7 days of free access to the full post archives.