Comprehensive Macro Report
How market participants misinterpret the macro environment and provide alpha skilled traders
Intro:
As I noted in the 1-year accomplishment article (link): Get ready to move A LOT faster
This macro report is just the beginning. I will be releasing several additional alpha reports this week for paid subscribers. As a reminder, the price of the Substack will be increasing to $60 a month ($720 annually) on March 31st. If you Subscribe BEFORE then you can lock in the lower rate of $50 a month ($600 annually).
Context:
To frame this macro report, I would encourage you to check out the following pieces I published recently:
Inflation Playbook: How inflation works and a list of resources to read to understand it
A conversation with
on how interest rate mechanics work and term premia function: LinkHow to think about what is seen and unseen in financial markets
Podcast I did with
on trades in single name equities: Link
Macro Report:
Intro: The current macro environment is one of very specific tensions that continue to be misinterpreted by market participants. Additionally, we continue to see assets present opportunities for generating alpha as they are positioned incorrectly in the macro regime.
There are two primary tensions that market participants are misinterpreting: 1) tensions in growth and 2) tensions in inflation.
Tension #1: A large number of market participants continue to believe that a recession is imminent and that we are simply seeing an extended lag in monetary policy. While recessions and expansions are part of historical cycles, the important thing is managing the timing. A recession could theoretically occur this year, in three years, or in 10 years. While the Fed’s hiking cycle is an important component of assessing the probability of a recession, hiking rates on its own doesn’t inherently increase the probability of a recession. The transmission of hikes and the pervasiveness of weakness in growth must be used in combination with the impulse from monetary policy to correctly determine the probability of a recession. The evidence we are seeing from growth data, credit signals, and monetary policy continues to point to a low probability of a recession in 2024.
The market participants placing bets on an imminent recession have been and are very likely to continue losing capital or significantly underperforming their respective benchmarks. Net COT positioning in the index continues to show active managers positioned net short.
This positioning dynamic is reflected in the extreme underperformance of hedge funds in 2023 and YTD compared to the S&P500:
This idea of an imminent recession is also reflected in how market participants are positioned on the forward curve for rate expectations. As we entered 2024, the December 2024 SOFR contract was pricing an implied rate of less than 3.70%. Due to the resilience in growth and inflation prints, these expectations were repriced:
Both the equity positioning and rate expectations positioning reflect how market participants are misinterpreting the underlying tensions of growth and inflation.
Tension #2: The second tension is intricately connected with tension #1. While inflation has a reasonable probability of decelerating, it is highly unlikely we will return to the LEVEL of inflation seen in the 2010s or the TYPE of monetary policy conducted during that time. Due to the underlying pressures supporting nominal growth and resilience in the economy to rate hikes, inflation is likely to remain above the Fed’s 2% goal and fluctuate in a range.
This report will provide a proper analysis of the tensions noted above and correctly connect them to asset prices to determine the risk-reward.
Growth and Inflation:
The three primary line items of GDP are currently making a positive contribution to the headline number. Personal consumption, investment, and government spending are all accelerating:
Personal consumption is showing an acceleration in both goods and service spending:
Real goods spending (blue) remains positive as goods prices are actually in deflationary territory on a YoY basis. The implication is that goods spending is resilient in the face of rate hikes. This is one of the factors creating the Goldilocks impulse in financial markets.
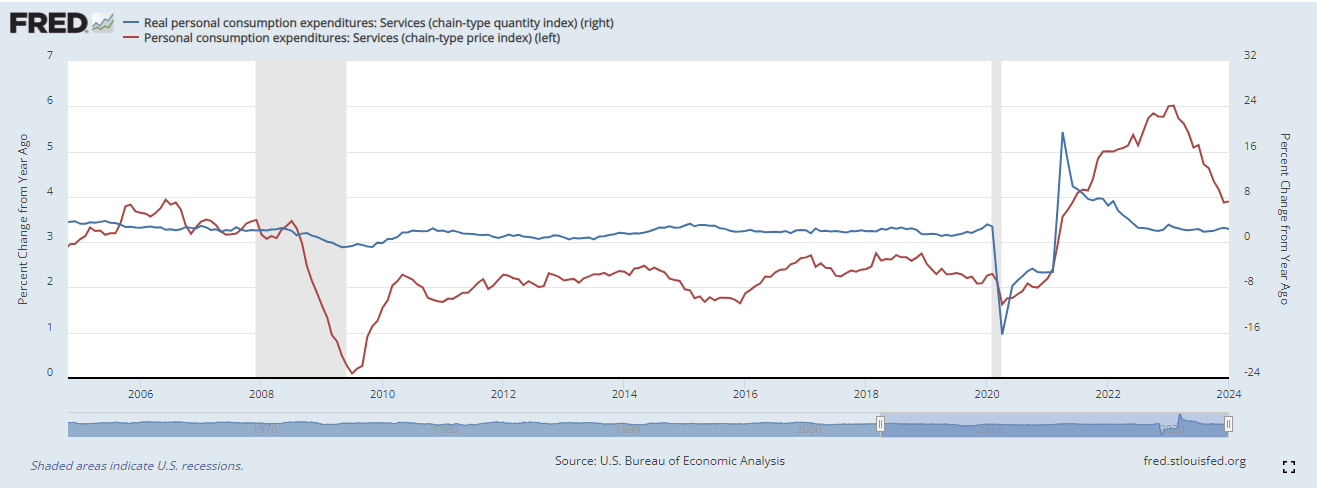
Real services spending (blue) remains squarely in positive territory as service prices (red) are decelerating:
Both goods and service spending in personal consumption remain positive and do not show any blatant signs of a recession.
The primary data point bears will typically draw attention to for a recessionary view is investment because it typically has a higher sensitivity to interest rates. While there was a predictable contraction in residential investment due to hiking in 2022, we have seen a reacceleration in the data. Furthermore, nonresidential investment remained positive for all of 2022 which is a signal of how resilient the economy is to higher interest rates:
These two line items of investment are important to understand for the current macro regime. The residential line item of investment is from the housing market which has shown significant discontinuity to 2008 due to the low amount of adjustable rate mortgages. This discontinuity is clearly reflected in the divergences we are seeing within the housing market data.
Building permits and housing starts fell during 2022 due to the hiking cycle but as things normalized, they are accelerating again:
The current cycle's discontinuity to 2008 is reflected in the divergence between new/existing home sales (white and blue) and home prices (case Shiller in green). If the hiking cycle was having a pervasive enough impact to cause a recession in 2024, home prices (green) would be following transactions (white and blue) as opposed to accelerating:
Mortgage delinquencies have remained suppressed during the entire hiking cycle:
While the hiking cycle has impacted transactions in the housing market, it has not transmitted through to the consumer balance sheet to cause them to decrease consumption. It is this transmission mechanism that bears continue to ignore.
The nonresidential line items of investment continue to accelerate on net as construction spending due to onshoring increases:
While the YoY number is rolling over from its high, there would be a significant period of time before we even enter the possibility of outright contraction:
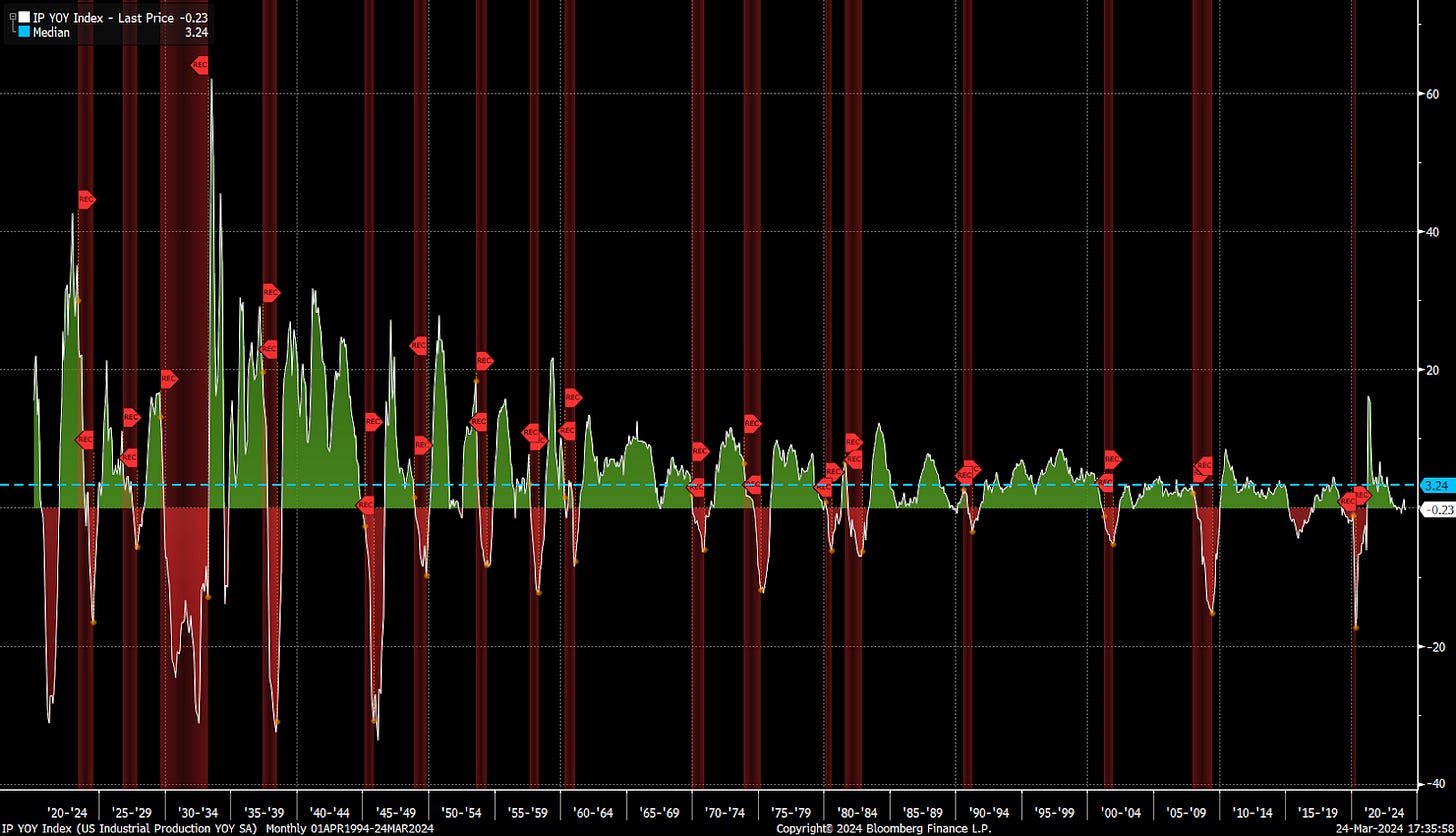
Within the overall dispersion of growth, there is an important data point to hold in tension and that is industrial production. As of the most recent data release, industrial production is marginally negative on a YoY basis:
In the past, industrial production would have a larger drag on overall GDP but as the economy shifts more towards services spending (especially after COVID-19), the transmission decreases. This is also reflected in the quantity of goods (white) vs services (blue) contributing to GDP:
The final thing to note is diffusion indices such as the services PMI (blue) and manufacturing PMI (white). Fundamentally, these are diffusion indices showing the aggregated marginal change of data points. These diffusions still need to be quantified in their transmission to top-line nominal and real GDP numbers. While the manufacturing ISM is marginally negative, the services ISM remains above 50.
The implication of these tensions indicates a low probability of a recession in 2024. These data points also frame the inflation picture and thereby risk-reward for interest rates.
Interest Rate Strategy:
Keep reading with a 7-day free trial
Subscribe to Capital Flows to keep reading this post and get 7 days of free access to the full post archives.


